Climate risk assessment: Brockton, Massachusetts

North Main Street, Brockton, Massachusetts
photo by John Phelan (CC-BY-SA 3.0)

Introduction
The impacts of climate change on the frequency and severity of physical hazards are putting many communities at risk. As the threat of climate change grows, so too does the need for accessible information, tools, and expertise to support climate-resilient decision making across multiple scales, from communities to countries. Woodwell Climate Research Center believes there is a need to localize and customize climate risk assessments. This information is critical for local government leaders as they make planning decisions, but it is not available to all communities. Woodwell Climate believes that this science should be freely and widely available. To address this gap, Woodwell Climate works with communities across the world, including Brockton, MA, to provide community climate risk assessments, free of charge.
Research area
Results summary
As a result of climate change, flood risk is projected to increase for Brockton. The probability of the historical 100-year rainfall event, a useful indicator of flood risk, is expected to be five times greater by mid century and ten times greater by the end of the century. Heavier rainfall will translate into greater flood depths and extent for Brockton. Here we present our findings on extreme precipitation and flooding to help Brockton in its plans to create a more resilient future for all residents.
Extreme rainfall
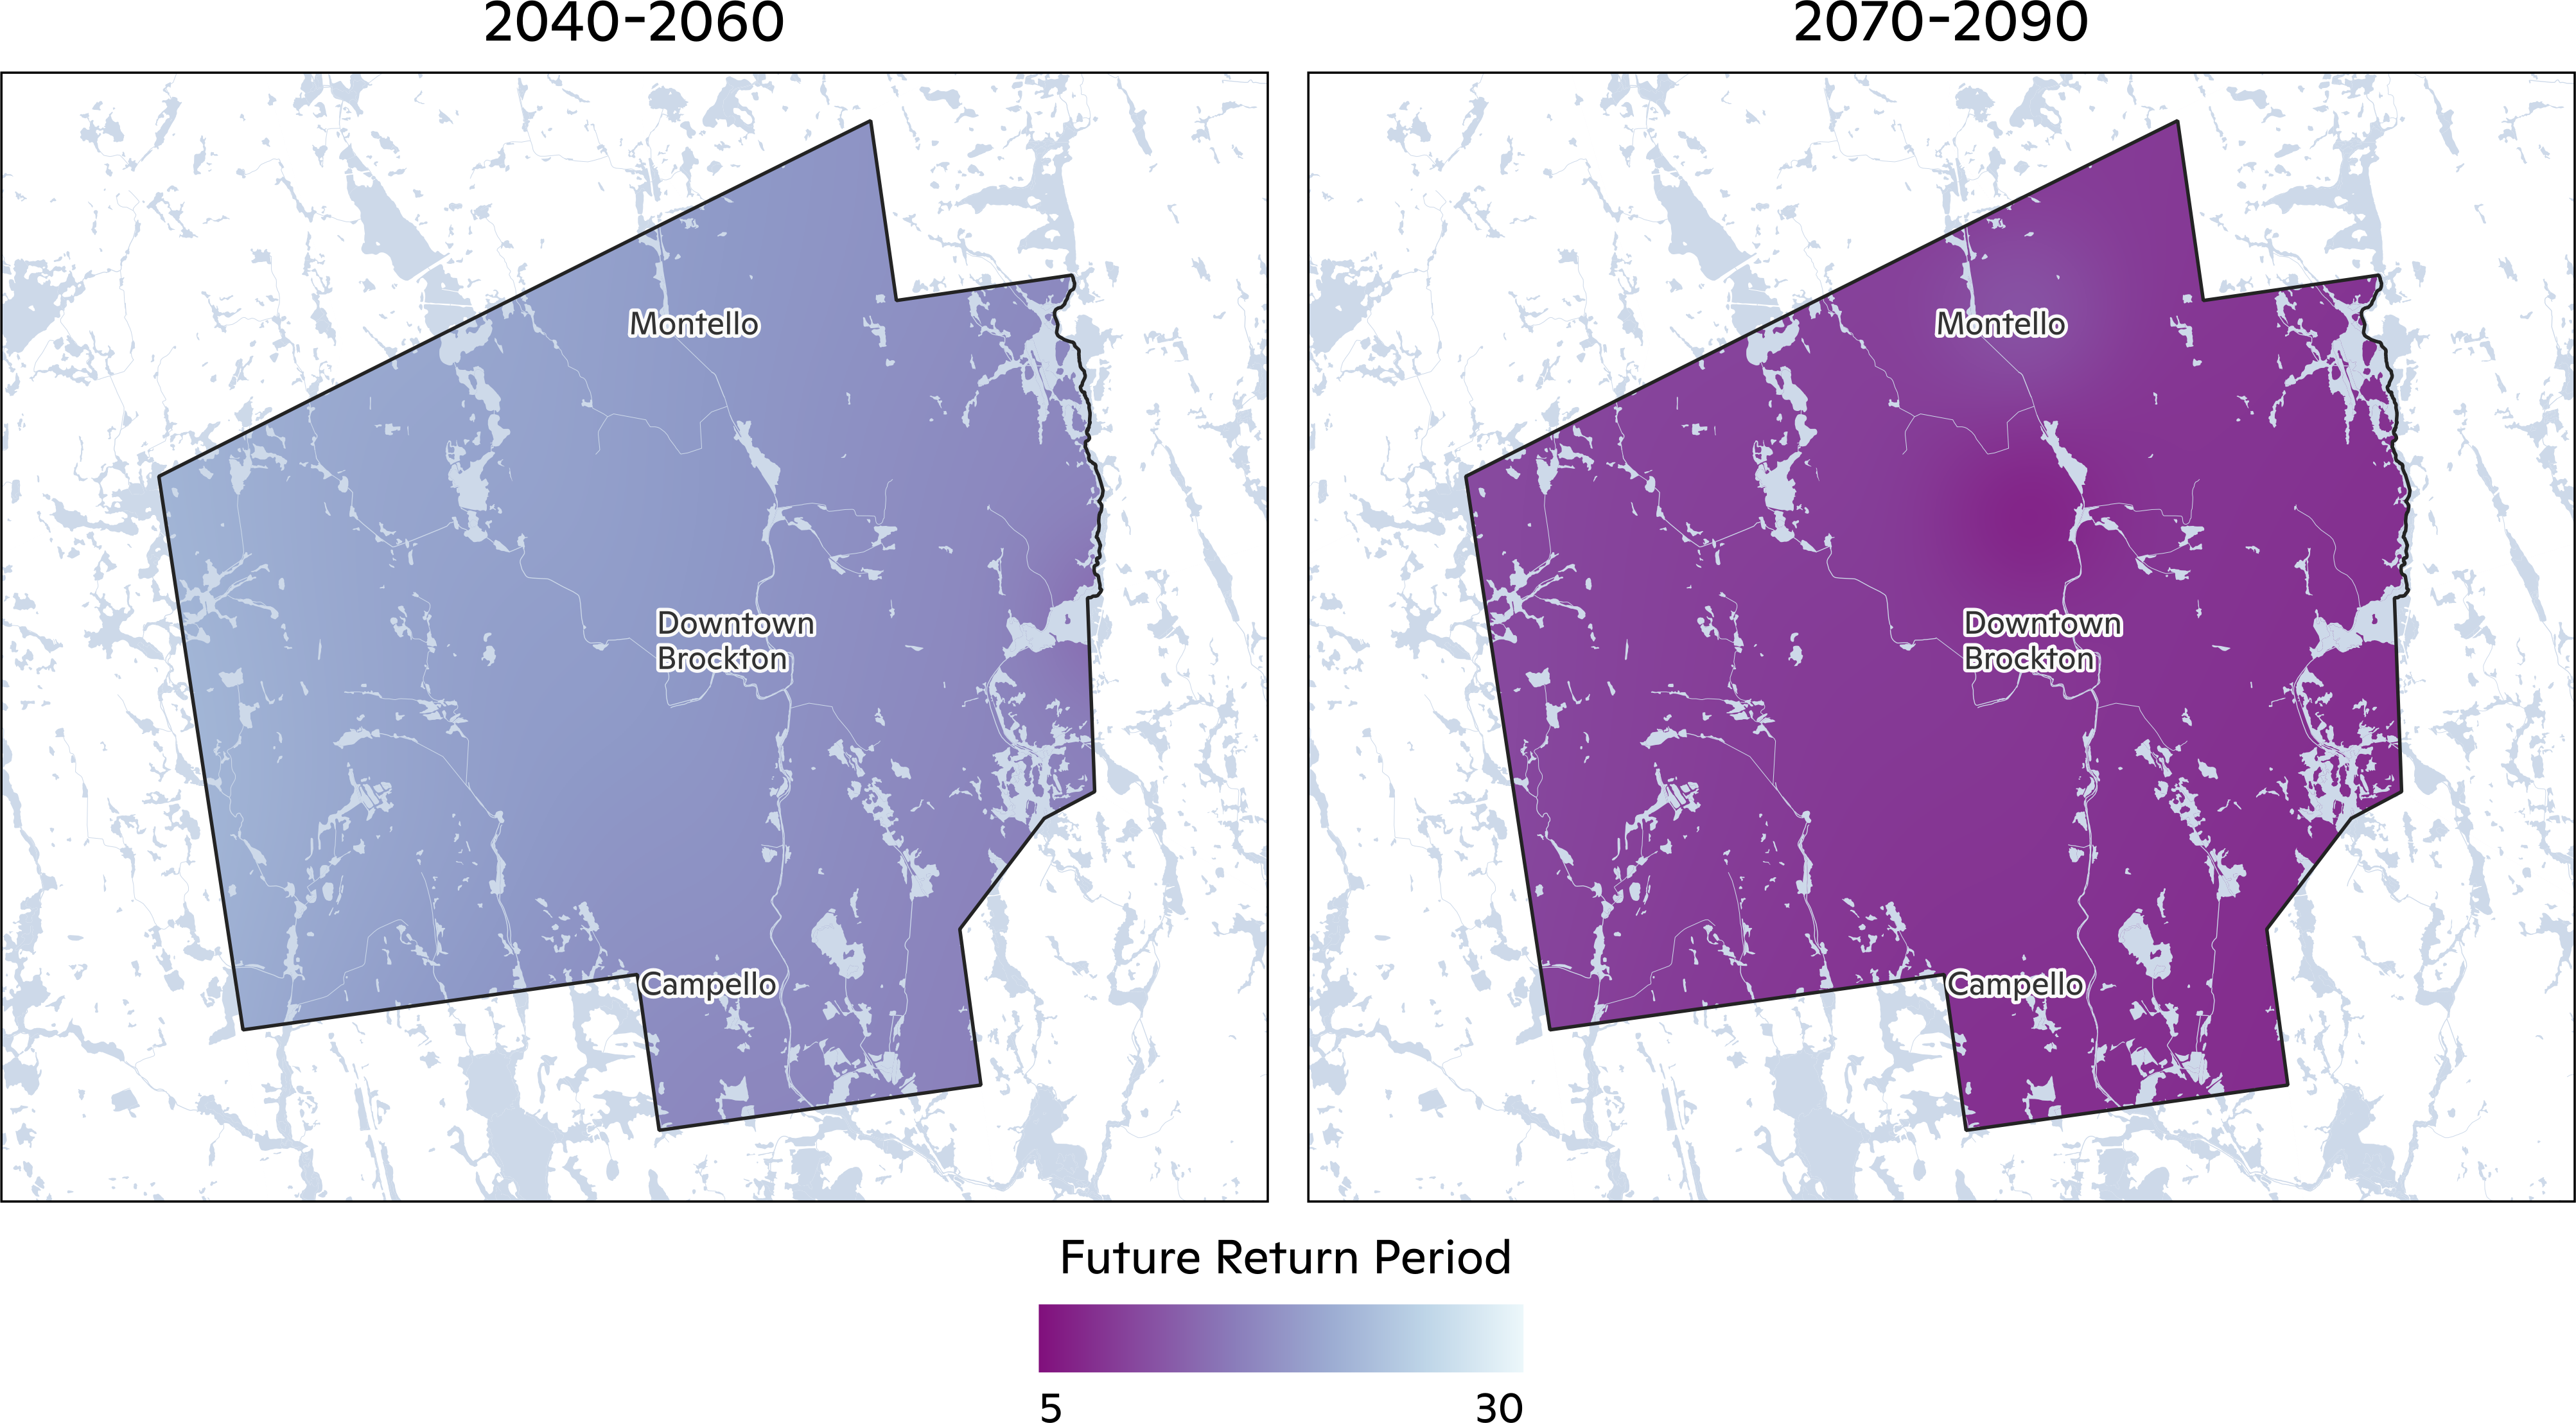
The Fourth National Climate Assessment shows that the U.S. Northeast region has already seen a 55% increase in annual precipitation occurring from the heaviest 1% of events.1 Future warming is expected to continue this trend of intensification meaning more frequent and severe rainfall events. Here we use localized future precipitation data from a downscaled global climate model to calculate the change in probability of extreme rainfall events. A detailed explanation of the precipitation data processing can be found in the methodology section of this document. In Figure 1, we show the changes in the return period of the historical (2000–2020) 100-year rainfall event for 2040–2060 and 2070–2090. By 2040–2060, the historical 100-year event will occur with a return period of roughly 1-in-20. By 2070–2090, the historical 100-year event will become a roughly 1-in-10 year event. For both future time periods rainfall changes are very uniform across all parts of Brockton.
According to the National Atlas 14 published by the National Oceanic and Atmospheric Administration (NOAA), the 100-year rainfall amount, based on historical rainfall records, in Brockton, MA is 7.75 inches (197 mm).2 By 2040–2060, the 100-year amount increases to 11.44 inches (291 mm) and by 2070-2090 this further rises to 15.47 inches (393 mm; Figure 2; Table 1). Similar to rainfall event frequency, future changes in rainfall amount are very uniform across all parts of Brockton.
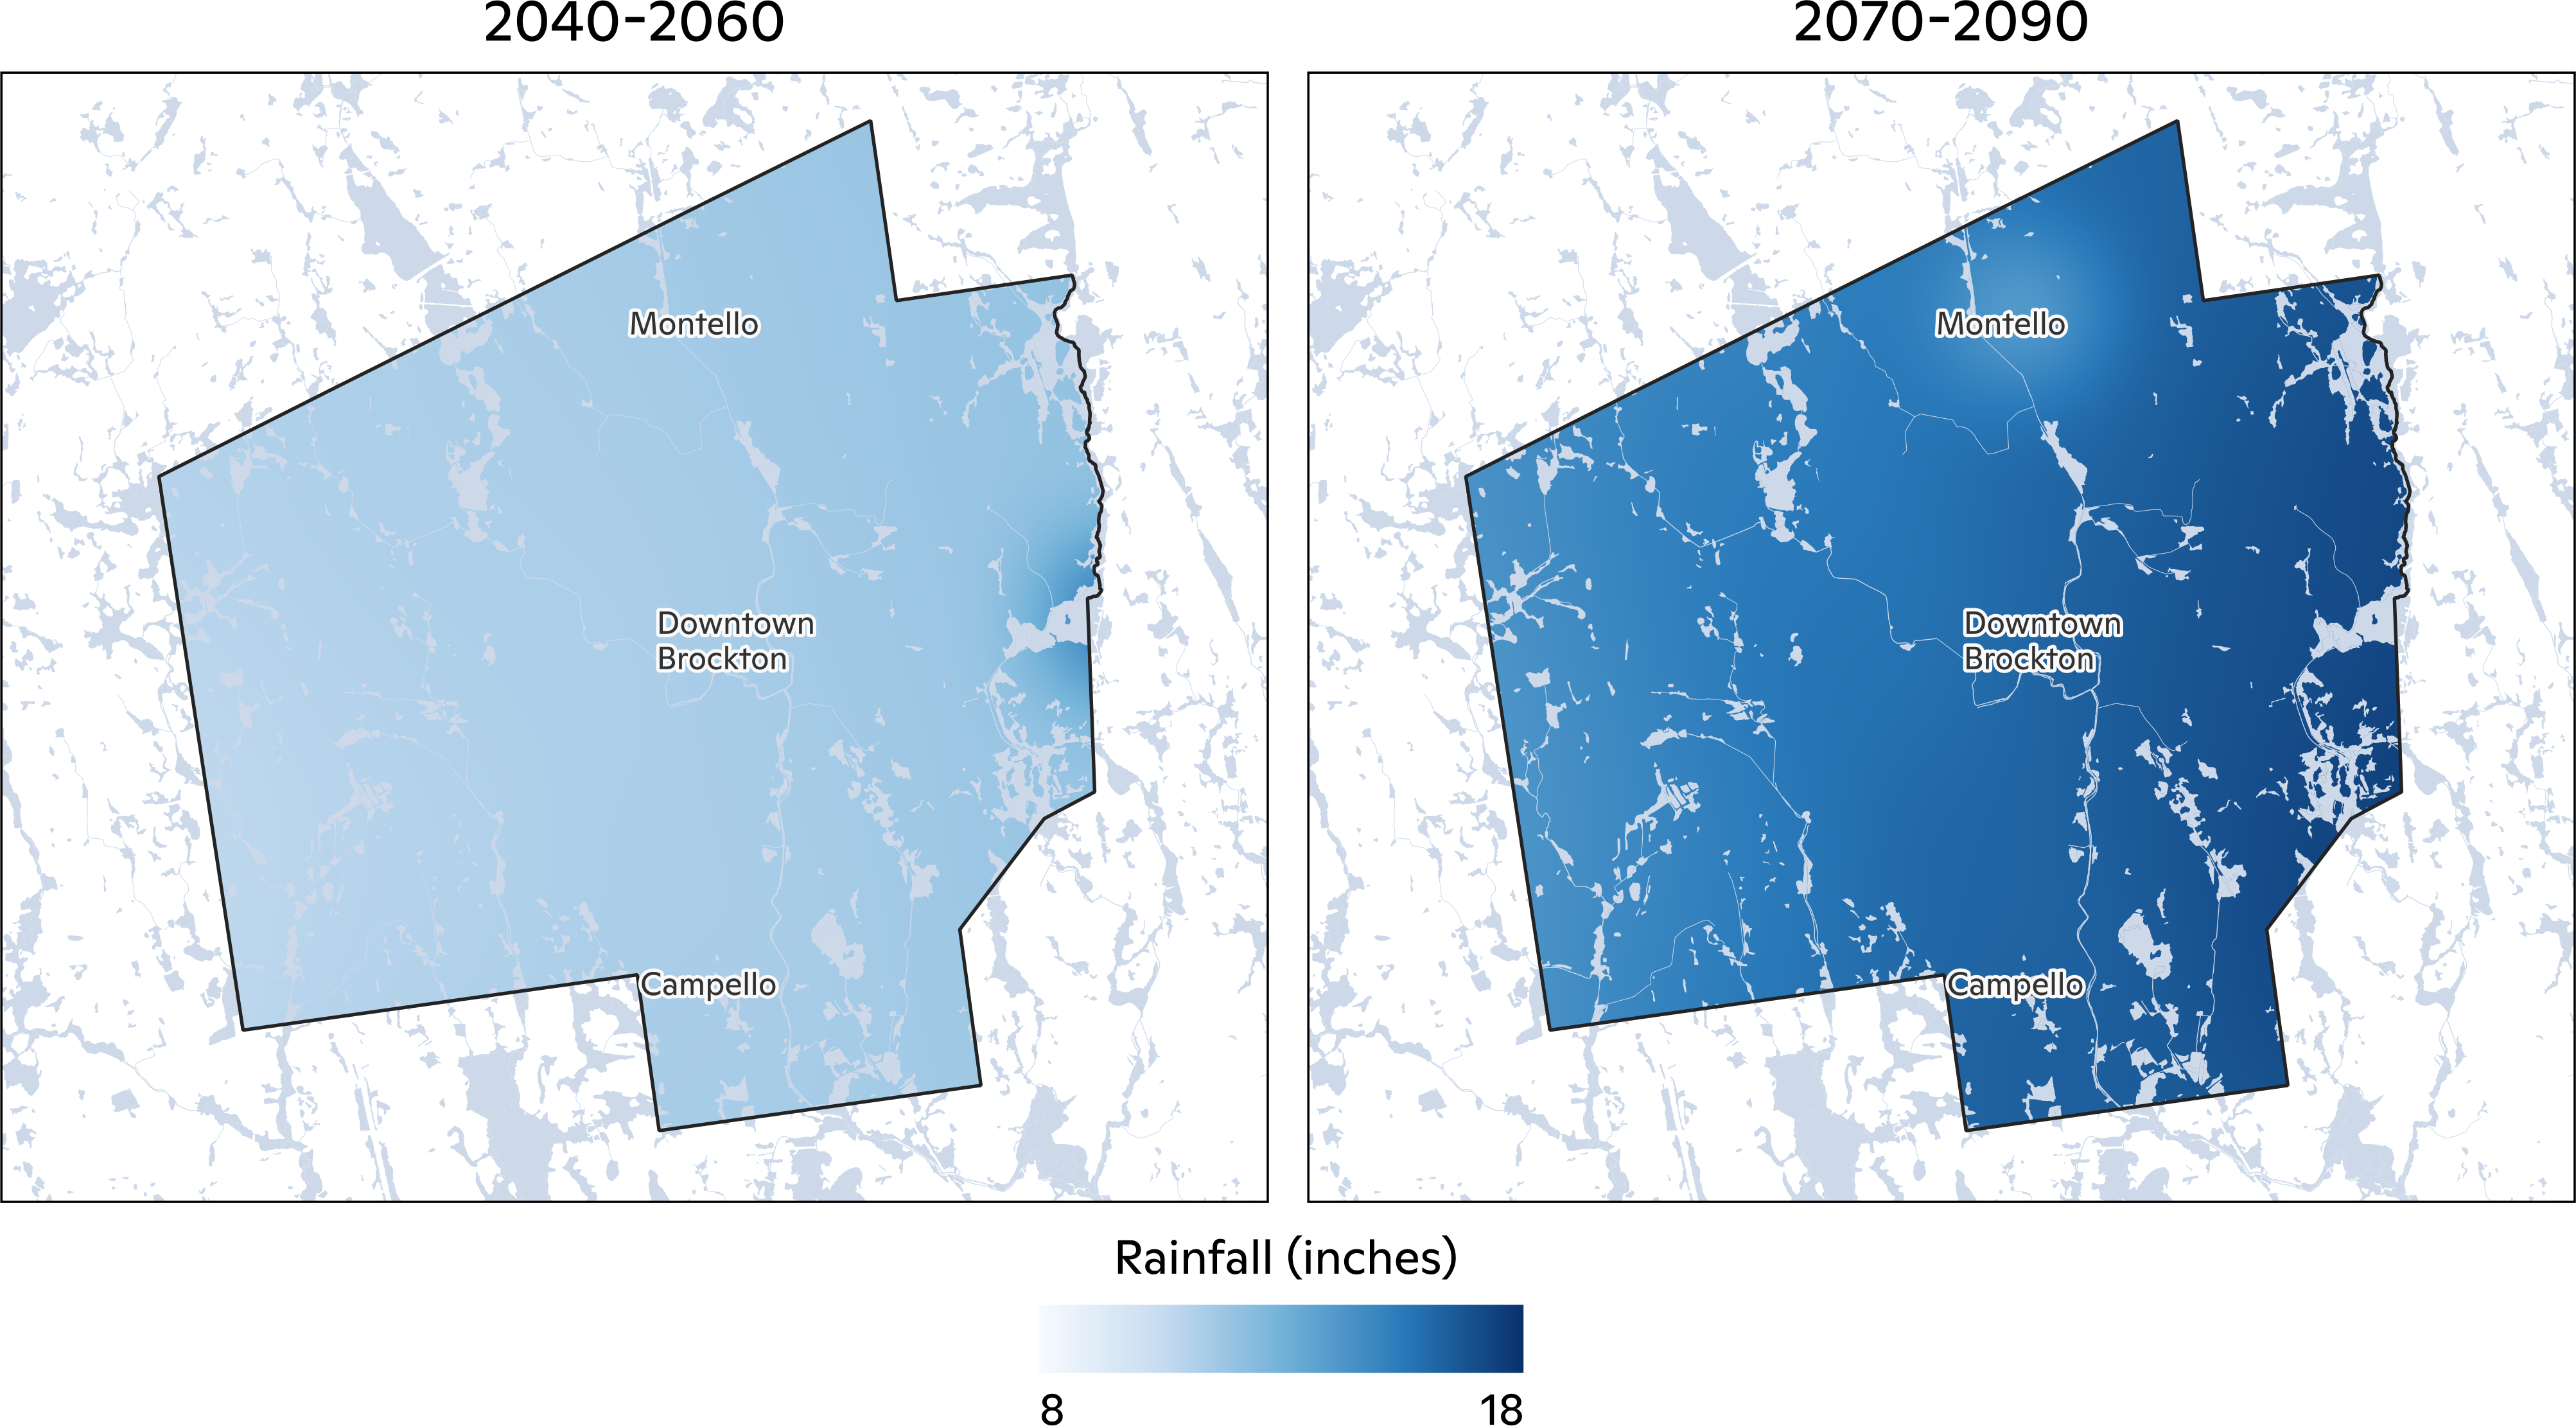
Figure 2: Mid and Late 21st Century Change in Historical 100-Year Rainfall. The future rainfall amounts in inches of the 2040–2060 (left) and 2070–2090 (right) 100-year rainfall event with the darker the blue, the greater the rainfall amount. By the mid 21st century and the late 21st century, the 100-year rainfall event is expected to drop 11.44 inches (291 mm) and 15.47 inches (393 mm), respectively, for most of Brockton.
| Present | 2040–2060 | 2070–2090 | |
| 100-Year | 7.75 in (197 mm) | 11.44 in (291 mm) | 15.47 in (393 mm) |
Table 1: Mid and Late-21st Century Change in Historical 100-Year Rainfall. The mean future rainfall amounts in inches and millimeters for Brockton of the present day, 2040–2060, and 2070–2090 100-year rainfall events.
Flooding
For a detailed explanation of the flood model input data and flood modeling procedures, please refer to the methodology section of this document.
Flood extent comparison
Before estimating future flood risk, we compare the present day flood risk results against the Federal Emergency Management Agency (FEMA) flood maps as a validation exercise. FEMA maps are not ground truth data, but it is useful to compare various model results given the lack of appropriate reference data. Figure 3 shows the differences and similarities between FEMA’s estimate and Woodwell’s estimate of the 100-year flood extent for the Brockton, MA region. Areas where only FEMA predicts flood risk are shown in turquoise, areas where only Woodwell predicts flood risk are shown in red, and areas where both predict flood risk are shown in blue. Several patterns emerge when comparing the extents visually. The riverine risk estimated by Woodwell is greater than FEMA estimates, particularly along Trout Brook. This is a result of rainfall not being accounted for in FEMA simulations. Finally, FEMA shows no flood risk in areas disconnected from rivers, also known as pluvial flooding, while Woodwell demonstrates extensive non-riverine areas are vulnerable to flooding. This is because FEMA does not account for pluvial flooding. In addition to a lack of pluvial flood risk in FEMA maps, certain areas (indicated by dashed lines in Figure 3) have not been modeled by FEMA at all. Finally, not only are the flood extents quite different, but the FEMA analyses used to generate the flood zones are out-of-date. While the effective year of the FEMA Flood Insurance Study for Brockton is 2012, the riverine modeling for Trout Brook, Salisbury Brook, and the Salisbury Plain River was completed 46 years ago.3
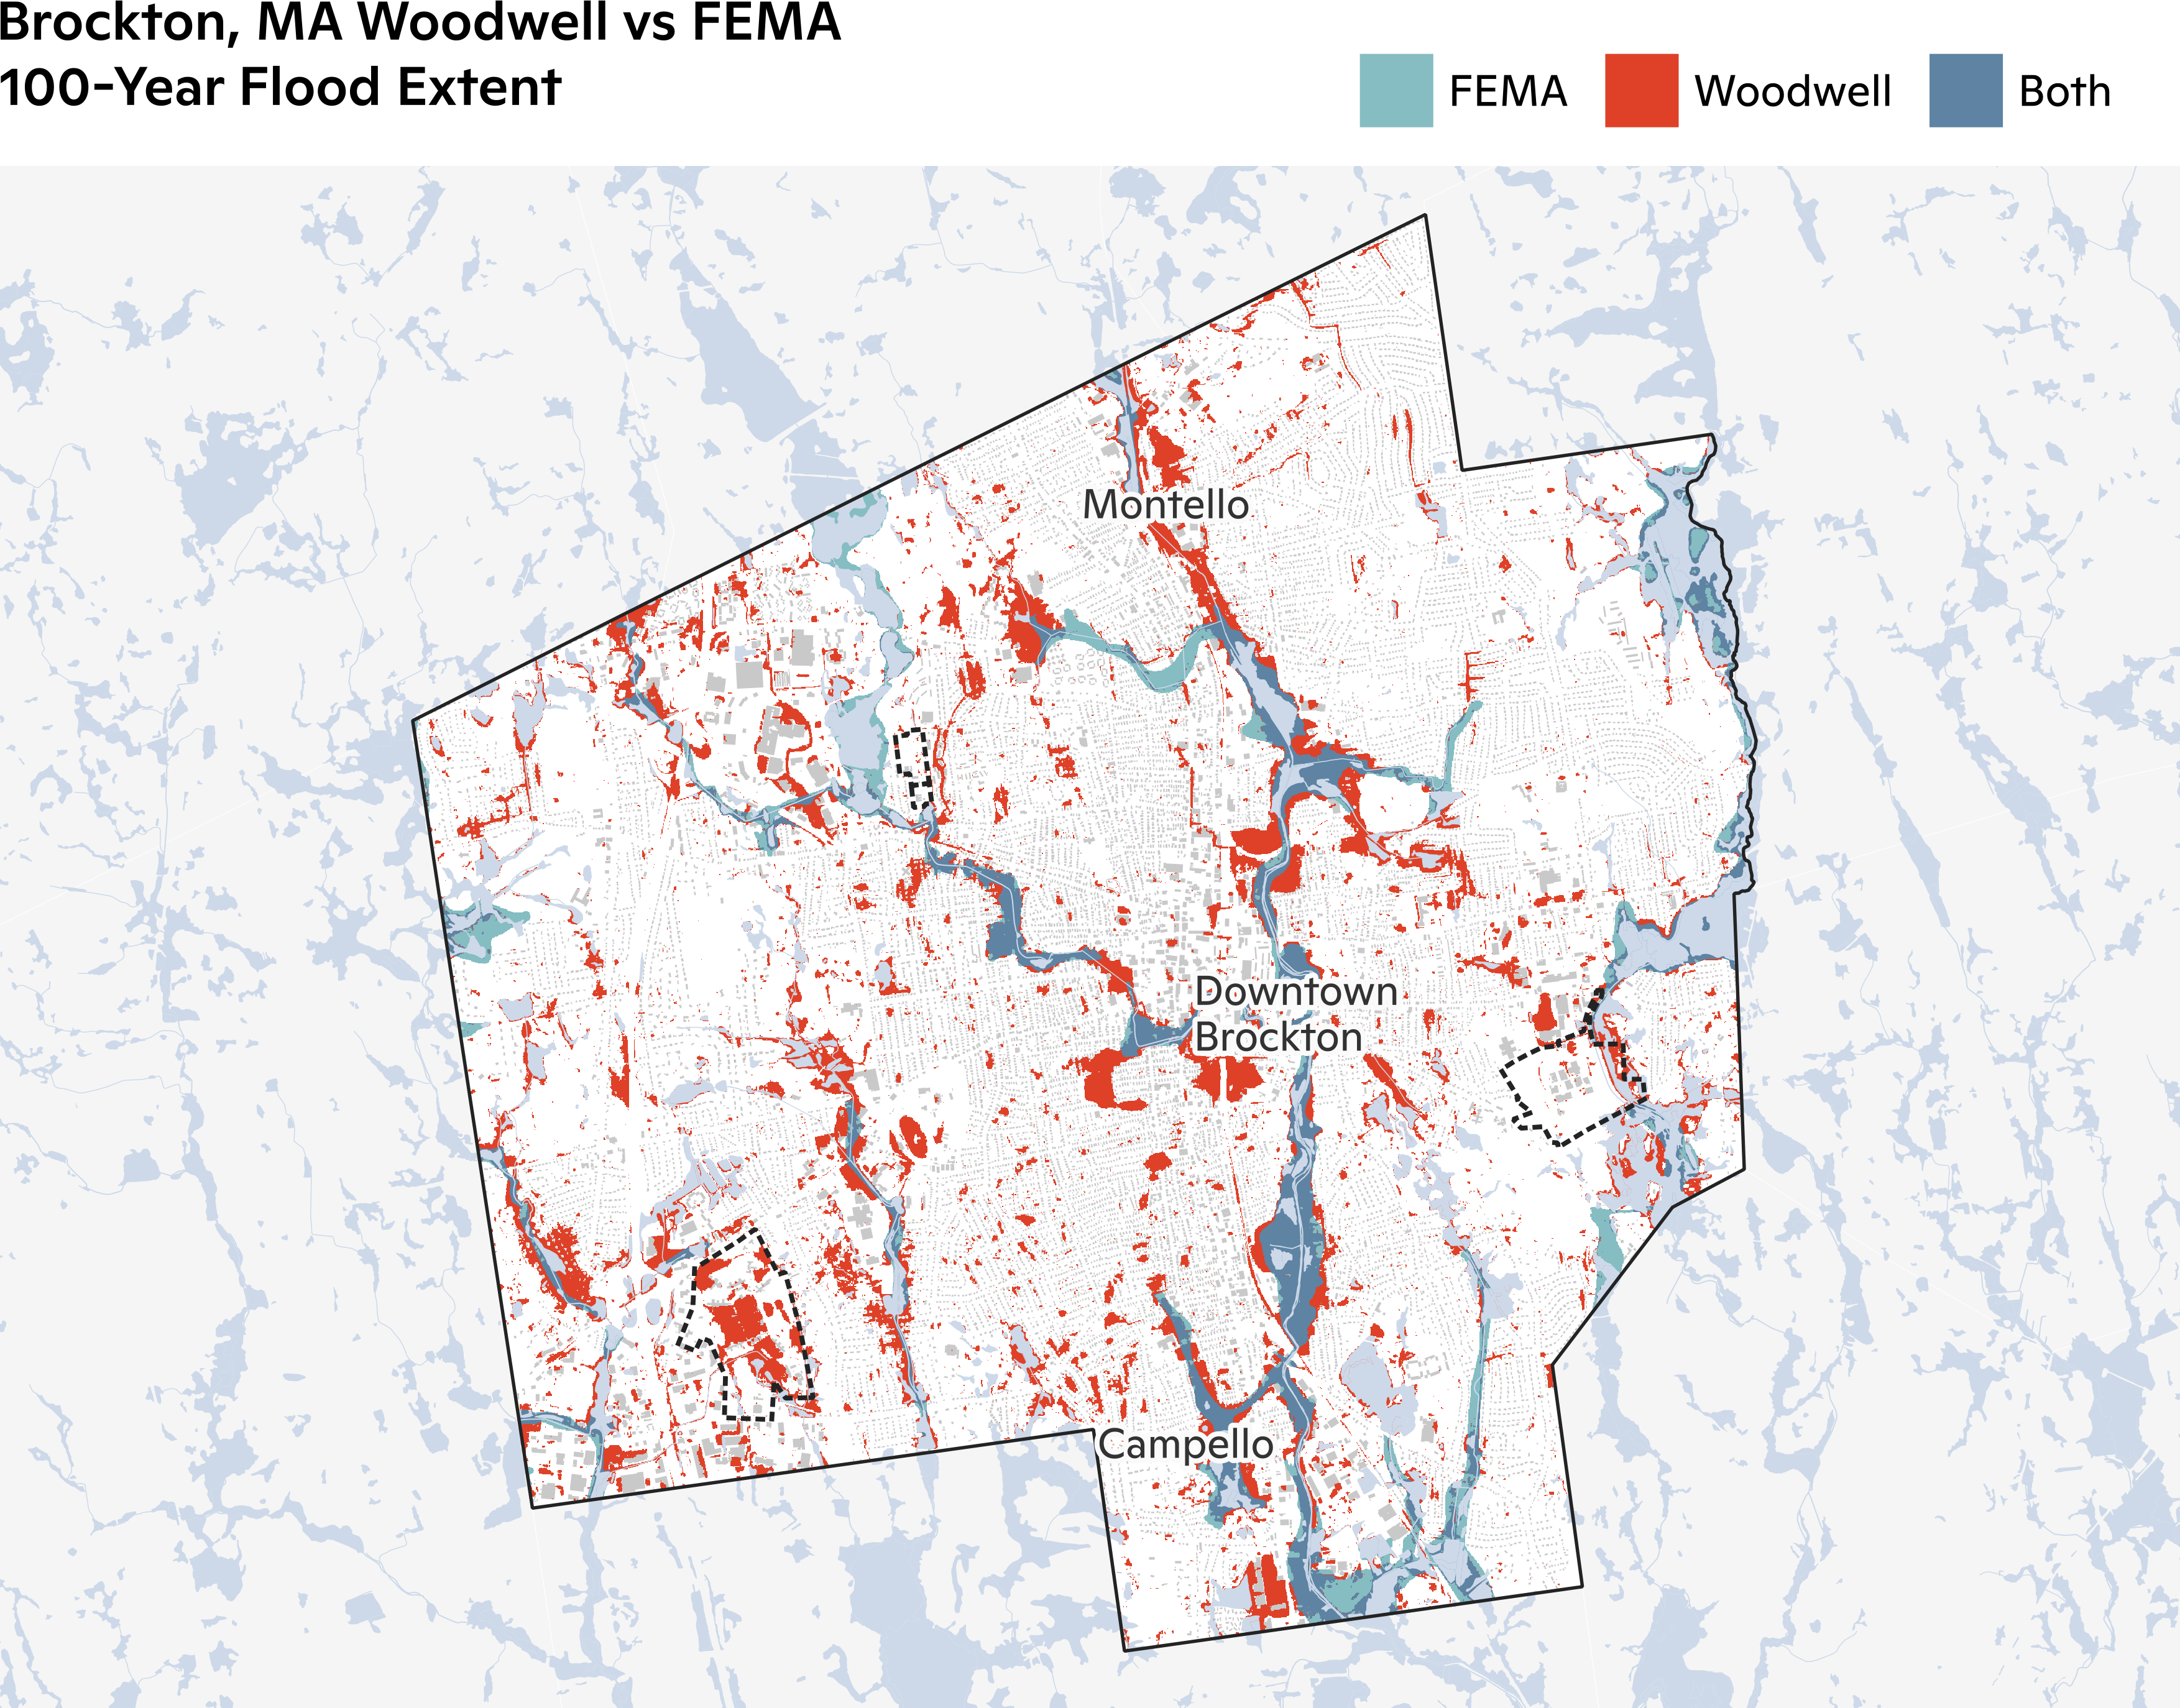
Figure 3: The flood extent comparison between Woodwell’s flood model results and the current FEMA flood maps for Brockton, MA. Areas where only FEMA predicts flood risk are shown in turquoise, areas where only Woodwell predicts flood risk are shown in red, and areas where both predict flood risk are shown in blue. The Woodwell data shows the maximum extent based on both the 100-year pluvial/riverine floods. Gray polygons are buildings.
Present and Future Flood Risk
The primary flood risk in Brockton, MA is riverine flooding. Major riverine flooding is associated with Trout Brook, Salisbury Brook, Dorchester Brook and the Salisbury Plain River. In Figure 4, we show the depth of the 100-year flood for Brockton. The highest depth values of around 8 ft (2.4 m) occur in the floodplain of the Salisbury Plain River south of Pine Street near Walkover Park. Surrounding areas of Buckley Playground and Gilmore Elementary School also are inundated with 4.5 ft (1.4 m) and 1 ft (0.3 m), respectively. We mask wetland areas to focus the analysis on locations where human life and property are at risk. We also show previous flood events identified through X (previously known as Twitter) posts that are shown in blue rings.4 These include Westgate Drive in front of Westgate Lanes, Centre Street under the railway overpass, and the intersection of Sycamore and Belmont Avenues. The simulated 100-year flood shown here compares well with the locations of previous flood events.
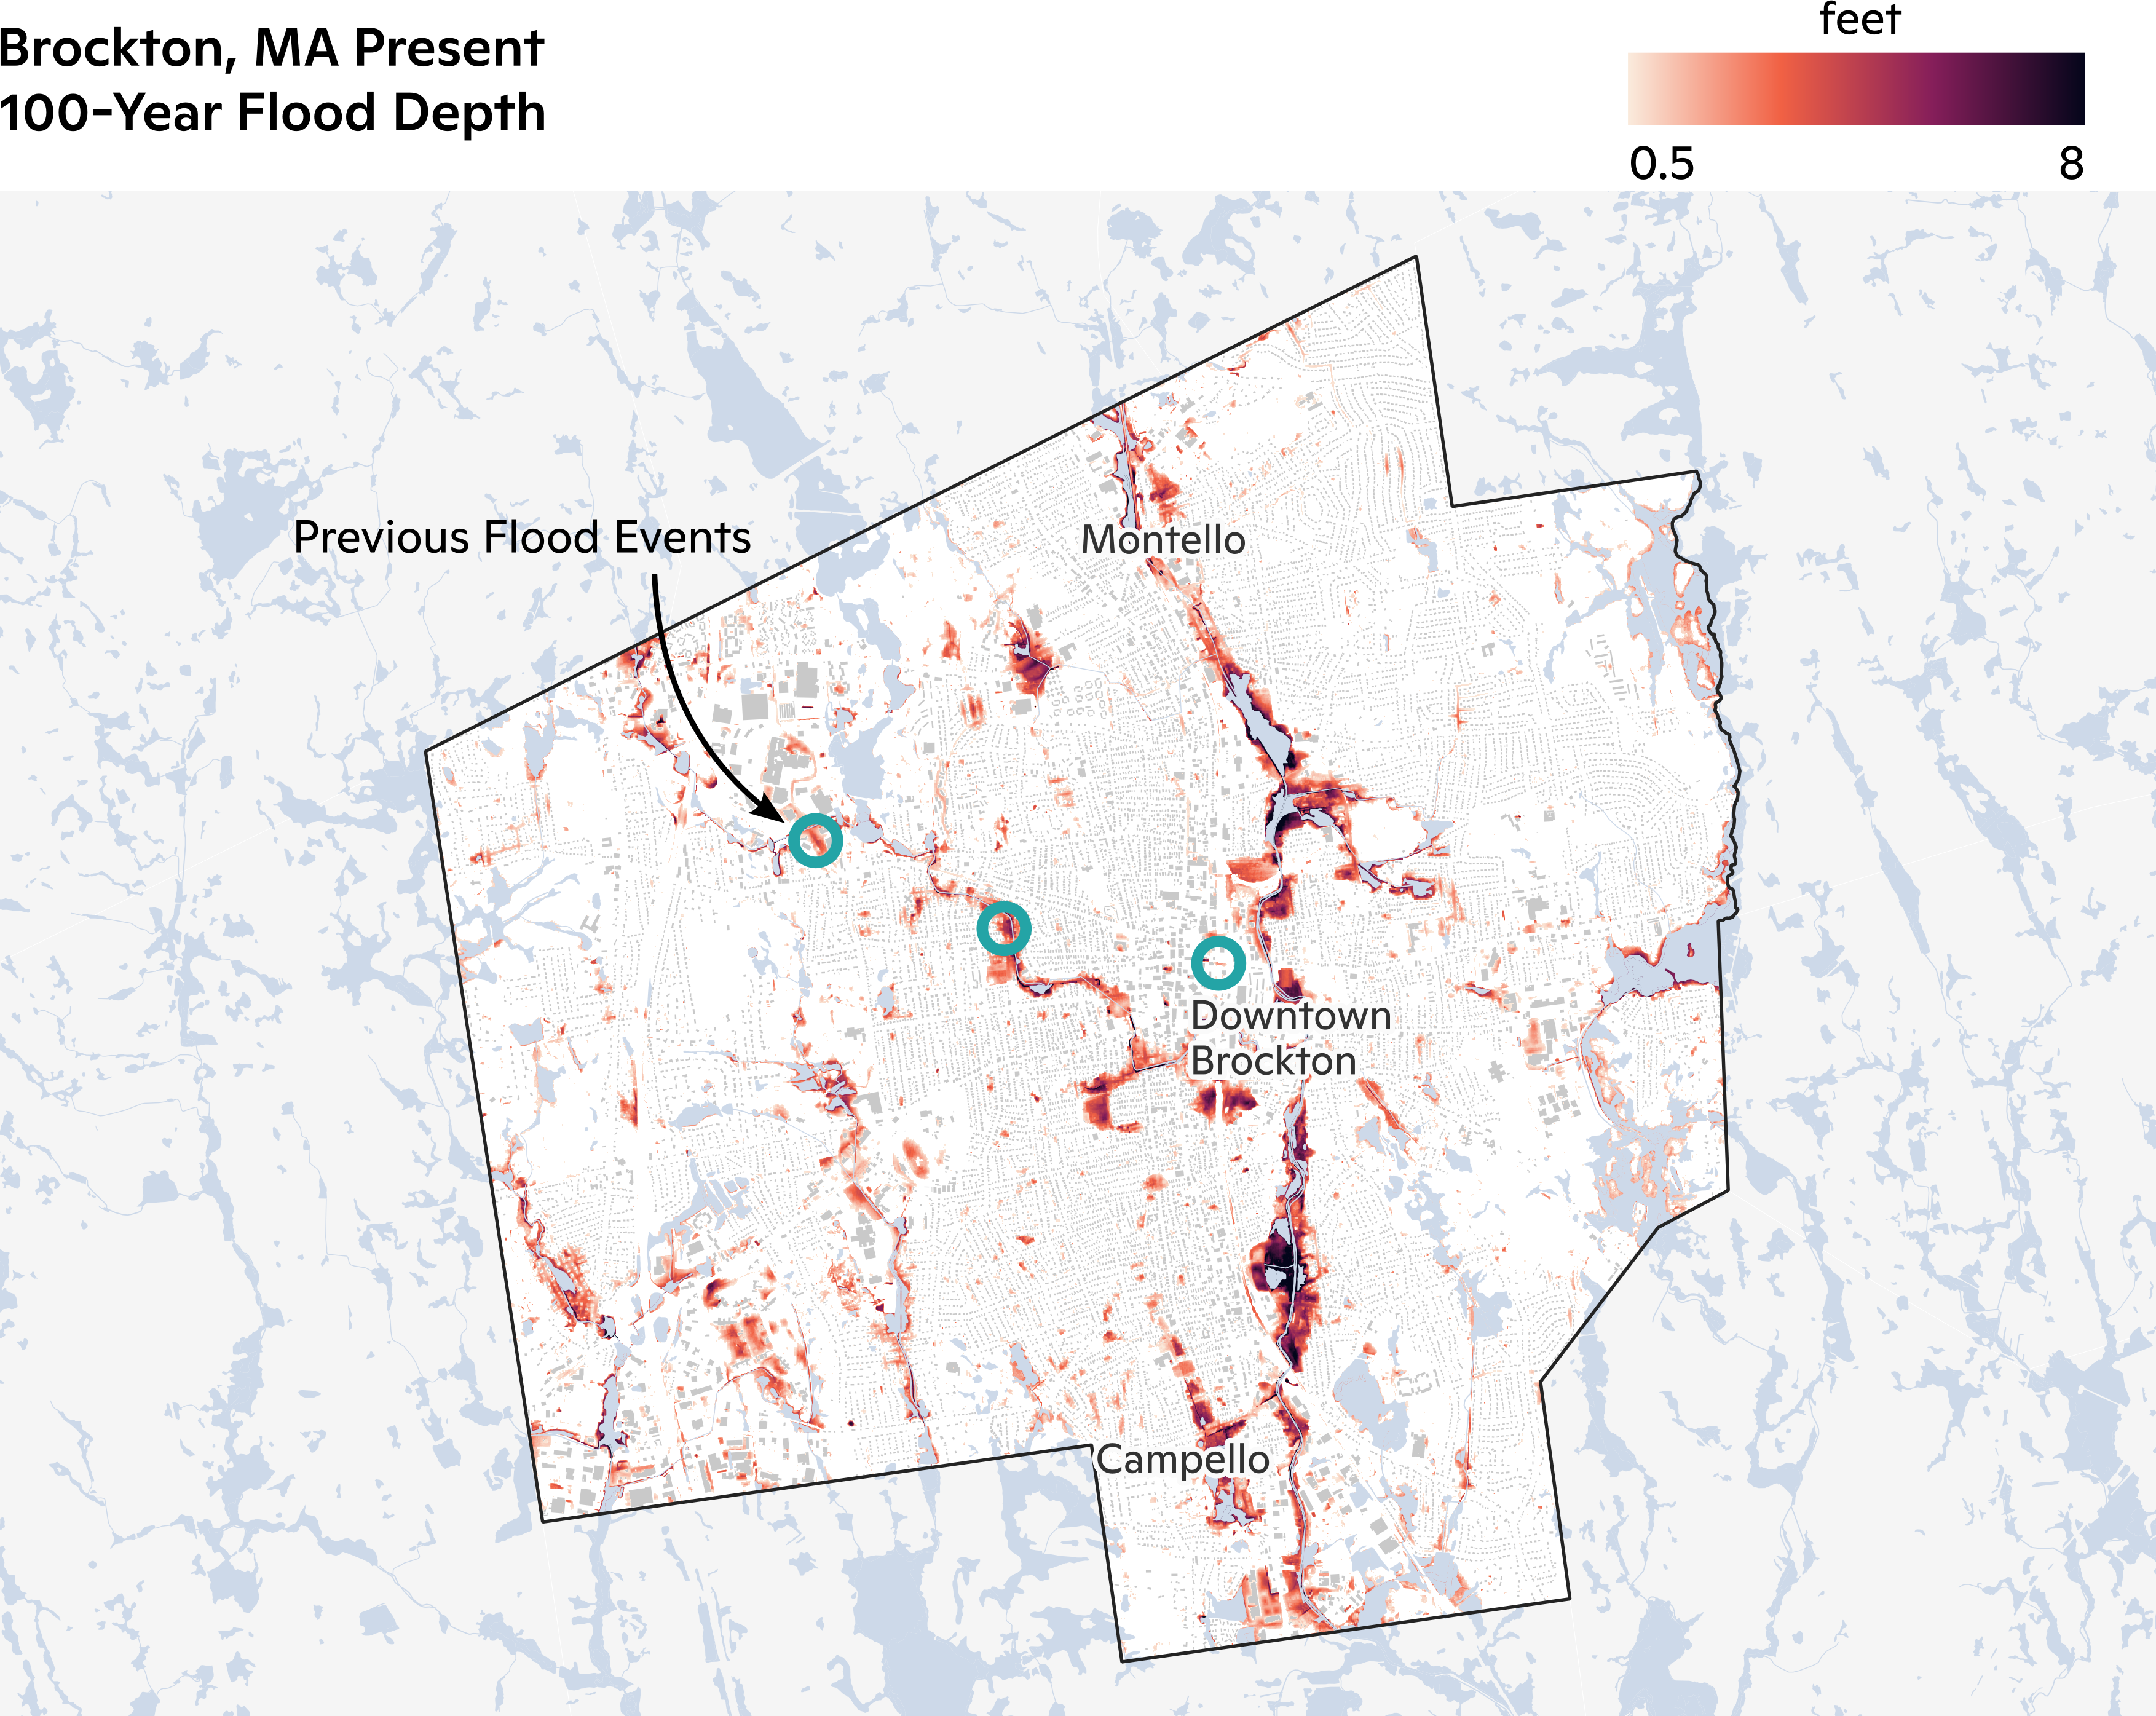
Figure 4: Present-Day 100-Year Flood. The flood depth for Brockton, MA. The maximum depth from the 100-year pluvial/riverine flood is shown. Darker hues indicate deeper flood waters. Gray polygons are buildings. Previous flood events identified through X (previously known as Twitter) posts are shown in blue rings.
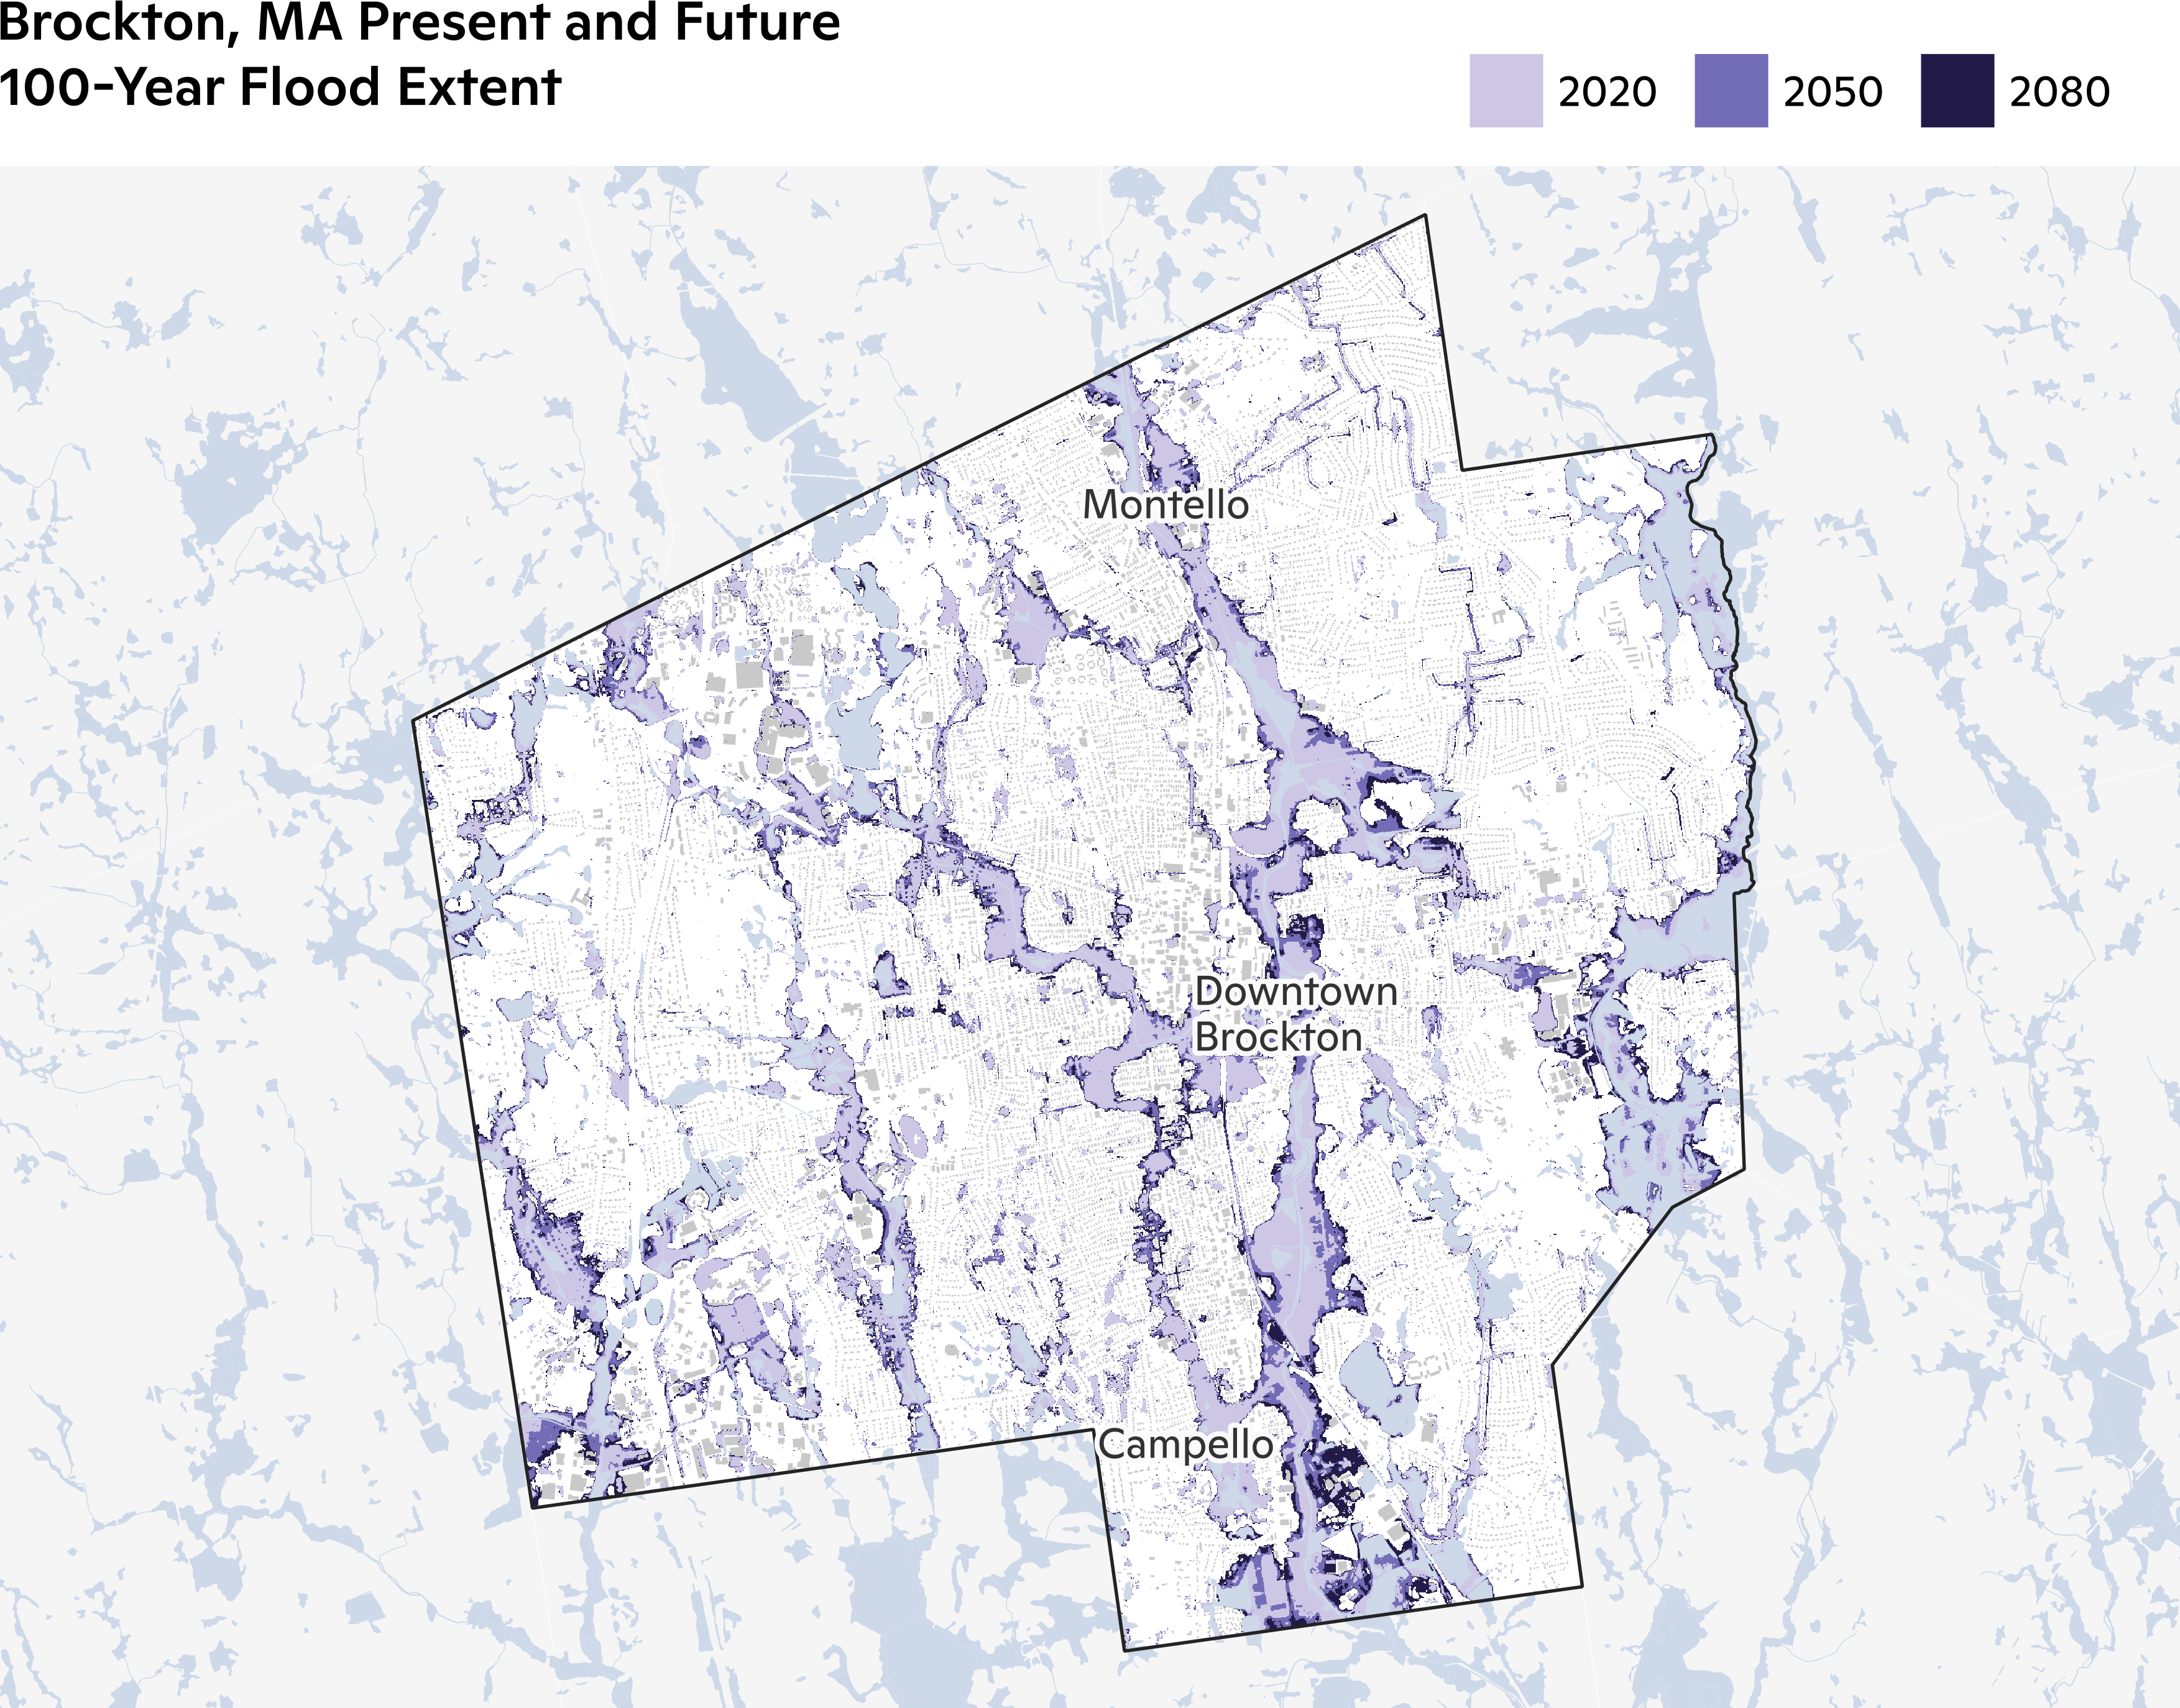
Figure 5: Present Day and Future 100-Year Flood Brockton, MA. The flood extent, quantified as having a depth of at least 0.5 ft (0.15 m), for Brockton, MA. The maximum extent for the 100-year pluvial/riverine flood is shown. Gray polygons are buildings.
Future flood risk is most notably seen along Trout Brook, Salisbury Brook, Salisbury Plain River, the villages of Montello and Campello, as well as Dorchester Brook in southwestern Brockton as shown in Figure 5. This change in riverine and pluvial flood risk is due to projected increases in rainfall between 3.7 and 7.7 inches (94 to 196 mm), as shown in Table 1. We also present several flood risk metrics in Table 2. Presently, just under 10% of the structures in Brockton are vulnerable to the 100-year flood. That number increases to about 13% by mid-century and then 17% by late-century. The average flood depth in Brockton increases by 0.69 ft (0.21 meters) through the 21st century while the area flooded increases from 9% in the present day to 15% by late-century.
| Present | 2040–2060 | 2070–2090 | |
| Area Flooded (%) | 9% | 12.6% | 15.6% |
| Average Depth (m) | 1.64 ft (0.5 m) | 2 ft (0.61 m) | 2.33 ft (0.71 m) |
| Structures Flooded | 2,430 (9.9%) | 3,350 (13.7%) | 4,204 (17.2%) |
Table 2: Flood Risk Metrics for Mid and Late-21st Century in Brockton. The percent of land area (excluding wetlands) flooded and the number of buildings (and percent of total structures) flooded for Brockton of the present day, 2040–2060, and 2070–2090 100-year rainfall events.
Stormwater System Vulnerability
In addition to flood extents, an analysis of the flood model results for the Brockton stormwater system was conducted to identify bottlenecks in the system. Any manholes or catch basins (sometimes referred to as drainage basins) that overflowed during the simulation were considered flooded. Conduits (pipes) that are capacity limited (also referred to as at capacity) were also identified. Capacity limited is defined as when flow entering the pipe is greater than what the conduit can convey. We show capacity limited pipes to identify any pipes that may be undersized or undersloped. These pipes may be responsible for causing flooding or upstream backwater conditions to occur at manholes or catch basins. Such pipes would be good starting points when investigating where to perform stormwater system upgrades.
Brockton’s stormwater system shows high spatial distribution in the hot spots of vulnerability to the 100-year rainfall event. In Table 3, we show the number and percentage of manholes and catch basins flooded and capacity limited conduits for the present day, 2040–2060, and 2070–2090 100-year events. In Figure 6, we show the locations of concentrations of manholes and catch basins flooded as a heat map as well as which conduits are capacity limited. During the present day 100-year rainfall event, almost two-thirds of all conduits in Brockton’s stormwater system are capacity limited. By the mid-21st century, that proportion increases to almost 75% and then almost 80% by the late-21st century. The percentage of manholes and catch basins flooded is significantly smaller compared to the conduits but a similar upward trend is expected with 47% of the catch basins and 45% of the manholes flooded by the late-21st century. The difference in proportion of manholes/catch basins flooded and conduits at capacity indicates that the stormwater system is able to reduce street flooding even when the stormwater pipes are filled. We identified several hot spots of stormwater flooding throughout Brockton. These include the neighborhood between Dorchester Brook and Route 24 in western Brockton, downtown Brockton, especially the area surrounding Salisbury Brook and the box culvert running parallel to Warren Ave, and the community of Montello that surrounds Trout Brook.
It is important to note that we show all conduits that are capacity limited regardless of the duration they were capacity limited during the simulation. The vast majority of conduits in the present time period that were at capacity (78%) spent only 36 seconds in a limited flow state. We include these conduits in the flooding metrics to give a system wide perspective on the capacity of the stormwater system.
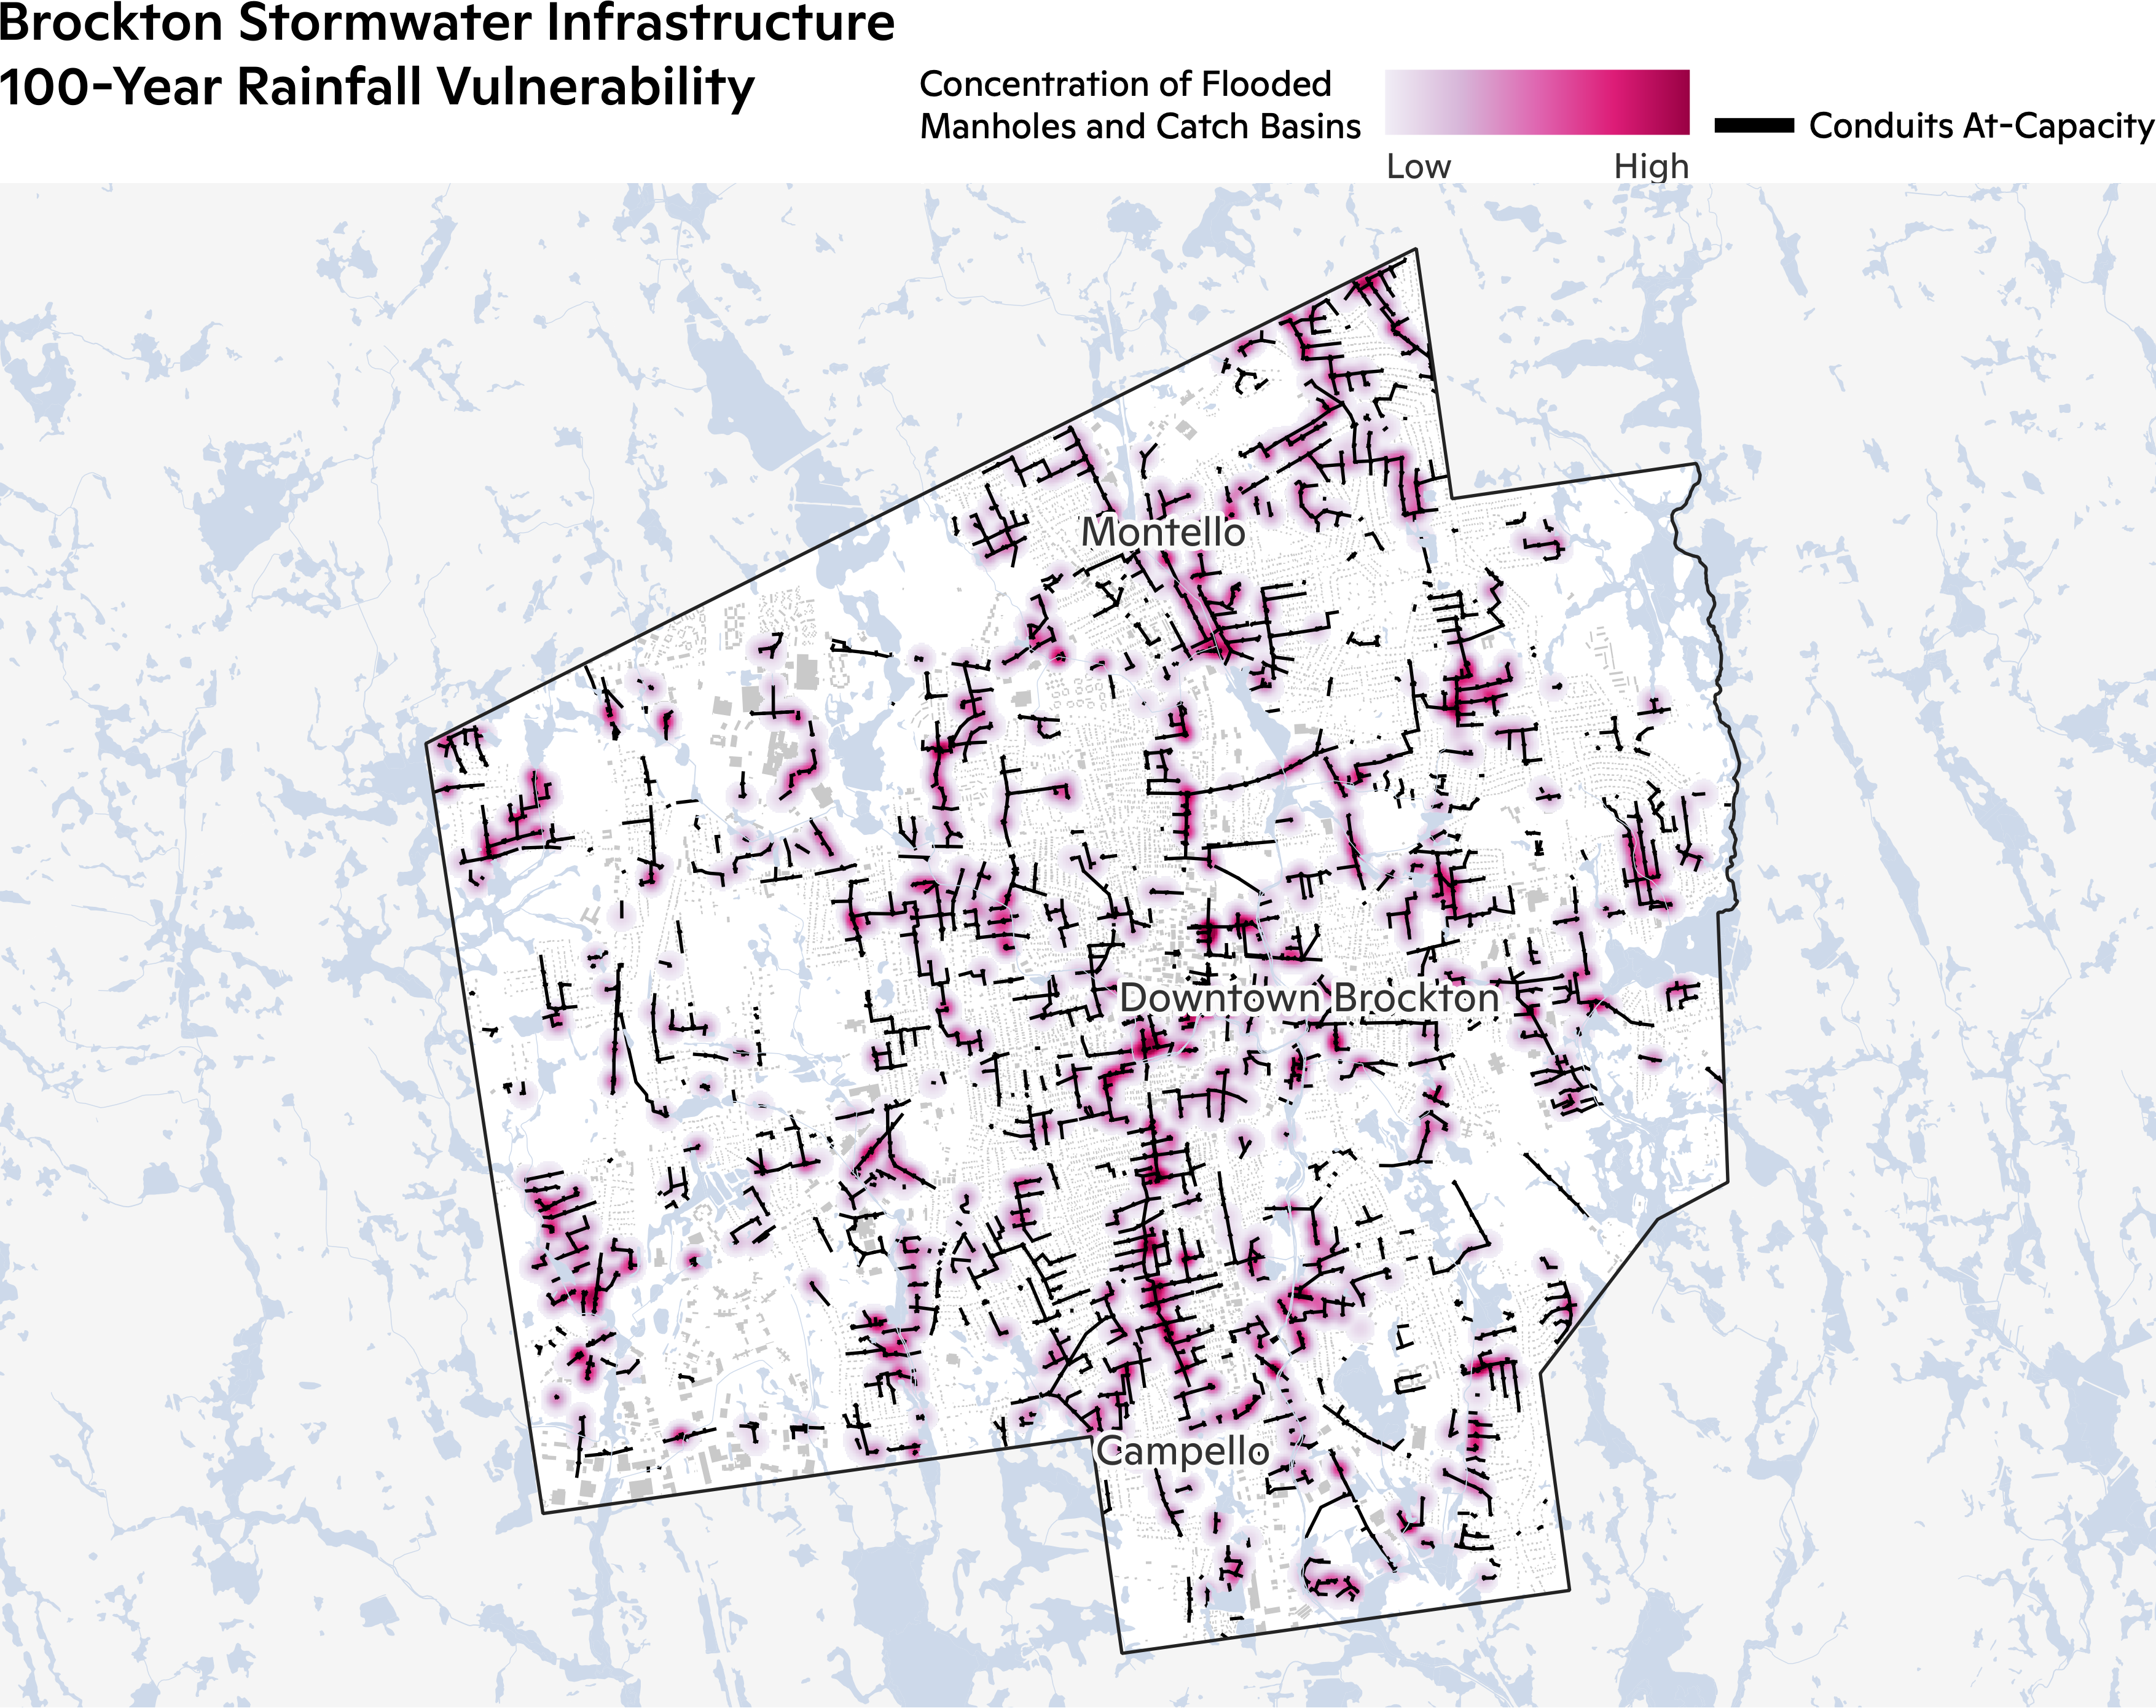
Figure 6: Brockton Stormwater System Flooding Heat Map. The concentration of flooded manholes and catch basins shown as a heat map for the present day 100-year rainfall event. Areas with no flooded manholes or catch basins are shown in white. Capacity limited conduits are shown in black.
| Present | 2040–2060 | 2070–2090 | |
| Manholes | 911 (26%) | 1,270 (36%) | 1,568 (45%) |
| Catch Basins | 1,897 (28%) | 2,679 (39%) | 3,227 (47%) |
| Conduits | 7,142 (64%) | 8,177 (73%) | 8,883 (79%) |
Table 3: Stormwater System Flooding. The number, and percentage of total, flooded manholes and catch basins and capacity limited conduits for the present day, 2040–2060, and 2070–2090 100-year rainfall event.
Conclusion
Brockton is currently at high risk from flooding, and this exposure will only increase under climate change. The results presented in this study were compared to FEMA’s flood maps, revealing significant discrepancies primarily due to the exclusion of pluvial flooding in FEMA’s analysis. The results of this research indicate an expected increase in the frequency and intensity of heavy rainfall with the probability of the present day 100-year rainfall event to be five times higher by the mid 21st century and ten times higher by the end of the century. Brockton’s stormwater system will also face greater stress as rainfall intensifies with almost 50% of catch basins flooding by the late 21st century. This report provides insight into the vulnerability of the city of Brockton, where an increasing number of buildings and areas will be exposed to flood waters by the end of the century.
Methodology
To simulate flood risk we use a coupled version of the LISFLOOD-FP v8.1 flood model (LISFLOOD-FP developers, 2022; Shaw et al., 2021) and the Environmental Protection Agency’s (EPA) Stormwater Management Model (SWMM). LISFLOOD-FP is a two-dimensional raster hydrodynamic model that solves an approximation of the shallow water equations. LISFLOOD-FP has been extensively used from the river reach scale to continental simulations and we refer the reader to Shaw et al. (2021) for a detailed explanation of LISFLOOD-FP. SWMM is a one-dimensional stormwater system model solving the one-dimensional Saint-Venant equations. SWMM was introduced in 1971 by the EPA and has been continuously revised and upgraded since its initial release. For this work we use SWMM version 5.2.2, which was released in December 2022.
LISFLOOD-FP and SWMM are coupled using SWMM’s dynamic link library (DLL) following the methodology presented in Leandro and Martins (2016). LISFLOOD-FP’s source code was modified to allow for bidirectional interaction between the two models at outfalls, catch basins, and manholes by calling SWMM functions during each LISFLOOD-FP time step. Time step synchronization between LISFLOOD-FP and SWMM is controlled by LISFLOOD-FP. The time step of LISFLOOD-FP is set as SWMM’s time step to keep both models aligned during the simulation. Flow from LISFLOOD-FP to SWMM through manholes and catch basins are governed by the orifice and weir equations. Flood volumes that occur at manholes and catch basins are transferred to LISFLOOD-FP. Further detail on flow interactions can be found in Chen et al. (2016).
All flood model results show flooding above ~0.5 ft (15 cm) as this is an average curb height and any flooding above this threshold would likely result in flood damages. All areas that are wetland and permanent water cover as determined by National Wetland Inventory (https://fwsprimary.wim.usgs.gov/wetlands/apps/wetlands-mapper/).
Three time periods were used for this study: 2000–2020 (also referred to as present day), 2040–2060, and 2070–2090. These time periods can also be interpreted as warming levels in the context of climate policy. The 2000–2020, 2040–2060, and 2070–2090 periods correspond to 1, 2 and 3 degrees Celsius of warming respectively. For each time period, a pluvial/riverine flooding run was performed.
Any analysis involving structures used the USA Structures dataset (https://gis-fema.hub.arcgis.com/pages/usa-structures). This dataset was created through a collaboration between DHS, FIMA, FEMA’s Response Geospatial Office, Oak Ridge National Laboratory, and the U.S. Geological Survey.
- Rainfall
- Historical Rainfall
The 24-hour 1-in-100 year rainfall event was used from NOAA Atlas 14 point precipitation frequency estimates for Brockton, MA (Perica et al., 2015). The temporal distribution, also from NOAA Atlas 14, of the 24 hour rainfall is taken from the combined cases of the four quartiles and uses the 90% cumulative probability. - Future Rainfall
CMIP6 climate model data were bilinearly interpolated to a 1-km grid and then bias-adjusted using phase 3 of the Inter-Sectoral Impact Model Intercomparison Project (ISIMIP) version 2.5 methodology (ISIMIP3BASD v2.5) (Lange, 2019; Lange, 2021). High-resolution, 1-km Daymet reanalysis data (Thornton et al., 2022) were selected as the observation dataset for bias adjustment. Precipitation annual maxima were then extracted for three time periods, 2000–2020, 2040–2060, and 2070–2090 using the SSP5-8.5 scenario from the downscaled data. The Akaike Information Criteria (AIC) was used to determine the best Generalized Extreme Value (GEV) distribution between the L-moments method (Hosking, 1990) and the Maximum Likelihood Estimation (MLE) (Prescott and Walden, 1980). The annual maxima data for each pixel across all models were fitted to a GEV distribution using the MLE method as it was the best fit for Brockton. The future return period of the historical (2000–2020) 1-in-100 year event is determined by finding the percentile in the future GEV distribution that corresponds with the historical rainfall amount. Rainfall amounts for the future 1-in-100 year events were estimated by determining what percentile in the historical period corresponds to the future 100-year amount, according to the future GEV. The percentile (analogous to a return period) was then converted to a rainfall amount using the rainfall distributions from the NOAA NA14 dataset.
- Historical Rainfall
- Digital Elevation Model
The USGS CoNED Topobathy DEM (Compiled 2016): New England was used to create the Brockton, MA elevation domain. The resolution of the raw data was 1 meter. The final DEM resolution was set to 5 meters to allow for better modeling of the stormwater system. - Friction Coefficients
Friction coefficients, or Manning N values, were determined based on the land cover type of the area. The 2019 land cover was used for this from the National Land Cover Database (NLCD). Based on each classification of land cover, an associated friction coefficient is provided. See table here: https://rashms.com/wp-content/uploads/2021/01/Mannings-n-values-NLCD-NRCS.pdf - Infiltration
To calculate soil infiltration rates, the USDA Soil Survey Geographic Database (SSURGO) for Massachuettes was used to obtain the soil hydrologic groups. These hydrologic groups have defined infiltration rates depending on the type of soil. Infiltration values per hydrologic group were used from Musgrave (1955). These rates in combination with the NLCD impervious surface percentages were used to compute more accurate infiltration rates. The impervious surfaces take into account built-up areas where rainfall will not be able to infiltrate.
1 USGCRP, 2018: Impacts, Risks, and Adaptation in the United States: Fourth National Climate Assessment, Volume II [Reidmiller, D.R., C.W. Avery, D.R. Easterling, K.E. Kunkel, K.L.M. Lewis, T.K. Maycock, and B.C. Stewart (eds.)]. U.S. Global Change Research Program, Washington, DC, USA, 1515 pp.
2 NOAA calculates extreme rainfall frequencies with all available station data. In Brockton, daily rainfall records go back to 1894.
3 Flood Insurance Study Plymouth County, Massachusetts Volume 1. Federal Emergency Management Agency. July 6, 2021.
4 Photos from the posts were geolocated based on evidence from the photos or descriptions such as street signs and business names.