Arctic sea ice loss to increase strong El Niño events linked to extreme weather: Study

The 2015-16 El Niño fueled deadly record cyclones in the South Pacific and Mexico, as well as severe droughts that resulted in thousands of early deaths from fires and haze in southeast Asia and tens of millions going hungry amid crop failures in southern Africa.
Strong El Niños like that one could happen more frequently in the future as Arctic sea ice starts to disappear in the summer, according to a recent study published in Nature Communications. The research is the first to find a direct link between sea ice loss and the occurrence of El Niño, a warming of surface water in the eastern Pacific off of Peru that encourages higher global temperatures and extreme weather around the planet.
Continue reading on Mongabay.
Why burning biomass is not zero-carbon
Short animation explaining why burning biomass produces more carbon dioxide per unit of energy generated than almost all fossil fuels.
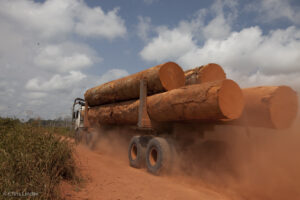
The climate emergency requires countries to transition away from fossil fuels, but it is important to be careful about the alternative energy sources chosen.
In particular, concern is growing over the use of biomass for energy, which is generated when wood or other plant material is burnt to generate heat and electricity. Many governments treat biomass energy as zero-carbon at the point of combustion, and subsidize it in the same way as renewables such as solar or wind, resulting in a large increase in the use of biomass for energy in the UK and the European Union (EU) over the past 15 years.
Read more on Chatham House.
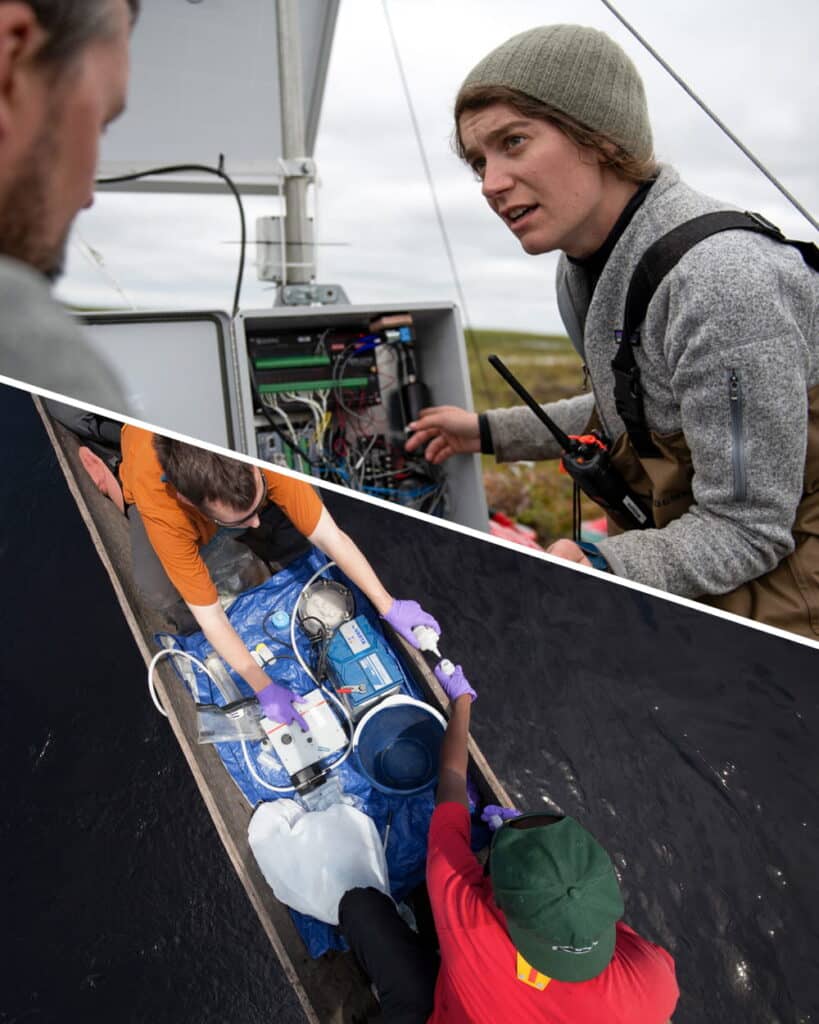
Permafrost slumps spew carbon into streams, study shows
Streams affected by permafrost slumps carry substantially more carbon than typically found in other streams flowing through permafrost landscapes, according to a new study.
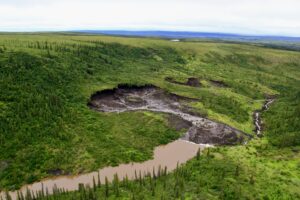
The research highlights freshwater’s growing role in the carbon balance of permafrost landscapes, like much of the Northwest Territories, as the world warms.
The work may help researchers refine their estimates of how much carbon is absorbed versus released in northern regions.
Read more on Cabin Radio.
New study identifies mature forests on U.S. federal lands ripe for protection
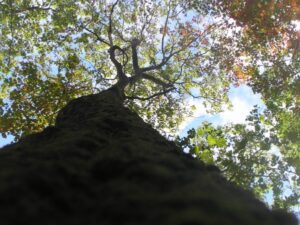
In a major new study, a team of scientists has published what it calls the first-ever, map-based assessment of existing mature and old-growth forests in the continental United States. Such forests are critical to fighting climate change and data like this is deemed vital to President Biden’s climate action agenda.
But the new research also shows how much mature forests on both federal and private lands in the U.S. are seriously at risk — offering a conservation opportunity to the Biden administration.
Continue reading on Mongabay.
How stopping Alaskan wildfires can slow climate change
Climate change is worsening Alaskan wildfires, which, in turn, are worsening climate change. Here’s how to break this vicious cycle
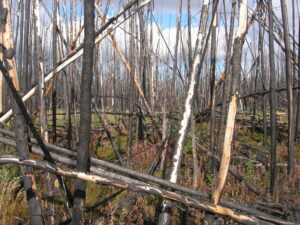
In the carbon-rich boreal forests that extend across the globe just below the Arctic Circle, a vicious climate-wildfire cycle is playing out, one that poses both an accelerating climate threat and an unrealized opportunity to stanch a large and growing source of greenhouse gas emissions.
Consider Alaska. This summer, wildfires spread across the state’s forests at a historic—and terrible—pace. From June through August, wildfires scorched more than 3.1 million acres across the state, an area larger than Yellowstone and Yosemite National Parks combined. That’s nearly half of the nearly 5.7 million acres burned across the U.S. this year to date, according to the National Interagency Fire Center. As they burned, Alaskan wildfires sent more than 150 million metric tons of carbon dioxide into the atmosphere, the carbon pollution equivalent of driving 32 million gas-powered cars for a year.
Boreal forests are massive carbon stores. They hold, mainly in their soils, about two thirds of all the carbon stored by the world’s forests. While wildfires occur naturally in these forests, we and other climate researchers have been observing how climate change is driving dramatic increases in fire frequency and severity.
Read more on Scientific American.
Climate change for preschoolers: A TV show explores unmapped ground
There are almost no books, TV shows or other tools to help parents and teachers talk to preschoolers about climate change. “Octonauts: Above and Beyond” is one of the first to try.

Four-year-old Francis Gaskin, who lives with his family in Houston, has a favorite episode of his favorite new Netflix cartoon: When the Amazon rainforest canopy dries up from too much heat, the manic howler monkeys must move into the lower realms of the forest, creating havoc among the other rainforest residents. “They had to find a new home,” Francis explained during a video interview.
“I noticed something else,” the preschooler added. “The frogs were going to lay their eggs in the water, but there was no water in the stream because there was zero rain.”
“Sometimes the Earth warms up,” he said.
Francis’ favorite show is “Octonauts: Above and Beyond,” the recent spinoff of a long-running BBC program, and one of the first television shows directed at very young children to explicitly address climate change. The program attempts to strike a delicate balance: gently showing three- and four-year-olds that their world is already changing, without frightening them with the consequences.
Continue reading on The New York Times.
The climate future is now. Humans navigate a ‘Perilous Course’ on the East Coast.
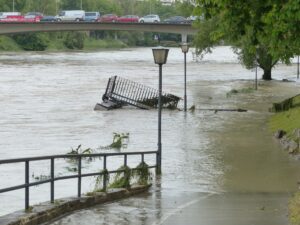
After murky water from the Mamaroneck River gutted the sanctuary, the rotting pews in First Baptist Church sat empty for months.
When the faithful returned, they wore whatever remained of their Sunday best. A blush pink blazer. A dress shirt buttoned tight around an Adam’s apple. Ladies white gloves.
Some parishioners were still displaced from their apartments and houses, lives scattered across hotel rooms, shelters, friends’ couches.
Continue reading on MSN.