Cape Cod Rivers Observatory provides vital river health data
Combining years of water quality measurements with new information on river flow leads to important insights

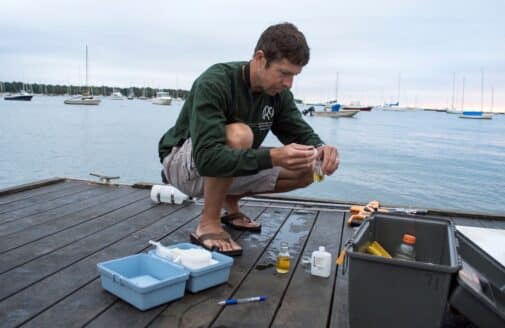
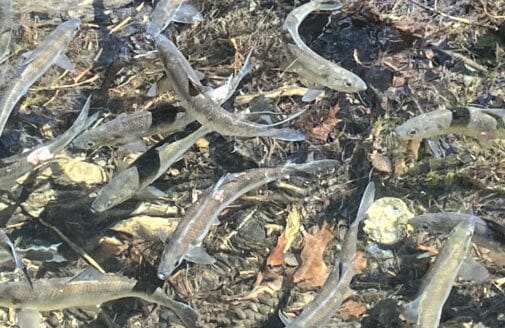
Rob Stenson and Anya Suslova sampling the Santuit River in Mashpee, MA in June 2018. / photo by Alexander Nassikas
After decades of sampling and studying rivers across the globe, Woodwell Climate Research Center Deputy Director and Senior Scientist Dr. Robert Max Holmes turned his attention closer to home in 2016. Using methodology developed through his work with the Arctic Great Rivers Observatory and Global Rivers Observatory, Dr. Holmes established the Cape Cod Rivers Observatory (CCRO), an initiative that focuses world-class science on the hidden operations of local rivers. The project marks its fifth anniversary this year, and is continuing to expand.
Since the program’s founding, citizen-scientist Rob Stenson has collected weekly or biweekly water samples from several Cape Cod rivers, which Woodwell researchers analyze to provide important data about the health and vitality of key local watersheds. “The frequent and ongoing river water sampling being done by the Cape Cod Rivers Observatory allows us to track the health of our local rivers,” Dr. Holmes says, which is critically important given a host of environmental issues on the Cape including coastal degradation due to excess nitrogen inputs.
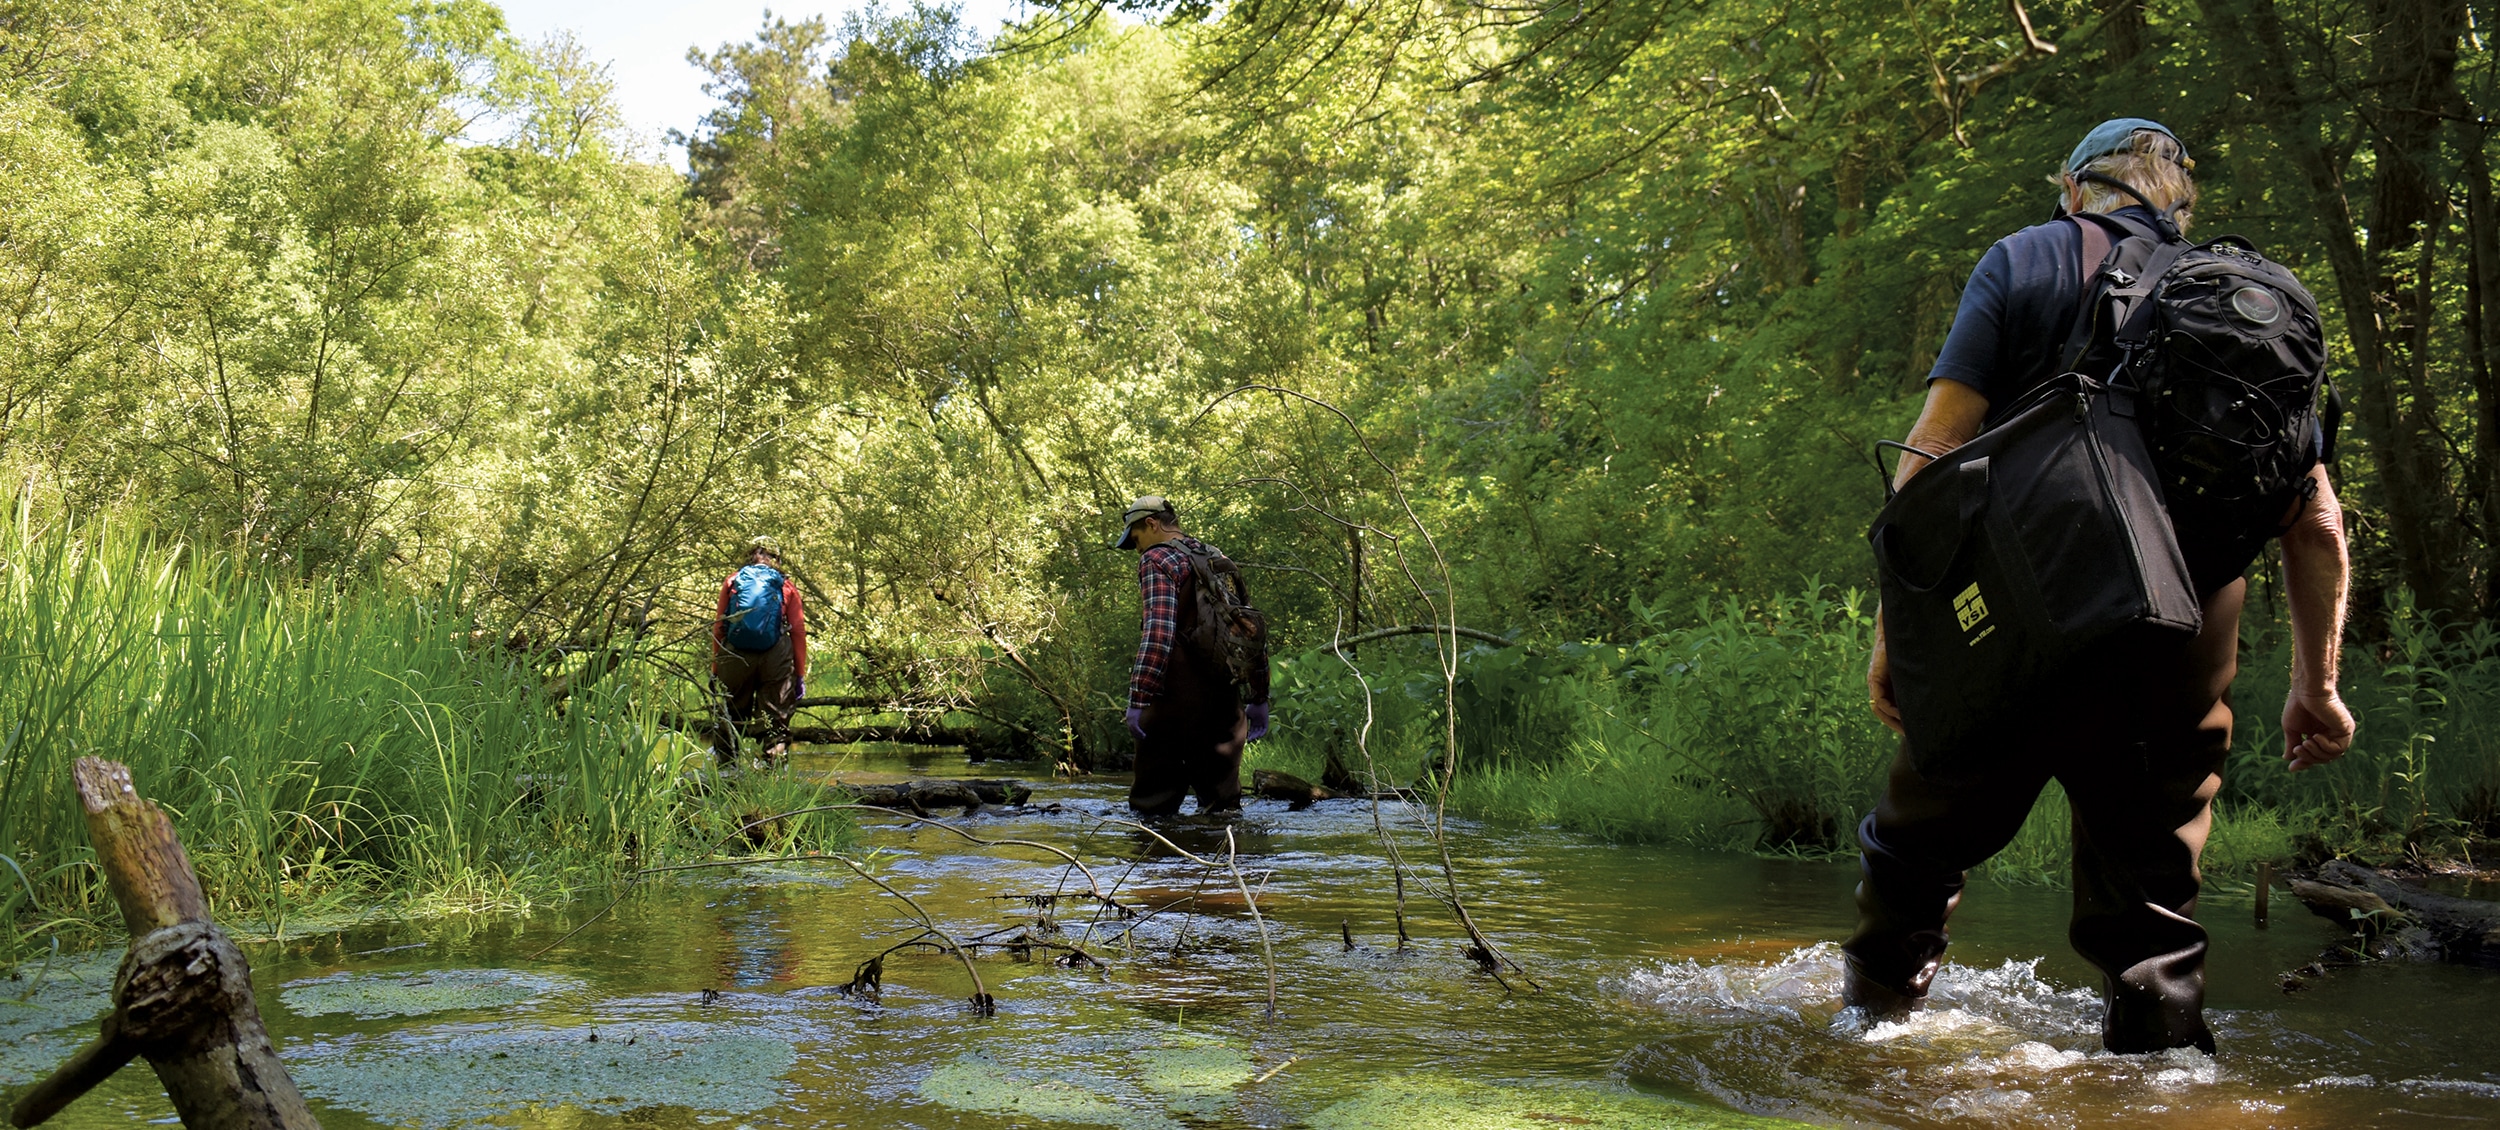
Sampling the Santuit River in Mashpee, MA. / photo by Alexander Nassikas
Recently, Woodwell Climate scientist and CCRO team member Anya Suslova began combining Quashnet River discharge data, courtesy of the US Geological Survey, with long-standing analyses of nitrogen and carbon levels. By combining concentration and discharge measurements, Suslova calculates the total mass of chemicals deposited in the coastal zone. Known as flux, this calculation provides critical information about the role of rivers in larger marine and wetland ecosystems.
“The chemistry alone is incredibly useful, but you can tell a fuller story when you also have discharge data,” Dr. Holmes says. “You can take water from the Mississippi River and the Quashnet River and directly compare the concentrations of nitrogen or other chemicals, even though they are very different sizes. On its own, this can tell us a lot. But if you want to understand how those rivers impact the coastal waters they feed, you have to take into account the different amounts of water they carry.”
By measuring nitrogen flux from rivers, scientists can develop a more complete picture of the local ecosystem and better inform policy makers how to protect Cape Cod’s biodiversity. The analysis of the Quashnet River shows changes in nitrogen flux over the past few years that were not obvious from the water quality data. Suslova and Dr. Holmes say such changes may be related to changes in rainfall and water levels, but it is unclear how long-lasting or widespread that trend is.
“We know that river flow varies over time and in relation to climate change, so to understand how much nitrogen rivers are putting into Cape Cod’s coastal waters, it helps to have both pieces of the puzzle,” explains Dr. Holmes.
Cape Cod Rivers Observatory aims to provide the public with real-time data about the rivers that sustain the region’s beaches, estuaries, and ocean. In the coming year, CCRO will expand discharge measurement operations to the Childs and Mashpee Rivers. Dr. Holmes and his team hope to install and operate discharge monitoring on additional rivers to create a “river health report card” that summarizes key findings for local decision makers.
From Siberia to the Congo to Cape Cod, just four key nutrients form the basis of our river sampling work
Skyla Tomine
Science on the Fly Volunteer
Nitrate (NO3) is a form of nitrogen, which is essential for all life. Healthy rivers generally have low nitrate concentrations, but fertilizer and wastewater often lead to elevated concentrations. When this happens, rivers can suffer excessive algal growth, which can lead to low oxygen concentrations when the algae decompose. That, in turn, can kill aquatic organisms, including fish. If nitrate concentrations in a river increase over time, that would be a red-flag indicating the likelihood of increased pollution inputs. Conversely, decreasing nitrate concentrations over time generally suggest improving river health.
Ammonium (NH4) is another form of nitrogen that is common in fertilizers but is typically found in low concentrations in rivers because it is rapidly taken up by plants and bacteria, or converted by bacteria to nitrate.
Phosphate (PO4) is a form of phosphorus, which–like nitrogen–is essential for all life. In fact, that is why the two main components of most agricultural fertilizers are nitrogen and phosphorus. As with nitrate, wastewater and fertilizer often add excessive amounts of phosphate to rivers, so tracking phosphate concentrations over time provides clues about a river’s health. Phosphate concentrations are generally even lower than nitrate concentrations.
Dissolved organic carbon (DOC) occurs naturally in all rivers, where it absorbs ultraviolet light and provides energy to the ecosystem. The main source of DOC is decomposing plant and animal material. Wastewater can also contribute DOC to rivers. Climate change can also impact DOC concentrations in rivers. For example, climate driven permafrost thaw in the Arctic can add DOC to rivers. DOC concentrations can also be impacted by forest fire or other changes to a watershed’s vegetation.
Latest in Water
- In The News
From High-Desert Trout to Large-Scale Science: Welcome Dr. Zhongqi Chen to Science on the Fly
- In The News
South Coast scientists: To improve bay health, start at the source
- In The News