Lawrence Livermore grabs two spots in DOE’s Energy Earthshot program
Lawrence Livermore National Laboratory (LLNL) scientists will lead and co-lead projects in support of the Department of Energy’s (DOE) new Energy Earthshot program.
The Energy Earthshots Initiative calls for innovation and collaboration to tackle the toughest topics in energy-related research. In January, DOE announced Office of Science funding for the Energy Earthshot Research Centers (EERCs) — they will build off a concept the DOE successfully demonstrated in the previous Energy Frontier Research Centers (EFRCs) and the Scientific Discovery Through Advanced Computing (SciDAC) program. The new centers will support fundamental research to accelerate breakthroughs in support of the Energy Earthshots Initiative.
Read more on Lawrence Livermore National Laboratory.
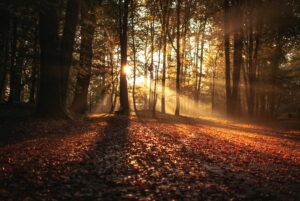
NCCS hosts modeling analysis of carbon uptake by global boreal forests
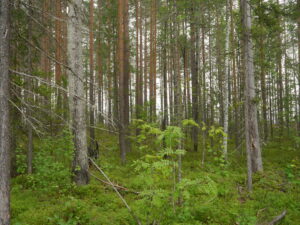
According to NASA research, summer 2023 was Earth’s hottest since global records began in 1880. In this changing climate, the Arctic and boreal region is experiencing the strongest warming trends – close to four times the global average.
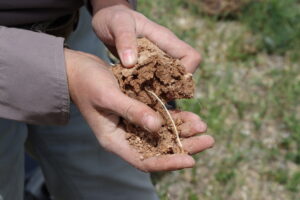
“This warming is having profound (often contrasting) impacts on the landscape and carbon cycle,” said Jennifer Watts, Assistant Scientist at Woodwell Climate Research Center in Falmouth, Massachusetts. For instance, “permafrost and seasonally frozen soils in this region hold more carbon than is currently in the entire atmosphere,” she said. As these soils thaw in warmer temperatures, solid carbon stored in them can become food for microbes and get converted into carbon dioxide or methane gas. “Adding these additional sources of carbon dioxide or methane into the atmosphere is very bad for our Earth because it further accelerates climate change, including the warming of Arctic-boreal regions,” Watts said.
Continue reading on NASA Center for Climate Simulation.
This summer previewed the security threats of climate change: The US needs to do more
Extreme weather events during this past summer — the hottest ever recorded — have highlighted the immediate danger of climate change to not only individuals, but also global security.
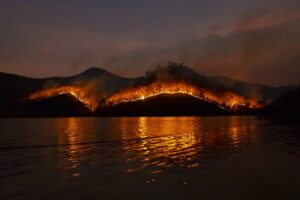
As fossil fuel emissions continue to increase (carbon emissions are on course for another record high), we will have to navigate a world of more severe extremes and their deadly impacts. Record high temperatures across the globe this summer were a case in point, with nearly half the world’s population facing at least 30 days of extreme heat. Heatwaves in turn fueled unprecedented wildfire seasons, such as the ongoing Canadian blazes that have burned 16.5 million hectares, displaced tens of thousands of Indigenous residents, and spread unhealthy air quality across North America. Maui’s wildfires were the deadliest the United States has seen in over a century, exceeding deaths in the United States from terrorism in any year following the 9/11 attacks. Southern Europe has been battling widespread forest fires as well, with Greece experiencing the largest wildfire on record in the European Union. Across the Mediterranean, devastating flooding in Libya has resulted in over 5,000 casualties.
Continue reading on Just Security.
Why September’s record-warm temperatures have scientists so worried
After months of record planetary warmth, temperatures have become even more abnormal in recent weeks — briefly averaging close to 2 degrees Celsius above preindustrial levels, a global warming threshold leaders are seeking to avoid.
“I thought we had seen exceptional temperatures back in July,” said Zeke Hausfather, climate research lead for the payment company Stripe. “What we’ve seen this week is well above that.”
The trend adds to near-certainty that 2023 will be Earth’s warmest on record, and heightens threats of the extreme conditions the heat could fuel around the world.
Read more on The Washington Post.
Q&A: How scientists tackle the challenges of estimating wildfire CO2 emissions
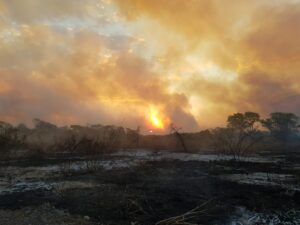
Wildfires – and their emissions – have made headlines around the world this year.
From the otherworldly haze that blanketed much of the US east coast in June to the devastating fire that ripped through Hawaii’s Maui in early August, the impacts of fire are becoming increasingly tangible beyond typically fire-prone regions.
Wildfires are fuelled, in part, by climate change. But they also change the climate, emitting around 5.3bn tonnes of CO2 to the atmosphere in 2022 – more than any country contributed from fossil-fuel burning that year, except China.
Continue reading on Carbon Brief.
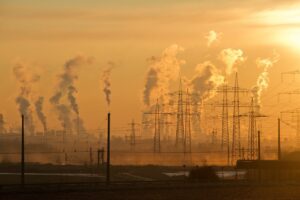
Fossil fuels are everywhere. How quickly could we actually phase them out?
Climate activists—and the U.N. Secretary-General—are calling for an end to fossil fuels. It could happen faster than you might think.
The world just lived through the hottest summer on record. Off the coast of Florida, the ocean temperature hit triple digits, killing coral reefs. Greece battled record wildfires. The extreme rain in Libya—where at least 11,000 people died in floods after dams collapsed—was made 50 times more likely by climate change. Phoenix spent 31 days above 110 degrees. Sea ice in Antarctica shrank to a record low, prompting what scientists called a “five-sigma event” that killed as many as 10,000 penguin chicks.
Despite the fact that extreme climate impacts are already obvious, most companies and countries are still making only incremental changes to cut emissions (or, in some cases, are moving backward, like in the U.K., where the prime minister now wants to slow down plans to move to electric vehicles). But what would be possible if we committed to actually moving fast on climate action beginning with the largest challenge: phasing out fossil fuels?
“There are so many cultural differences to consider,” notes Dave McGlinchey. “From how the meetings proceed, to specific local sensitivities, even down to Congolese humor. Even if I was cracking jokes in fluent French, it would be impossible to get the tone right. That’s why having someone like Joseph was so important.”
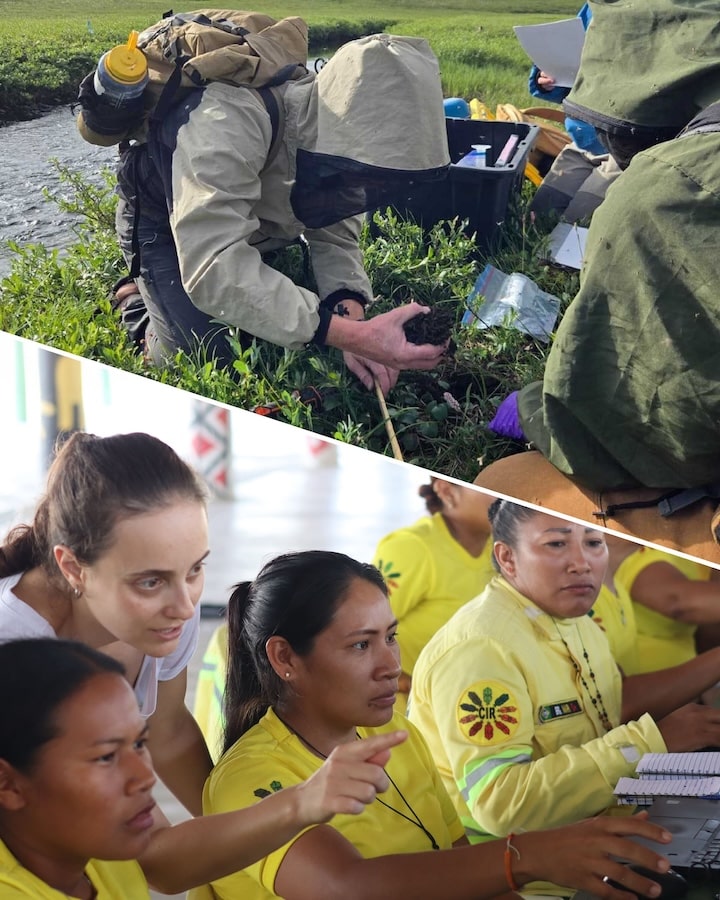
In July, McGlinchey, Chief of Government Relations at Woodwell Climate, traveled with members of the Center’s risk team to Kinshasa in the Democratic Republic of Congo for a two-day workshop. The Center has been involved in community work in the country for over 15 years, led in large part by Joseph Zambo, Woodwell’s policy coordinator in the DRC. This workshop represents the latest collaboration— an initial assessment of the country’s future climate risks. Congolese professors, scientists, and government officials joined to discuss gaps in the data and to develop adaptation strategies to be included in a final report later this year.
The workshop was facilitated by Zambo who, with poignant questions, stories to recount, and of course, a bit of humor, guided the group through the tough work of planning for the future.
Expanding access to climate risk data
The community risk work in Kinshasa is one of over 20 successful risk assessments conducted as part of Woodwell Climate’s Just Access initiative. The project produces free, location-specific climate risk analysis for cities and regions both in the US and abroad. The hope is that, by providing free access to quality data— something often offered by private companies at prohibitively high costs — Just Access can facilitate adaptation planning for under-resourced communities.
“With Just Access, we want to remove the barrier of cost for communities that want to understand the long-term risks they are facing because of climate change,” says McGlinchey. “Often these communities are the ones already facing climate-related challenges that will worsen as the century goes on.”
Guided by a community’s particular concerns, Woodwell’s Risk team works with available data on key climate risks—flooding, heat, water scarcity, fire— and uses models to construct an image of how those events are likely to change as global temperatures climb. In the DRC, water is a core concern, both in its absence, causing drought and crop failure, and in its abundance.
“Heavy rains cause horrific flooding in the city of Mbandaka almost once or twice a year,” says Zambo. “In the capital, heavy rains are also destroying homes, roads, electrical structures, and internet connections.”
The most pressing risks vary from region to region. Across the world, in Acre, Brazil, Senior Scientist Emeritus Dr. Foster Brown says, “the word here is ‘heat.’” In Homer and Seldovia, Alaska, increasing wildfire days featured heavily.
But improvements in data availability and resolution, as well as refinements of climate models, have made it possible to replicate assessments for a variety of risks in places as distant and different from each other as Homer, Alaska and Kerala, India. Risk assessments can offer both region-wide crop yield estimates and street-level maps of flooding for a single city district to inform community planning.
It’s about building trust
Key to the success of municipal-level work are relationships with people like Zambo, who can offer insights into the needs of a community that can’t be approximated from the outside. Each community is different— in what information they need to make decisions, their level of technical expertise, their governmental capacity to implement changes, and in the ways they prefer to work.
So, with each new assessment, the Risk team starts from scratch, building new relationships and listening to community needs. This process takes double time on the international stage, where a history of superficial NGO and academic involvement can overshadow collaboration.
“A main goal with these reports is trust,” says Darcy Glenn, a Woodwell Climate research assistant who organized a risk assessment and workshop for Province 1 in Nepal last year with help from connections from her master’s program. “Building trust in the models, and trust in the methodology, and in us. That’s been our biggest hurdle when working with municipal leaders.”
Building that trust takes time. Province 1 was one of an early set of communities who worked with Woodwell Climate on risk assessments. While local leaders were interested in flooding and landslide risk information, what they really wanted was to increase the capacity of their own scientists and government employees to conduct climate modeling themselves. So the project was adapted to meet that need by tailoring a training workshop. The process took over a year to complete but Glenn says, that’s relationship-building time that can’t be rushed.
It also highlights the importance of pre-established long term connections in the places we work.
“It’s one thing to go into a new community by yourself, it’s another to go in with someone who has been there 30 years and can help navigate,” says Dr. Brown. “You have to look for the key people who can help make things happen.”
Within Brazil, Dr. Brown is now regarded as one of these “key people”. He has been living and working in Rio Branco for over 30 years and his credibility as a member of the community helped facilitate an assessment of extreme heat risk in the region. In the DRC, Zambo has been working with Woodwell Climate on various projects for over a decade. Without their expertise to bridge cultural and language gaps, completing projects in Brazil and the DRC would not have been possible.
Working for the Future
After getting risk information into the hands of communities, then comes the hard work of putting it to use. For Dr. Christopher Schwalm, Director of Woodwell Climate’s Risk Program, “the goal of the risk assessments is to give communities every potential tool we can to build resilience for themselves and future generations. With access to the right information, the next step in the adaptation planning process can begin.”
In Rio Branco, Dr. Brown says speaking to the changes people are already noticing has helped individuals connect better to the data. He’s been using the context of heat and fire alongside information from their report to strengthen conversations about existing forest and climate initiatives, authoring an alert for the tri-national “MAP” region (Madre de Dios in Peru, Acre in Brazil, and Pando in Bolivia) about heat conditions and the implications for this year’s fire season.
He has also been introducing the information from the report to the community in other ways— teaching and speaking at events. According to Dr. Brown, widespread understanding of both near- and long-term climate risks will become more important for all communities as climate change progresses and impacts each place differently. Cities and towns will need reliable information to help them practically plan for the future.
“We’re trying to get people to expand their time ranges and start thinking about the future. And this report has helped,” says Dr. Brown. “Because the people who are going to see 2100 are already here. What will we be able to tell them about their future?”