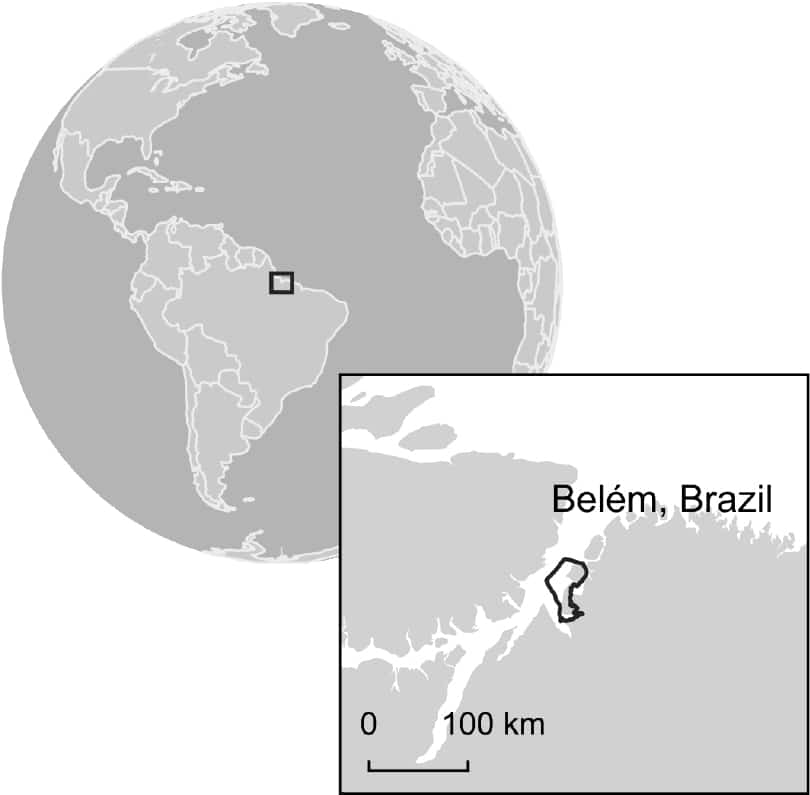
Climate risk assessment: Belém, Pará, Brazil

Introduction
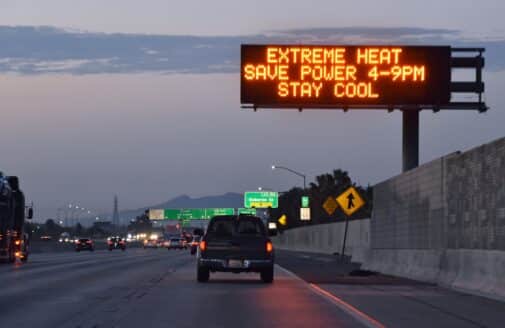
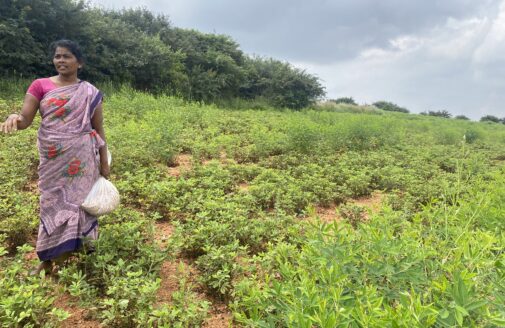
The impacts of climate change on frequency and severity of physical hazards will put many communities at risk. As the threat of climate change grows, so too does the need for accessible information, tools, and expertise to support climate resilient decision-making for municipalities. In the newly released report Recognizing Risk—Raising Climate Ambition, Woodwell Climate highlights the need to localize and customize climate risk assessments. However, the private sector is meeting the majority of the need for climate data and analyses, reducing access for communities without sufficient financial resources. To address this gap, Woodwell works with communities across the world, including Belém, Pará, in Brazil, to provide granular climate services, free of charge.
Results
Figure 1: Change in temperature annual range
This figure shows future changes in the difference between the highest maximum temperature and the lowest minimum temperature within a year relative to 1970-2000. Higher values indicate that the difference (how much temperatures “spread” within a year) will increase over time. We can see that the hot months of the year will get hotter and cold months colder.

Figure 2: Change in precipitation of wettest month
This figure shows future changes in the precipitation of the wettest month of a year relative to 1970-2000. Higher values indicate that that the wettest month will become wetter over time. Notice that the ensemble of models project a reduction of precipitation until 2060-2080 (first three maps), and after that, an abrupt increase (last facet).

Figure 3: Change in precipitation of driest month
This figure shows future changes in the precipitation of the driest month of a year relative to 1970-2000. Higher values indicate that the driest month will become drier over time.

Figure 4: Change in length of fire season in Pará
This figure shows future changes in the length of the fire season in the state of Pará relative to 1970-2000. Higher values indicate an increase (in days) of such length, and thus, more risk of wildfires. This figure highlights Belém’s exposure to worsening air quality over time.

Figure 5: Wet-bulb temperature
This figure shows historical and future frequency of days/year over 28 °C of wet-bulb temperatures. Wet-bulb temperature is a “feels-like” temperature indicator (strictly speaking, it is defined as the air temperature at 100% relative humidity). A wet-bulb temperature of 28 °C is considered dangerous for humans; continued exposure to it can lead to severe heat stress.