Climate risk assessment: Canastra Region, Brazil
Introduction
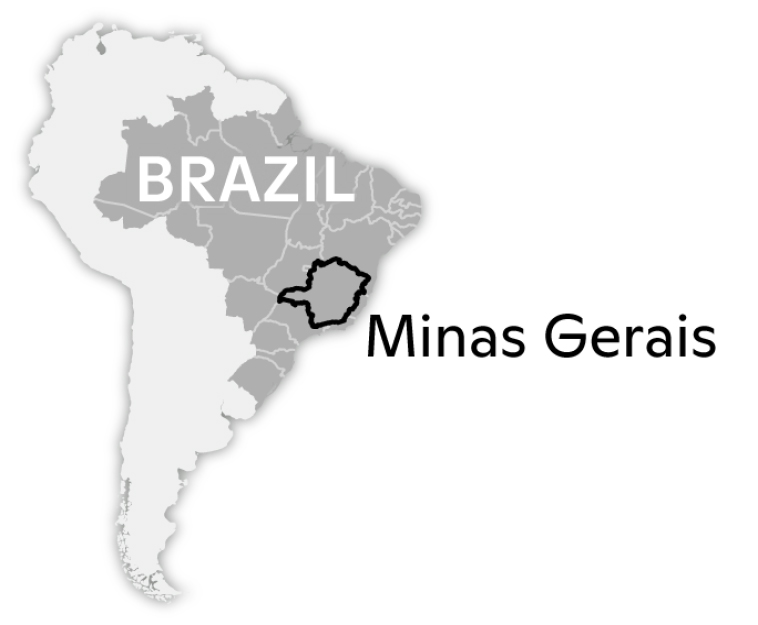
The impacts of climate change on the frequency and severity of physical hazards are putting many communities at risk. As the threat of climate change grows, so too does the need for accessible information, tools, and expertise to support climate-resilient decision making for municipalities. Woodwell Climate Research Center (“Woodwell”) believes there is a need to localize and customize climate risk assessments. This information is critical for local government leaders as they make planning decisions, but it is not available to all communities. Woodwell believes that this science should be freely and widely available. To address this gap, Woodwell works with communities across the world, including the Canastra Region of Minas Gerais, Brazil, to provide municipal climate assessments, free of charge.
Results summary
As a result of climate change, Minas Gerais can expect up to an additional 15 weeks’ worth of dangerous heat per year and up to an additional five weeks’ worth of high wildfire potential in the coming decades. The Canastra Region can also expect up to five and a half additional weeks’ worth of dangerous heat and up to three and a half additional weeks’ worth of high wildfire potential annually. The probability of maize yield failures will increase in both Minas Gerais and the Canastra Region with a maximum 68% chance of occuring in any given year in 2041–2060. The probability of soybean yield failures will increase in the far-west portion of Minas Gerais, but will generally decrease in the Canastra Region. Negative impacts associated with these climate hazards will be disproportionately felt by elderly, poor, and Indigenous populations. Here we present our findings on heat danger days, wildfire, and changes in maize and soybean yield failures to help the Canastra Region of Minas Gerais, Brazil in its plans to create a more resilient future for all residents.
Heat danger days
Heat danger days, defined as days when combined temperature and humidity result in a “feels like” temperature of 39.4°C (103°F) or higher, represent a level of heat stress where heat exhaustion is likely, and heat stroke is possible for anyone engaging in physical activity outdoors. The frequency of such days is set to increase throughout much of Minas Gerais as the climate warms. In 2000–2020, there was an average of zero to 83 heat danger days per year across the state (Fig. 1a). In 2040–2060, the region can expect between zero and 106 additional heat danger days per year (Fig. 1b). The far-west portion of Minas Gerais has historically been the hottest part of the state, and it stands to see the largest increase (128%) in heat danger days over the next three decades. Actual temperatures across the state will vary depending on elevation, tree canopy, and concentration of buildings, concrete, and asphalt.
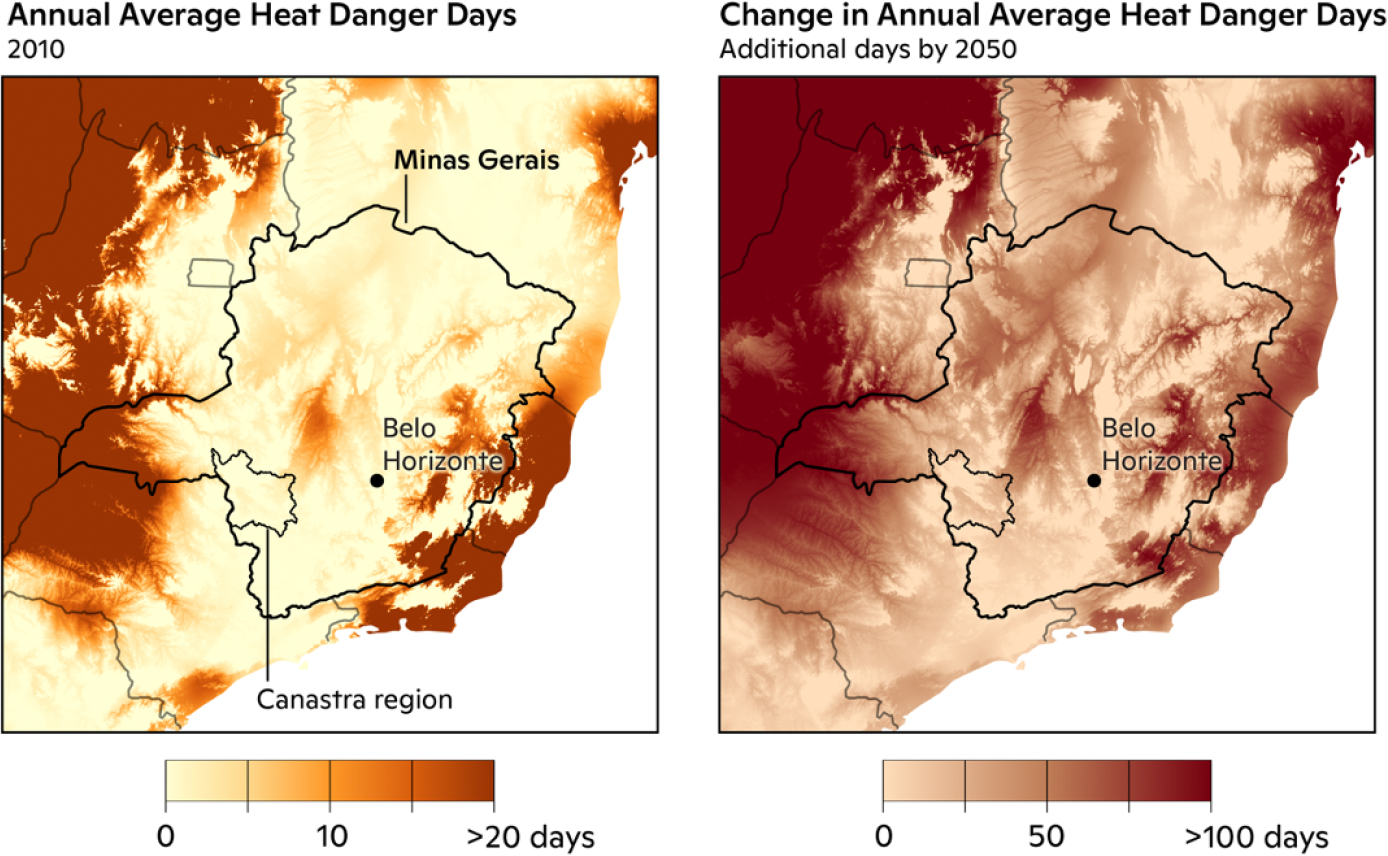
Figure 1. Heat Danger Days, Minas Gerais. (a) Annual average number of heat danger days, 2000–2020. (b) The additional number of days with dangerous heat, 2040–2060.
In the Canastra Region, there has historically (2000–2020) been an average of zero to four heat danger days per year (Fig. 2a). An annual average additional zero to 39 such days can be expected throughout the Region in 2040–2060. Some areas, particularly in northeast Canastra, could experience dangerous heat an average of six weeks per year by mid-century (Fig. 2b).
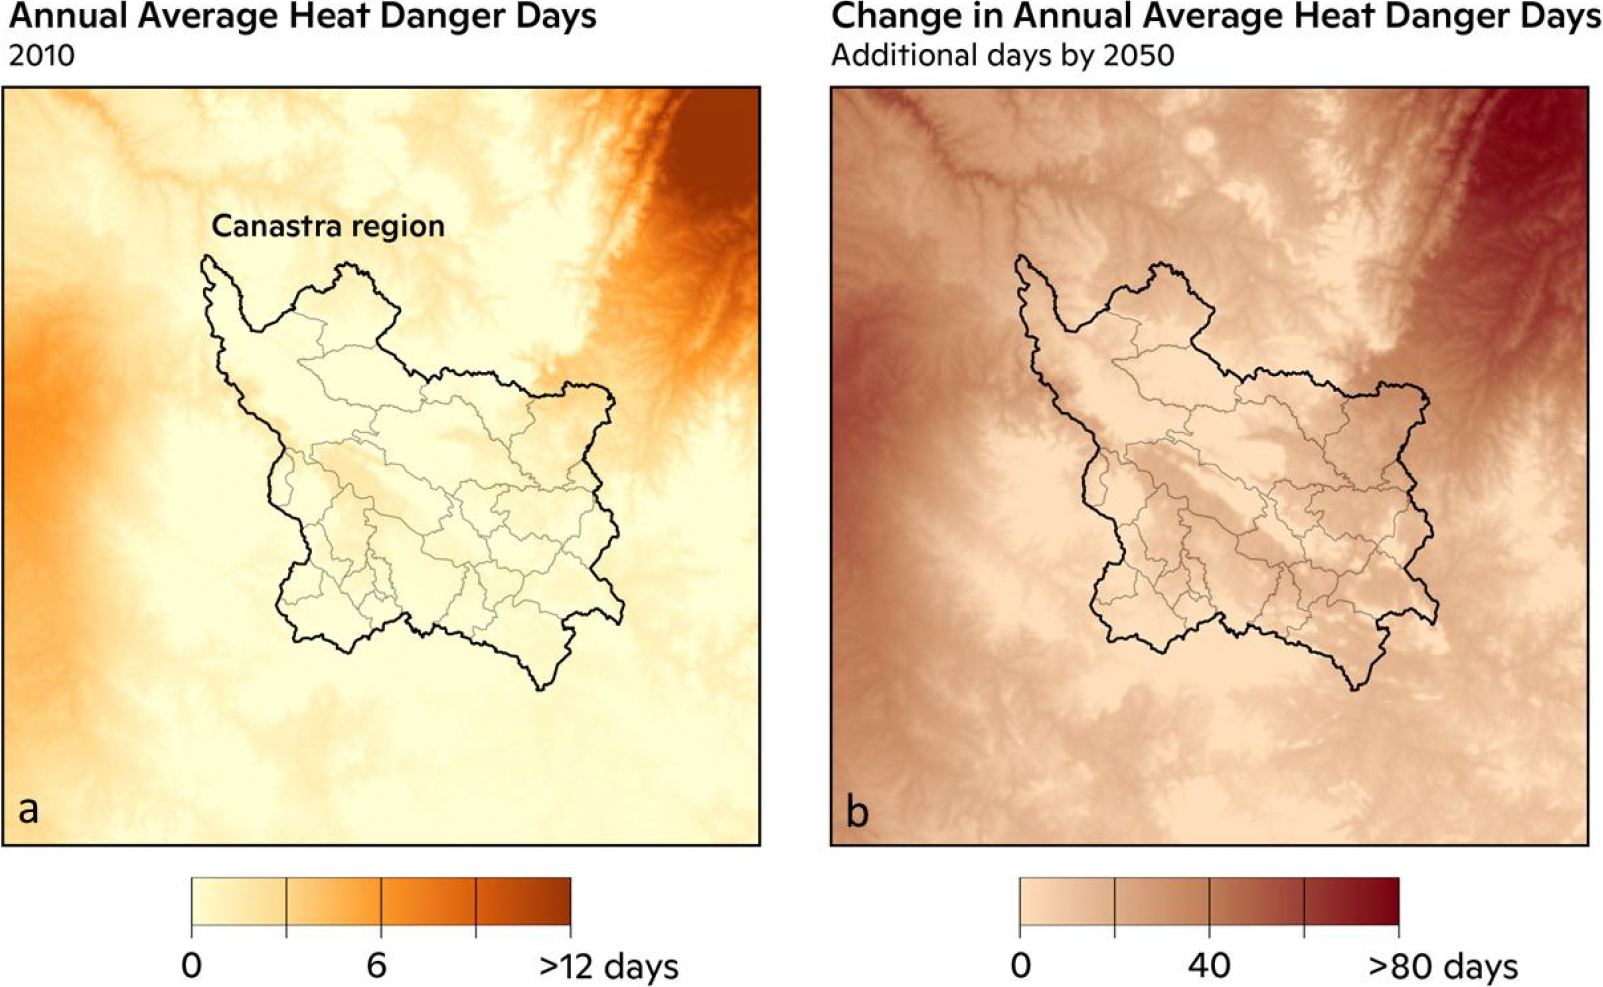
Figure 2. Heat Danger Days, Canastra Region. (a) Annual average number of heat danger days, 2000–2020. (b) The additional number of days with dangerous heat, 2040–2060.
Wildfire
To assess future change in wildfire danger for Minas Gerais, we analyzed Fire Weather Index (FWI) data. FWI is a unitless measurement of fire risk used globally and is derived from temperature, relative humidity, wind speed and precipitation. The change in wildfire danger days (Fig. 3) was calculated by determining the additional number of days per year in the future that are predicted to have a FWI value greater than the historical (2000–2020) extreme (1-in-20-day occurrence) FWI value. This threshold indicates a high-danger wildfire day, where fires have the potential to quickly grow out of control in the event of natural or human-caused ignition. By mid-century (2040–2060), Minas Gerais can expect an average additional 10–35 wildfire danger days per year, signifying a yearly increase of 56–194% over the historical average of 18 days per year. The central part of the state is expected to see the largest increase in potential wildfire danger.
The Canastra Region can expect an average additional 15–25 wildfire danger days per year by mid-century, an increase of 83–139% over the historical annual average of 18 days (Fig. 4). This essentially means the Region can expect up to a three-and-a-half week increase in the length of its wildfire season.
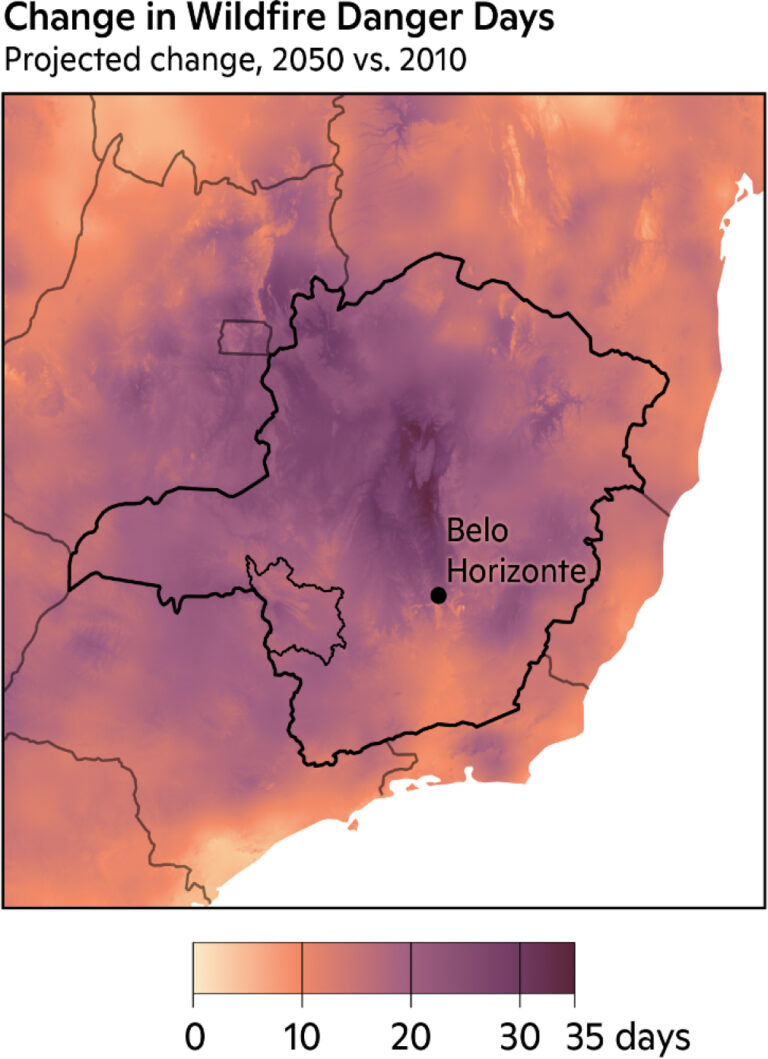
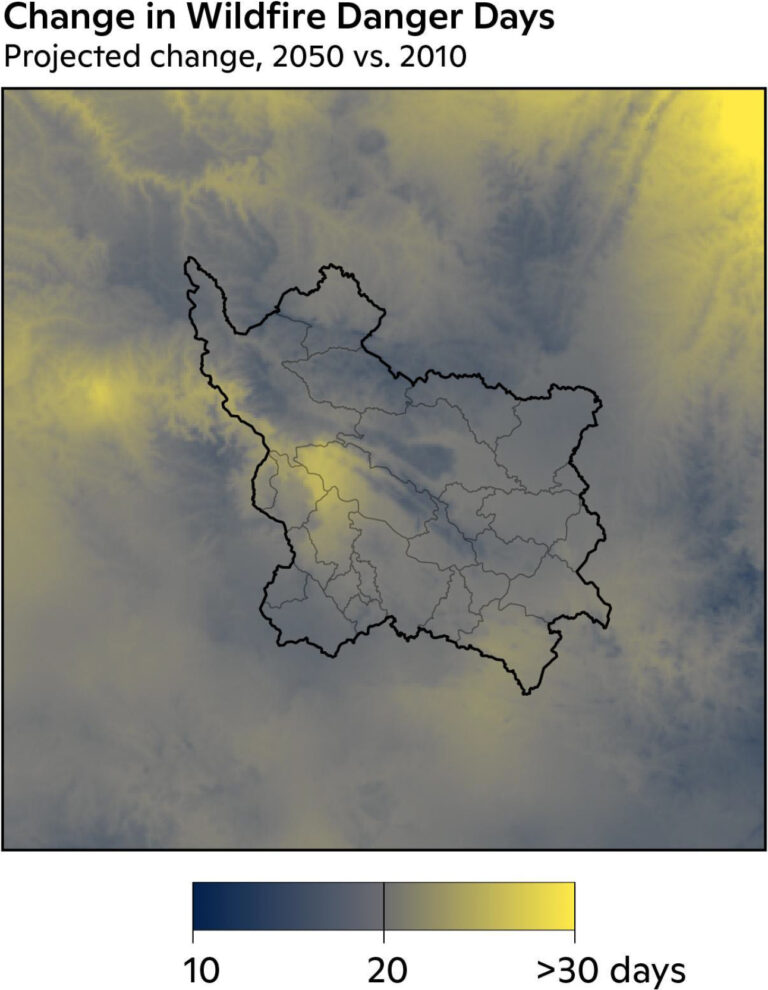
Figure 3. Change in Wildfire Danger Days, Minas Gerais. The additional number of days with high wildfire potential in 2040–2060 compared to 2000–2020.
Figure 4. Change in Wildfire Danger Days, Canastra Region. The additional number of days with high wildfire potential in 2040–2060 compared to 2000–2020.
Crop yield failures
To project changes in mid-century maize and wheat yields, we analyze output from an ensemble of crop and climate models from the Agricultural Model Intercomparison Project (AgMIP) under climate scenario, RCP8.5. We calculate the probability of maize and wheat yield failures, defined as at least 10% decline in yield compared to average yield in the historical period, 1998–2017. The likelihood of crop yield failure is driven by climatic changes in precipitation and temperature. Anthropogenic factors such as land use patterns, technological advances in crop genetics and irrigation or changes in irrigation withdrawal are not included in these baseline projections.
Maize
In 2018–2020, the state of Minas Gerais produced 8% of Brazil’s maize production (FAOSTAT). Throughout the state, the probability of maize yield failure will either remain the same or increase in 2041–2060 compared to 1998–2017. In 1998–2017, there was a southwest to northeast gradient of increasing likelihood of maize yield failure with a probability range of 11–61% (Fig. 5, left). In 2041–2060, the gradient disappears and the probability range of maize yield failure shifts higher to 32–68% (Fig. 5, middle). The far-west portion of Minas Gerais will see the largest increase in probability of maize yield failure up to 49% while the northeastern portion will see no change to up to 23% increase (Fig. 5, right).
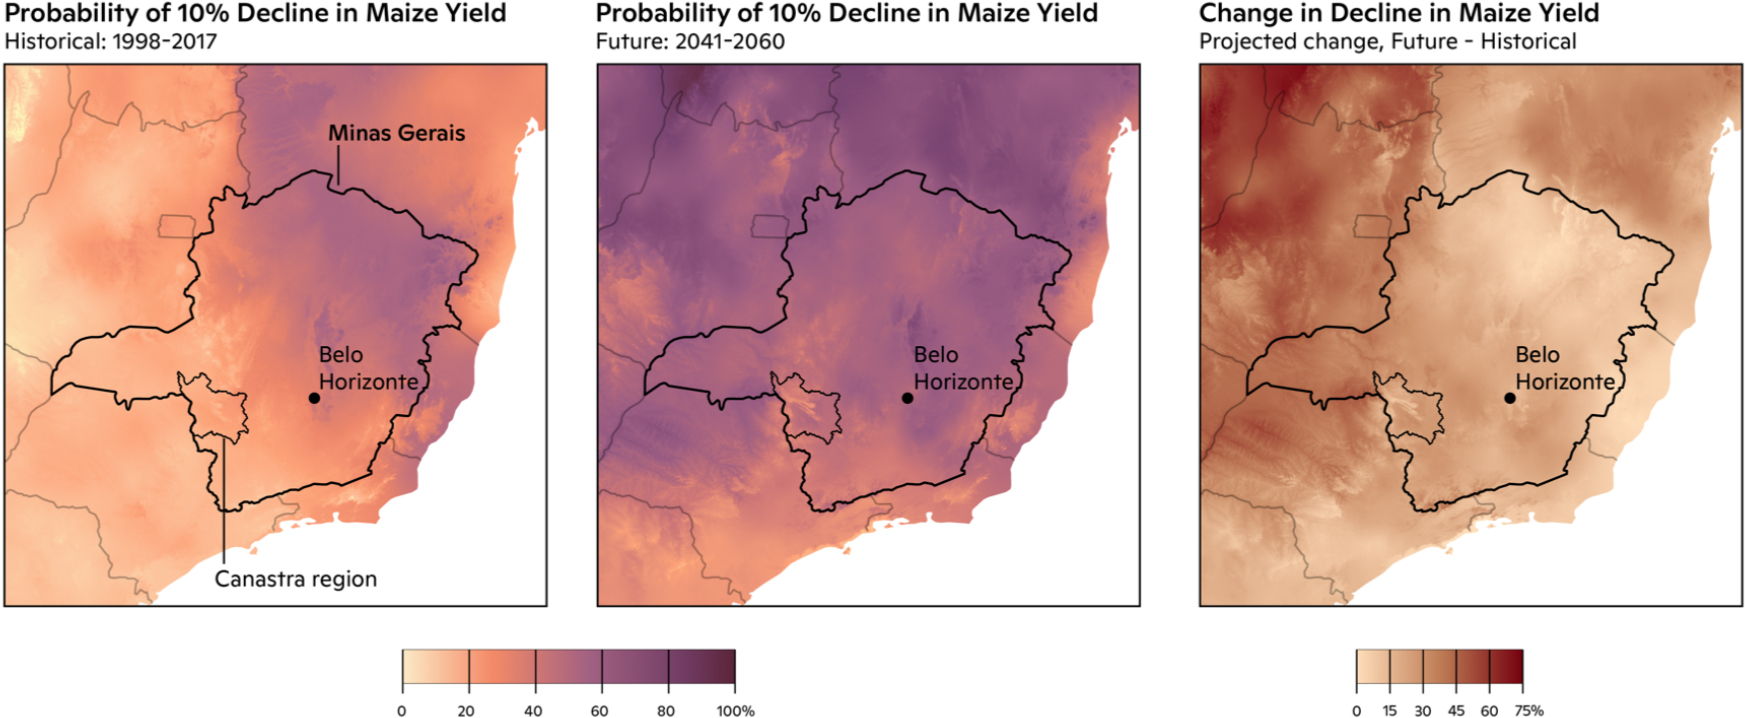
Figure 5. Maize Yield Failure, Minas Gerais. (left) Probability of a 10% decline in maize yield, 1998–2017. (middle) Probability of a 10% decline in maize yield, 2041–2060. (right) Change in probability of 10% decline in maize yield, 2041–2060 minus 1998–2017.
In the Canastra Region, the probability of a maize yield failure in any given year in 1998–2017 has been between 11–23% (Fig. 6, left). The occurrence of maize yield failure will increase throughout the Region in 2041–2060 by as much as 46% (Fig. 6, right). In any given year in 2041–2060, the probability of a maize yield failure will be 29–61% (Fig. 6, middle).
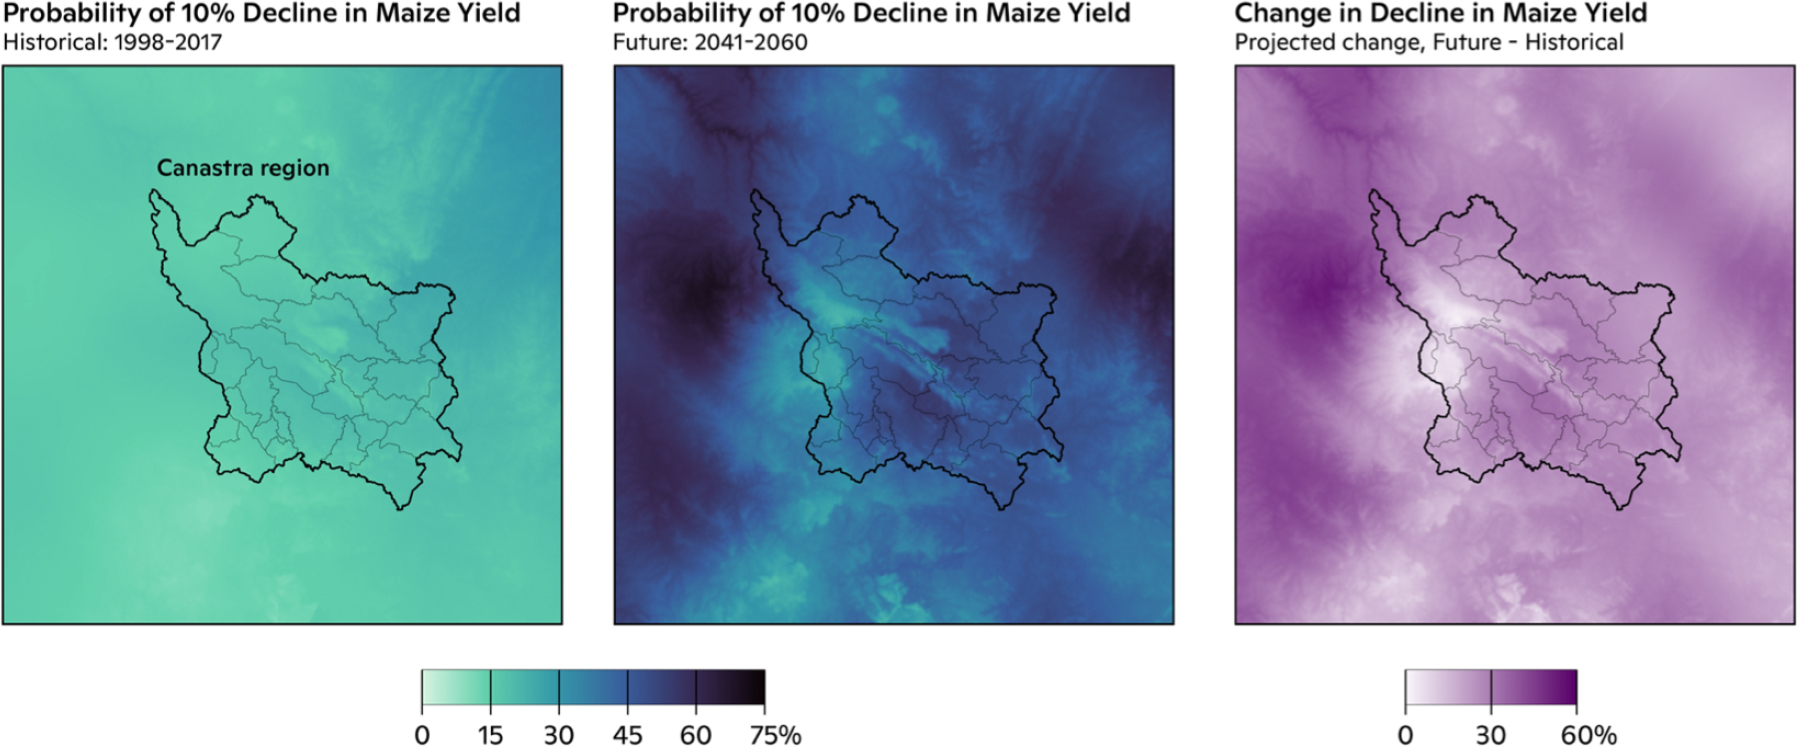
Figure 6. Maize Yield Failure, Canastra Region. (left) Probability of a 10% decline in maize yield, 1998–2017. (middle) Probability of a 10% decline in maize yield, 2041–2060. (right) Change in probability of 10% decline in maize yield, 2041–2060 minus 1998–2017.
Soybean
In 2018–2020, the state of Minas Gerais produced 5% of Brazil’s soybean production (FAOSTAT). The change in probability of soybean yield failure will vary spatially throughout the state. In 1998–2017, there was a southwest to northeast gradient of increasing likelihood of soybean yield failure—similar to maize but with a smaller probability range of 20–58% (Fig. 7, left). In 2041–2060, regions of lower probability of soybean yield failure will appear, particularly in the Canastra Region, and the probability range of soybean yield failure spreads to 14–76% (Fig. 7, middle). The far-west portion of Minas Gerais will see the largest increase in probability of soybean yield failure up to 20% while the southern portion will see no change to up to 14% decrease in probability (Fig. 7, right).
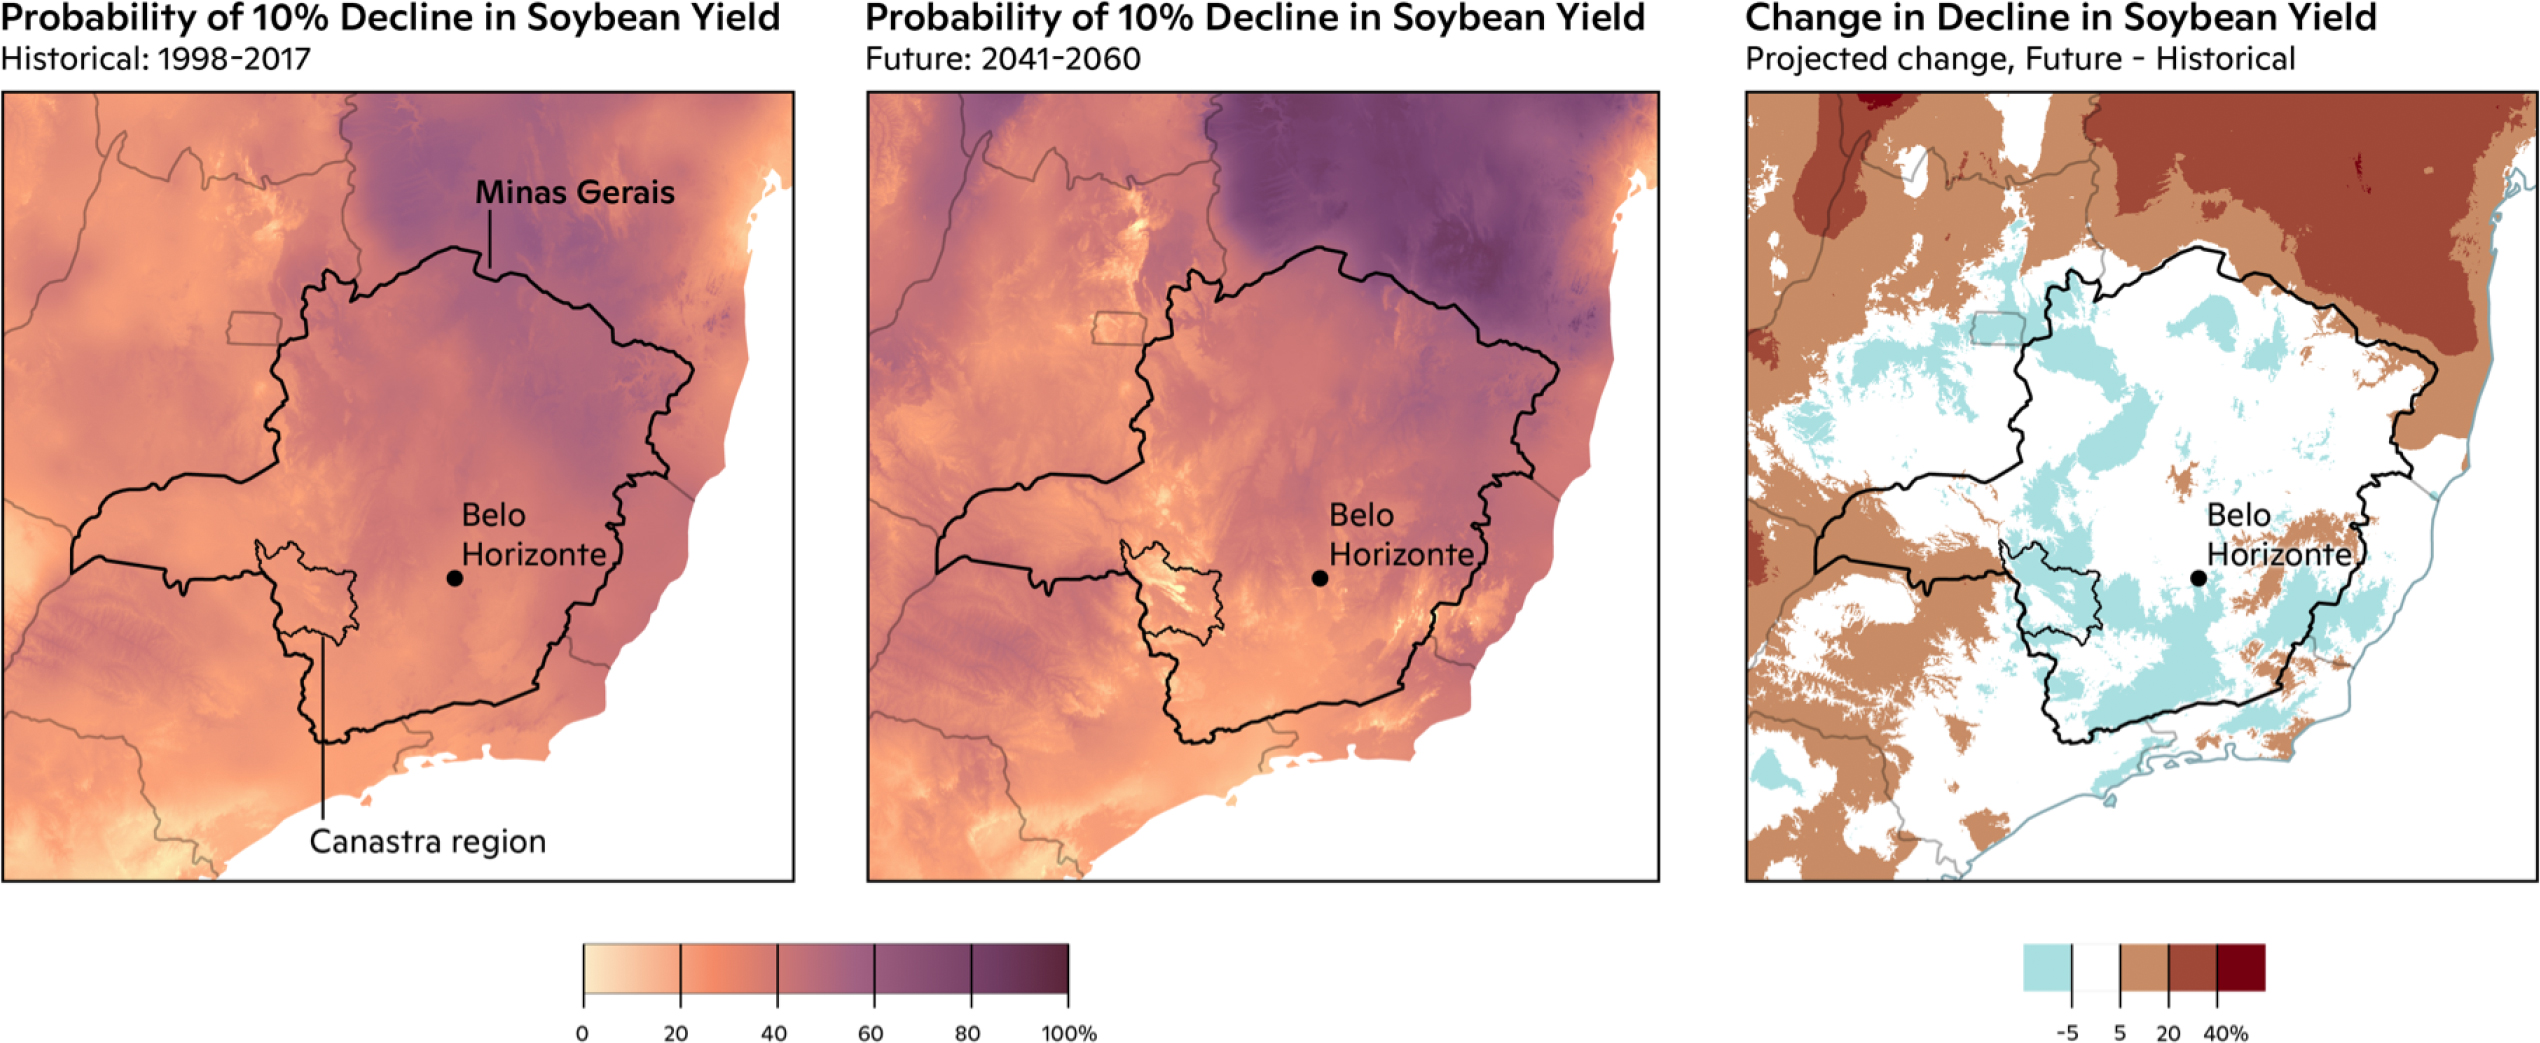
Figure 7. Soybean Yield Failure, Minas Gerais. (left) Probability of a 10% decline in soybean yield, 1998–2017. (middle) Probability of a 10% decline in soybean yield, 2041–2060. (right) Change in probability of 10% decline in soybean yield, 2041–2060 minus 1998–2017.
In the Canastra Region, the probability of a soybean yield failure in any given year in 1998–2017 has been between 23–34% (Fig. 8, left). The occurrence of soybean yield failure will generally decrease throughout the Region in 2041–2060—as much as -10%—but will increase up to 11% in the far northwestern portion (Fig. 8, right). In any given year in 2041–2060, the probability of a maize yield failure will be 17–34% (Fig. 8, middle).
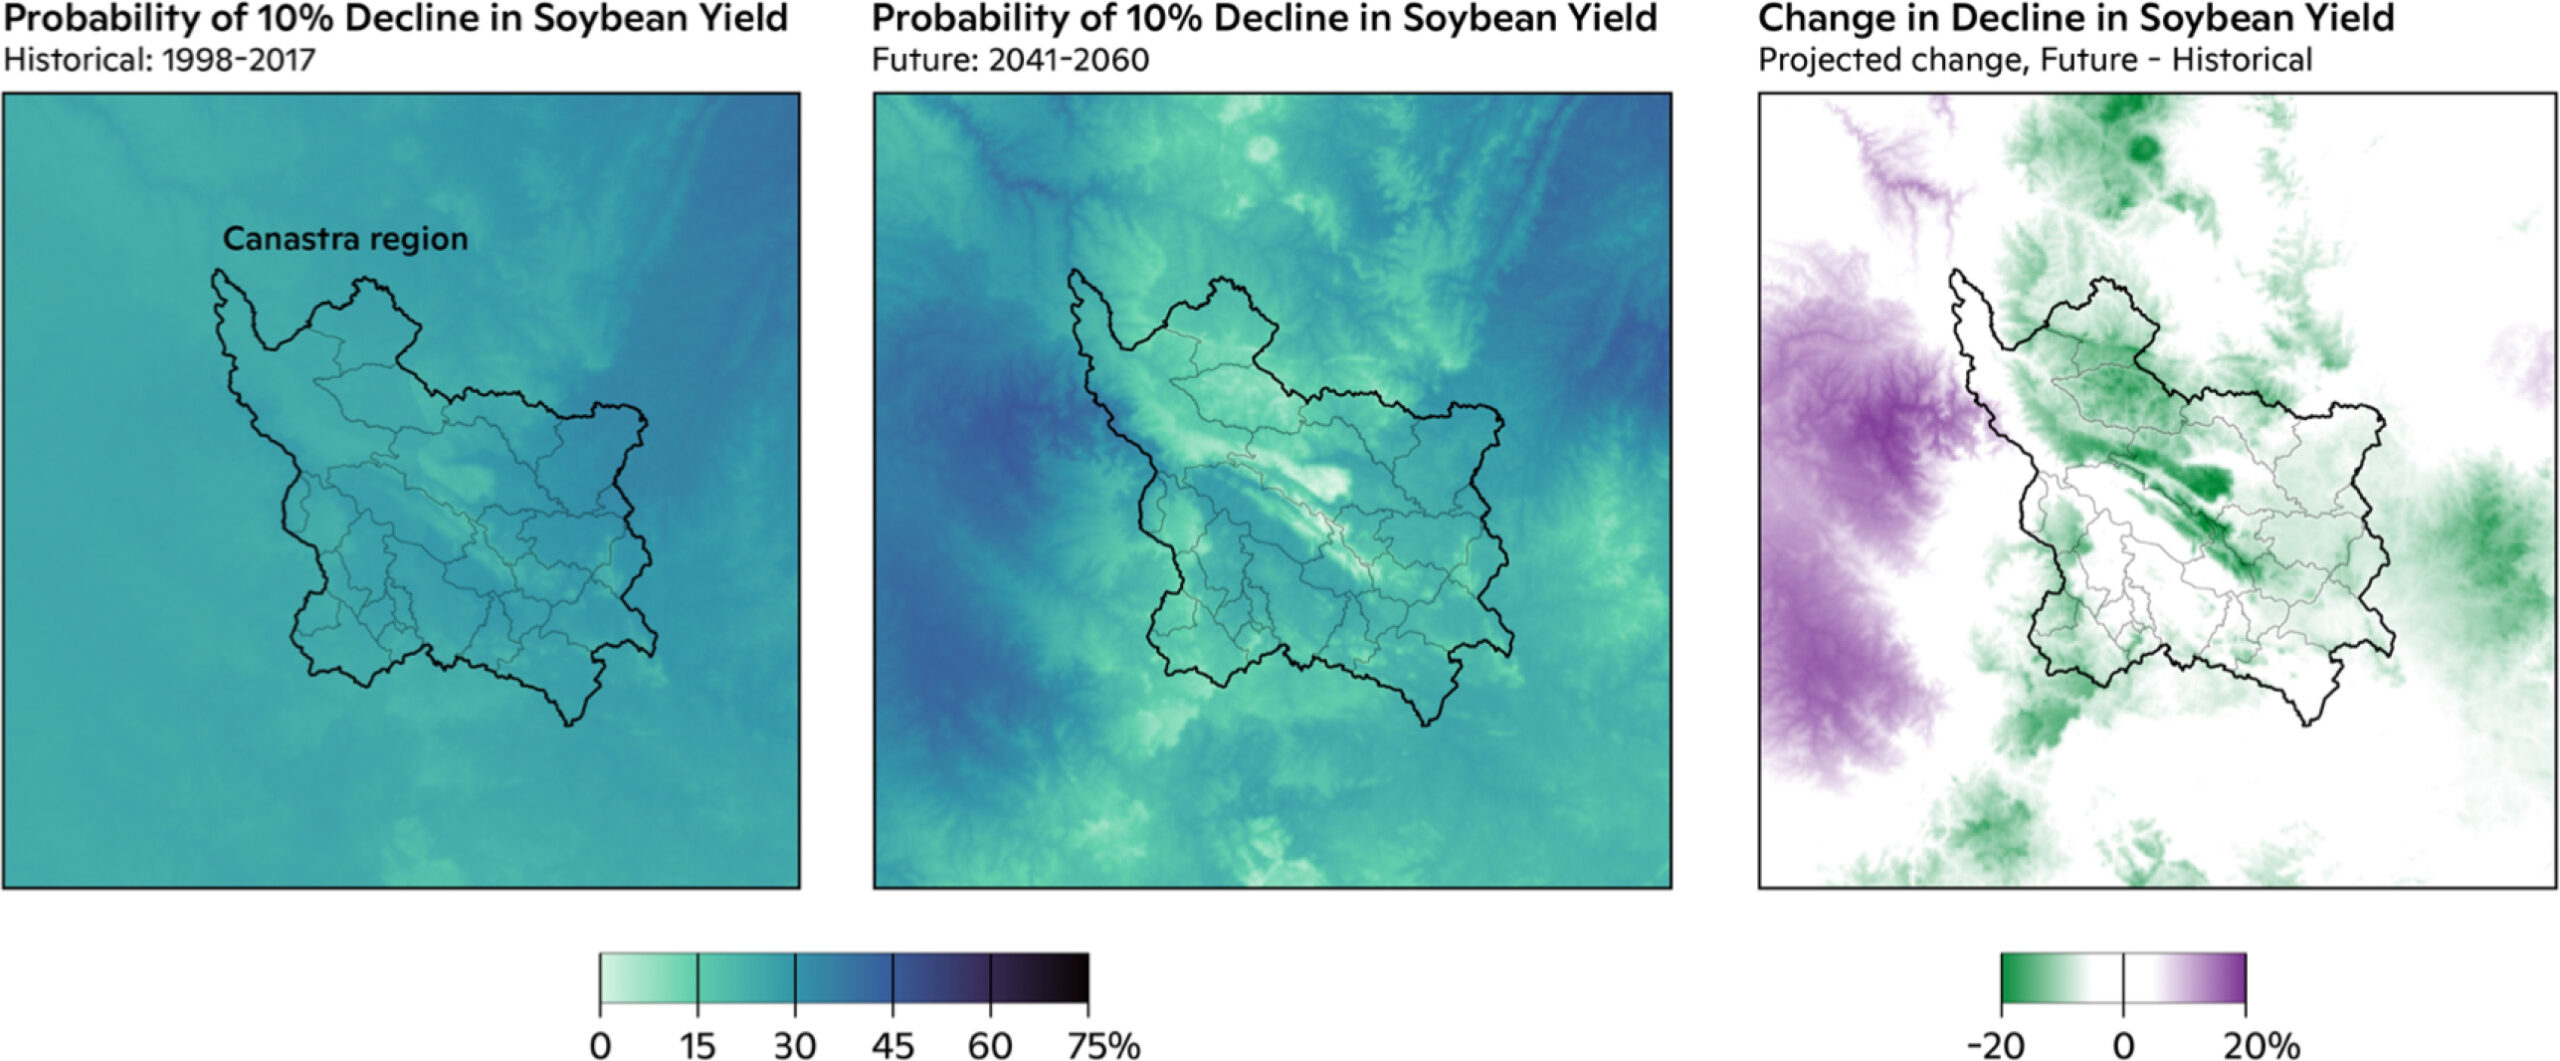
Figure 8. Soybean Yield Failure, Canastra Region. (left) Probability of a 10% decline in soybean yield, 1998–2017. (middle) Probability of a 10% decline in soybean yield, 2041–2060. (right) Change in probability of 10% decline in soybean yield, 2041–2060 minus 1998–2017.