Climate risk assessment: Homer and Seldovia, Alaska
Introduction
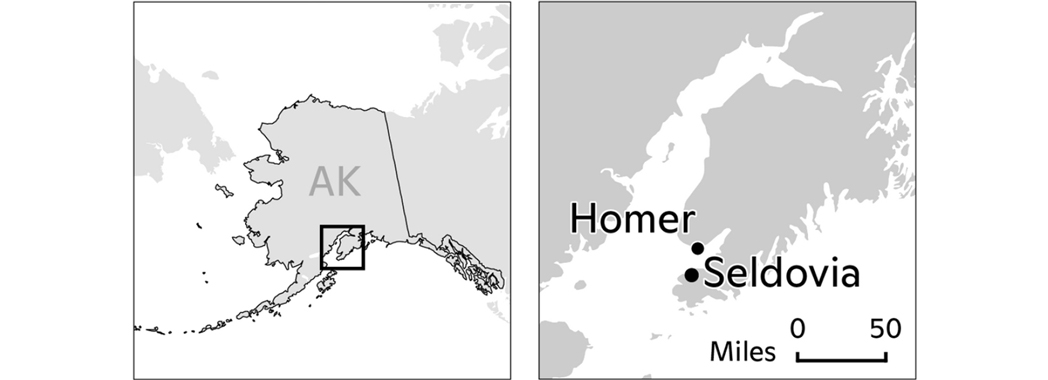
The impacts of climate change on the frequency and severity of physical hazards will put many communities at risk. As the threat of climate change grows, so too does the need for accessible information, tools, and expertise to support climate-resilient decision-making for municipalities. In the report Recognizing risk—raising climate ambition, Woodwell Climate Research Center (“Woodwell”) highlights the need to localize and customize climate risk assessments. However, given that the private sector is meeting the majority of the need for climate data and analyses, communities without sufficient financial resources often do not have access to this information. To address this gap, Woodwell works with communities across the world, including Homer, AK and Seldovia, AK, to provide granular climate services, free of charge.
Results Summary
Wildfire and Temperature
The Arctic is experiencing the most dynamic increase in surface temperatures globally; Alaska, in particular, is warming 2+ times the rate of the contiguous United States. Rapid warming means that Alaska is already and will continue to experience the impacts of climate change, such as an increase in wildfire risk, more severe droughts, and heightened flooding. In this assessment we describe each climate hazard in turn, focusing on local effects. The majority of wildland fires on the Kenai Peninsula are human-caused, with open-burning being most prevalent. Lightning-caused fires are infrequent on the southern Kenai Peninsula, and while these fires have not been documented within the boundaries of Homer, they have occurred in the vicinity. There is an increasing risk of wildfire within Homer and other areas of the Kenai Peninsula due to spruce bark beetle infestation as dead trees become dry and flammable. Summer 2019 was an active fire year for Alaska with unprecedented record-high temperatures, long-term drought, and high winds. Around Homer, the number of wildfire danger days will increase in the future as temperatures rise and drought worsens.
Results
Figure 1: Change in Wildfire Danger Days
This map shows the average number of additional days per year in 2021-2050 with Fire Weather Index (FWI) above the historical (1971-2000) 95th percentile. These values (in days) are in addition to the annual average of 18.25 days (5% of the year) in 1971-2000 that exceeded the 95th percentile FWI. FWI is a daily, unitless measurement of wildfire danger, derived from temperature, relative humidity, wind speed, and precipitation. This metric was developed by the Canadian Forest Service and is used globally, including in the United States, to quantify fire risk.
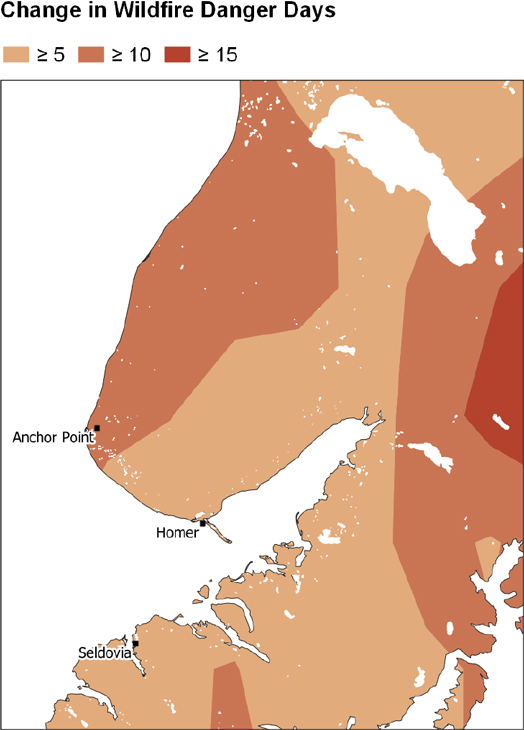
Figure 2: Changes in Seasonal Pattern of Extreme Fire Weather Conditions
Colored lines show how extreme fire weather conditions will change under different warming levels by month. Extreme fire weather is defined here as the 95th percentile of the distribution of the Fire Weather Index (FWI) for a given month for a given warming level. A 1°C warming level corresponds to current conditions. Breaching 1.5°C and 2°C of warming, under current climate policy, is expected to happen between 2025 and 2030 and around 2040, respectively. While changes in extreme fire weather will be modest across warming levels, the peak of extreme fire weather will shift from July to August with warming greater than 1.5°C.
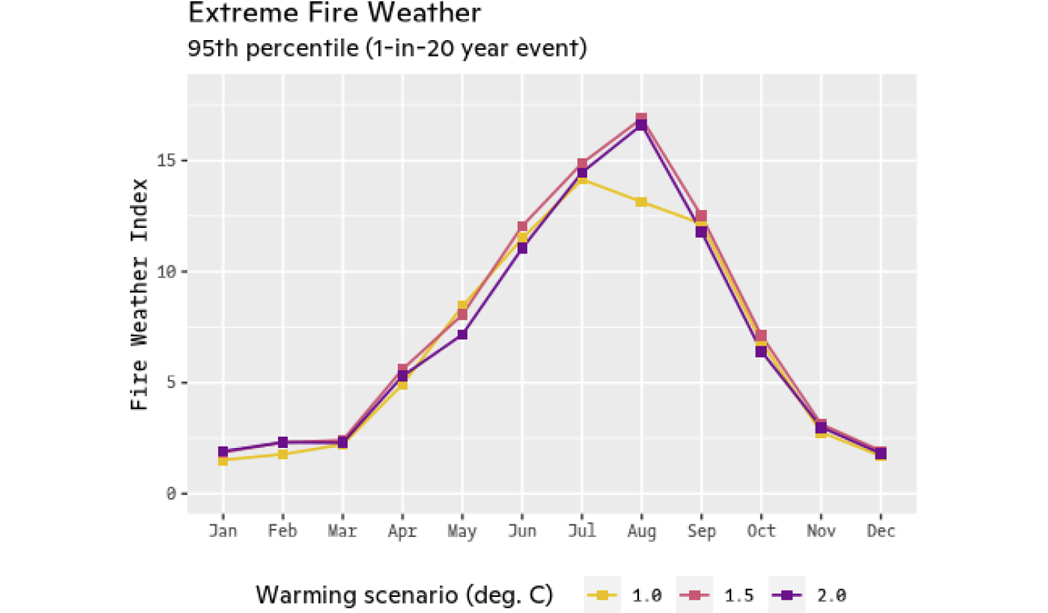
Figure 3: Changes in Maximum Temperature
Maps show maximum temperature in 1971-2000 (left) and average days per year in 2021-2050 expected to exceed 1971-2000 maximum temperature (right). While a record-high temperature of 81°F was measured at the Homer Airport in 1993, when temperature data are aggregated to grid cell scale (22km resolution), the maximum temperature for Homer (Seldovia) is around 78°F (77°F) for 1971-2000. This temperature is expected to be exceeded around 18 (25) days per year in 2021-2050 for Homer (Seldovia).
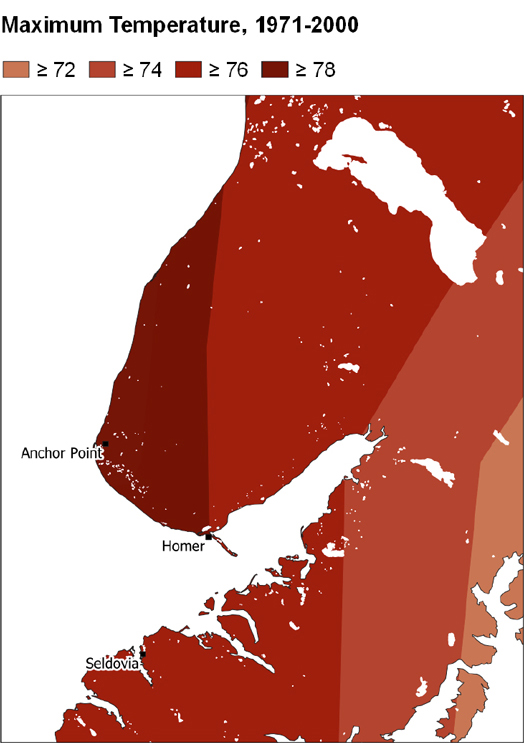
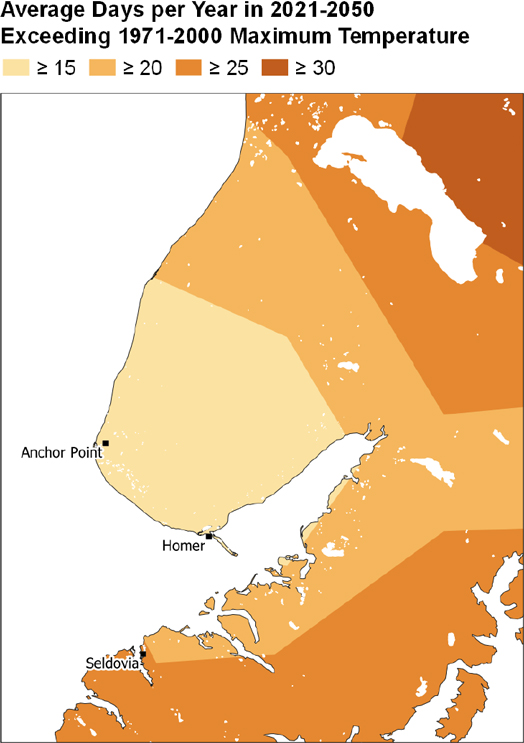
Figure 4: Change in Drought Stress
Maps show drought stress in 1971-2000 (left) and amount of time in 2021-2050 expected to have worse drought stress (right). Drought stress is based on the Palmer Drought Severity Index (PDSI), a metric used by the U.S. Drought Monitor. Lower PDSI values indicate less available water and therefore more extreme drought. Left panel shows the 1-in-20 year drought (5th percentile) for 1971-2000. Moderate, severe, and extreme droughts correspond to PDSI values equal to or less than -2, -3, and -4, respectively. Right panel shows that throughout 2021-2050, Homer (Seldovia) can expect to experience extreme (severe) drought conditions around 20% (30-40%) of the time. These conditions were present 5% of the time in 1971-2000, so these values represent increasing risk of severe and extreme drought in the near future. For example, at the top of Tutka Bay, 1971-2000’s 1-in-20 year drought (≤ -3 PDSI, severe drought) will occur every other year on average in 2021-2050 (50% of the time).
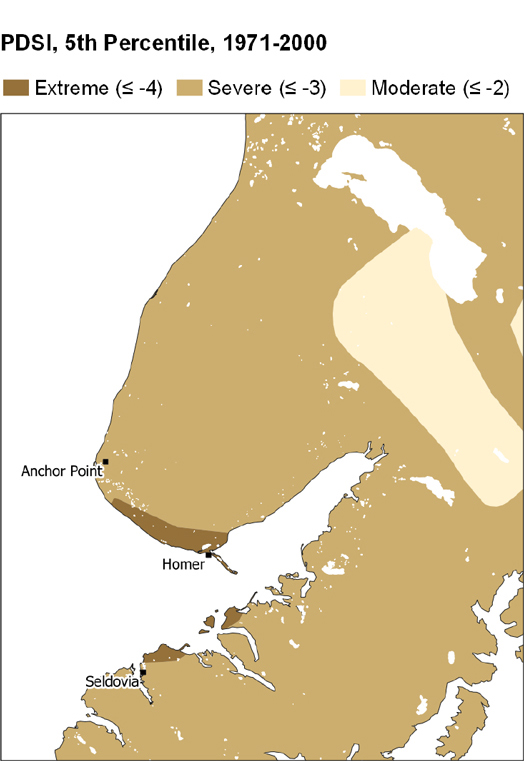
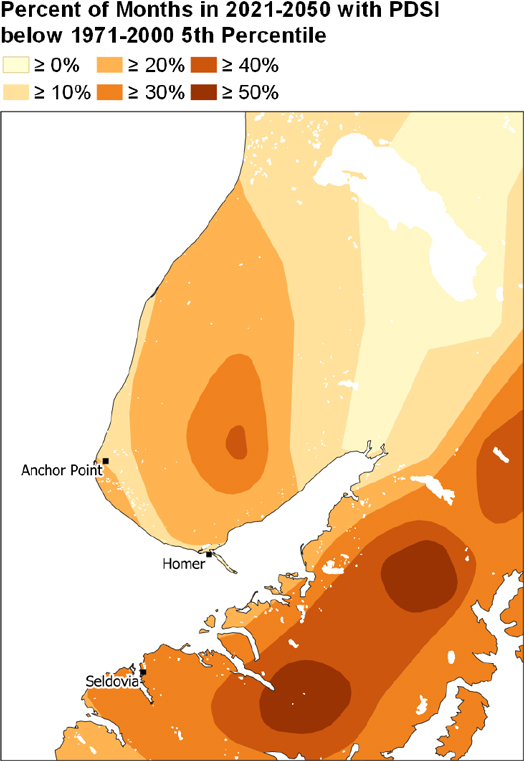
Figure 5: Inundation Map for a 1-in-100 Year Rainfall Event for Present, 2050, and 2080 for Homer, AK
This figure shows the inundation depth in meters for a 1-in-100 year rainfall event for Homer, AK. The Spit has been expanded to show more detail in that area. These plots are for present day (A,D), 2050 (B,E), and 2080 (C,F). By 2080, the increased rainfall leads to greater inundation depths in a few areas, specifically east of Beluga lake.
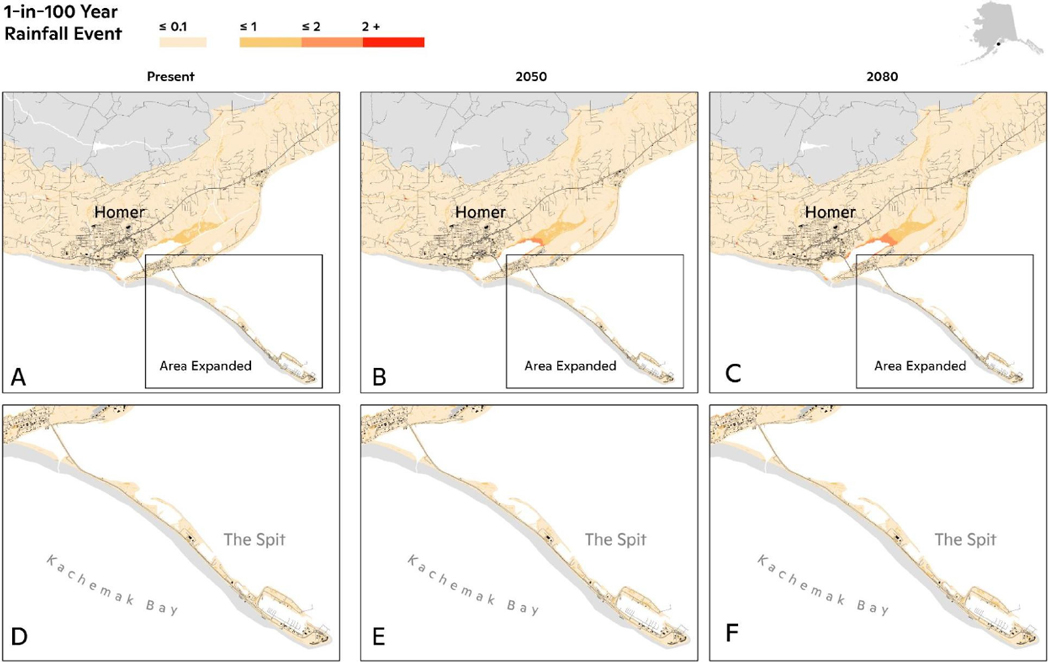
Figure 6: Inundation Map for a 1-in-100 Year Storm Surge Event for Homer, AK
This figure shows the inundation depth for a 1-in-100 year storm surge event for Homer, AK. The Spit has been expanded to show more detail in that area. These plots are for present day (A,D), 2050 (B,E), and 2080 (C,F). Storm surge flood depths drop slightly in 2050 due to isostatic rebound and then increase again by 2080.
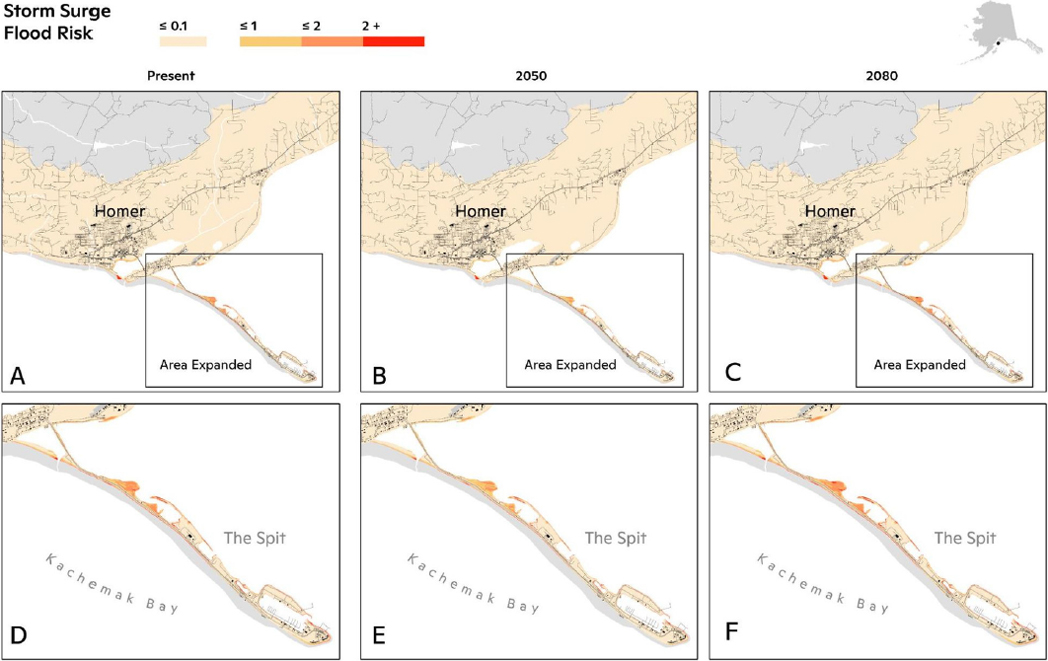
Figure 7: Inundation Map for a 1-in-100 Year Rainfall Event for Present, 2050, and 2080 for Seldovia, AK
This figure shows the flood depth of the 1-in-100 year rainfall event for Seldovia, AK. Flooding is largely limited to wetlands even as the rainfall amounts increase through 2050 and 2080.
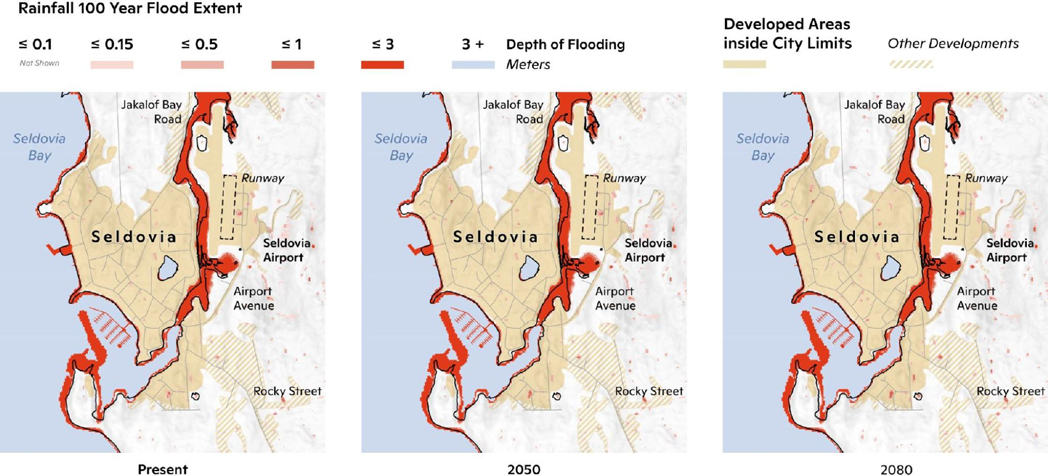
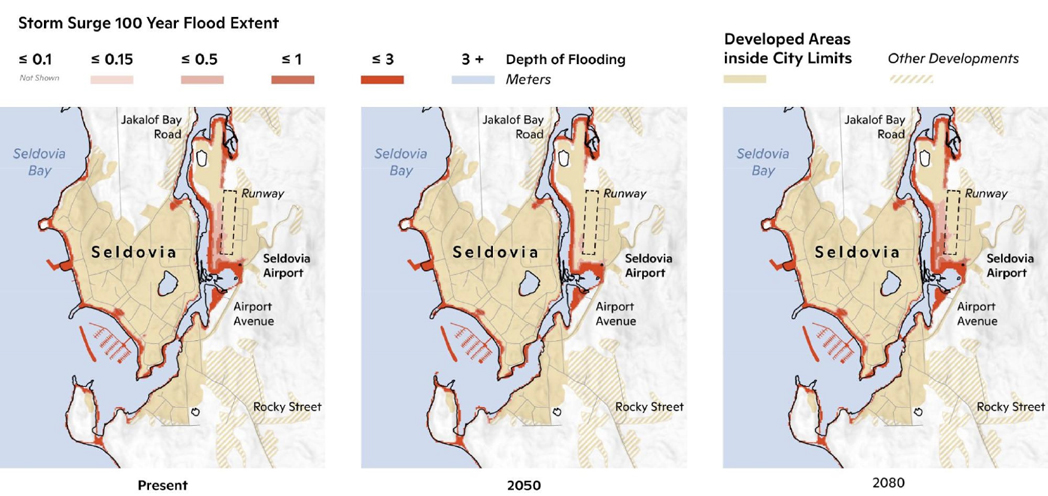
Figure 8: Inundation map for a 1-in-100 year storm surge event for Seldovia, AK
This figure shows the flood depth of the 1-in-100 year storm surge event for Seldovia, AK. The area with the greatest risk is the airport; however, the runway is the only infrastructure impacted given that the airport structures are located further inland. The storm surge heights decrease slightly from present day to 2050 due to isostatic rebound, but then increase slightly by 2080.
Results Summary
Rainfall and Storm Surge
The amount of inundation from a 1-in-100 year rainfall event in Homer, AK will increase from present day to 2080, particularly east of Beluga Lake due to increased precipitation. Most flooding is limited to near the river banks and on the east side of the lake. The Spit only observes minimal flooding (less than 0.1 meters, equivalent to approximately 4 inches) in any of the time periods shown. The inundation risk from storm surge for a 1-in-100 year event in Homer, AK is almost entirely limited to the Spit. The amount of flooding from storm surge slightly decreases by 2050, due to isostatic rebound (the still ongoing rise of land after removal of ice sheets from the last glacial period), and then increases again by 2080. The largest inundation, which is over 2 meters (6.5ft+), is about halfway down the Spit. The picture is similar for Seldovia, AK. The inundation from a 1-in-100 year rainfall event is largely limited to the wetlands along the Seldovia Slough and Lagoon. As the rainfall increases into the future, the inundation remains mostly limited to the wetland regions. The inundation from a 1-in-100 year storm surge event in present day and 2080 has the highest risk to the airport. Since most of the airport infrastructure is further inland, the runway would be at the greatest risk. Similarly to Homer, isostatic rebound will lead to slight decreases in inundation risk in 2050.