Climate risk assessment: Itahari, Nepal
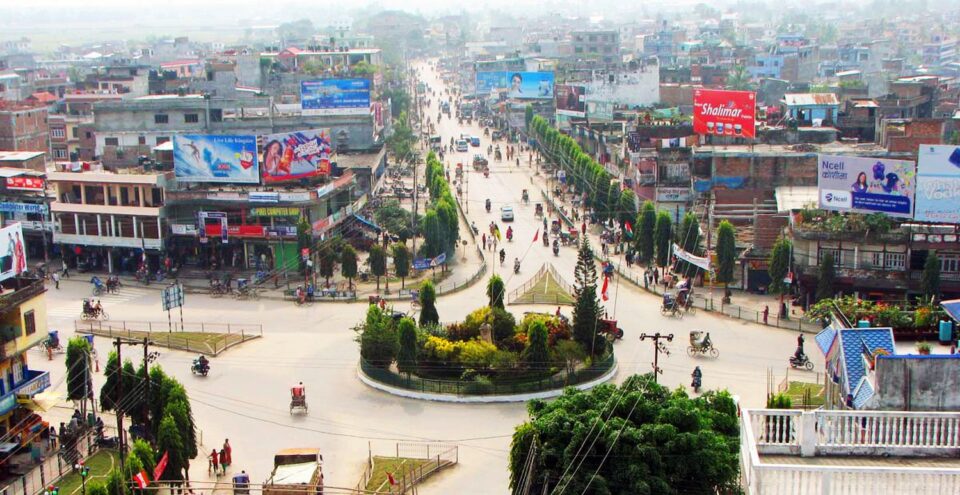
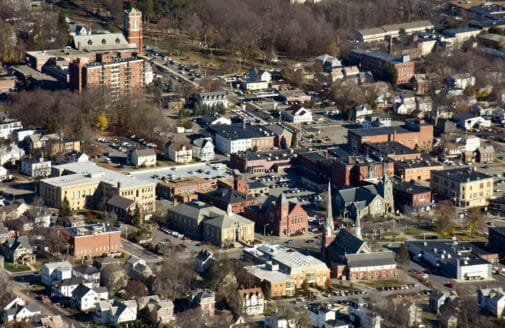
Itahari, also known as “Eastern Heart”
photo by Er.Naresh Chaudhary (CC BY-SA 4.0)
Background
The impacts of climate change on the frequency and severity of physical hazards are putting many communities at risk. As the threat of climate change grows, so too does the need for accessible information, tools, and expertise to support climate-resilient decision making for municipalities. Woodwell Climate Research Center (“Woodwell”) believes there is a need to localize and customize climate risk assessments. This information is critical for local government leaders as they make planning decisions, but it is not available to all communities. Woodwell believes that the science should be freely and widely available. To address this gap, Woodwell works with communities across the world, including Itahari, Nepal, to provide municipal climate assessments, free of charge. Leaders in Province One chose to focus on flooding in Itahari due to its economic importance as an industrial center and its proximity to the Budhi Khola. Nepal has the 14th highest percentage of people at risk of flooding, 29%, of which 71% live on less than $5.50 per day (Rentschler, Salhab, and Jafino, 2022) In addition to this report, Woodwell also partnered with Tribhuvan University to host climate modeling workshops for students and interested professionals.
Introduction
As a result of climate change, flood risk in Itahari, Nepal is projected to increase. The total rain expected to fall during a 100-year rainfall event, a useful indicator of flood risk, is expected to more than double by the end of the century. The result will be deeper floods in Itahari and the nearby Budhi Khola river basin. Land loss from flooding is of extreme concern in this area. Land is seen as critical to a family’s economic, policial, and social security (IOM, 2016) yet many families’ homes near the Budhi Khola are at risk from extreme flooding. Negative impacts associated with flooding hazards will be disproportionately felt by the poor (Rentschler, Salhab, and Jafino, 2022). Here we present our findings on flooding to help Itahari, Nepal create a more resilient future.
Results
The following flood maps will focus on 1-in-100 year events for three different time periods. Present, which is based on the observational rainfall data that was provided from 1970–2021, 2041–2060, and 2071–2090. This means there is a 1% chance of a flood of this magnitude happening in a given year. The 1% chance is calculated every year without consideration of what happened in the previous years; for example, 99 years without the event does not guarantee it will happen this year. The 1-in-100 year flood event is chosen because it is a typical threshold for a runoff related extreme flood in Napalese flooding studies (Gurung et al., 2021; Basnet and Acharya 2019).
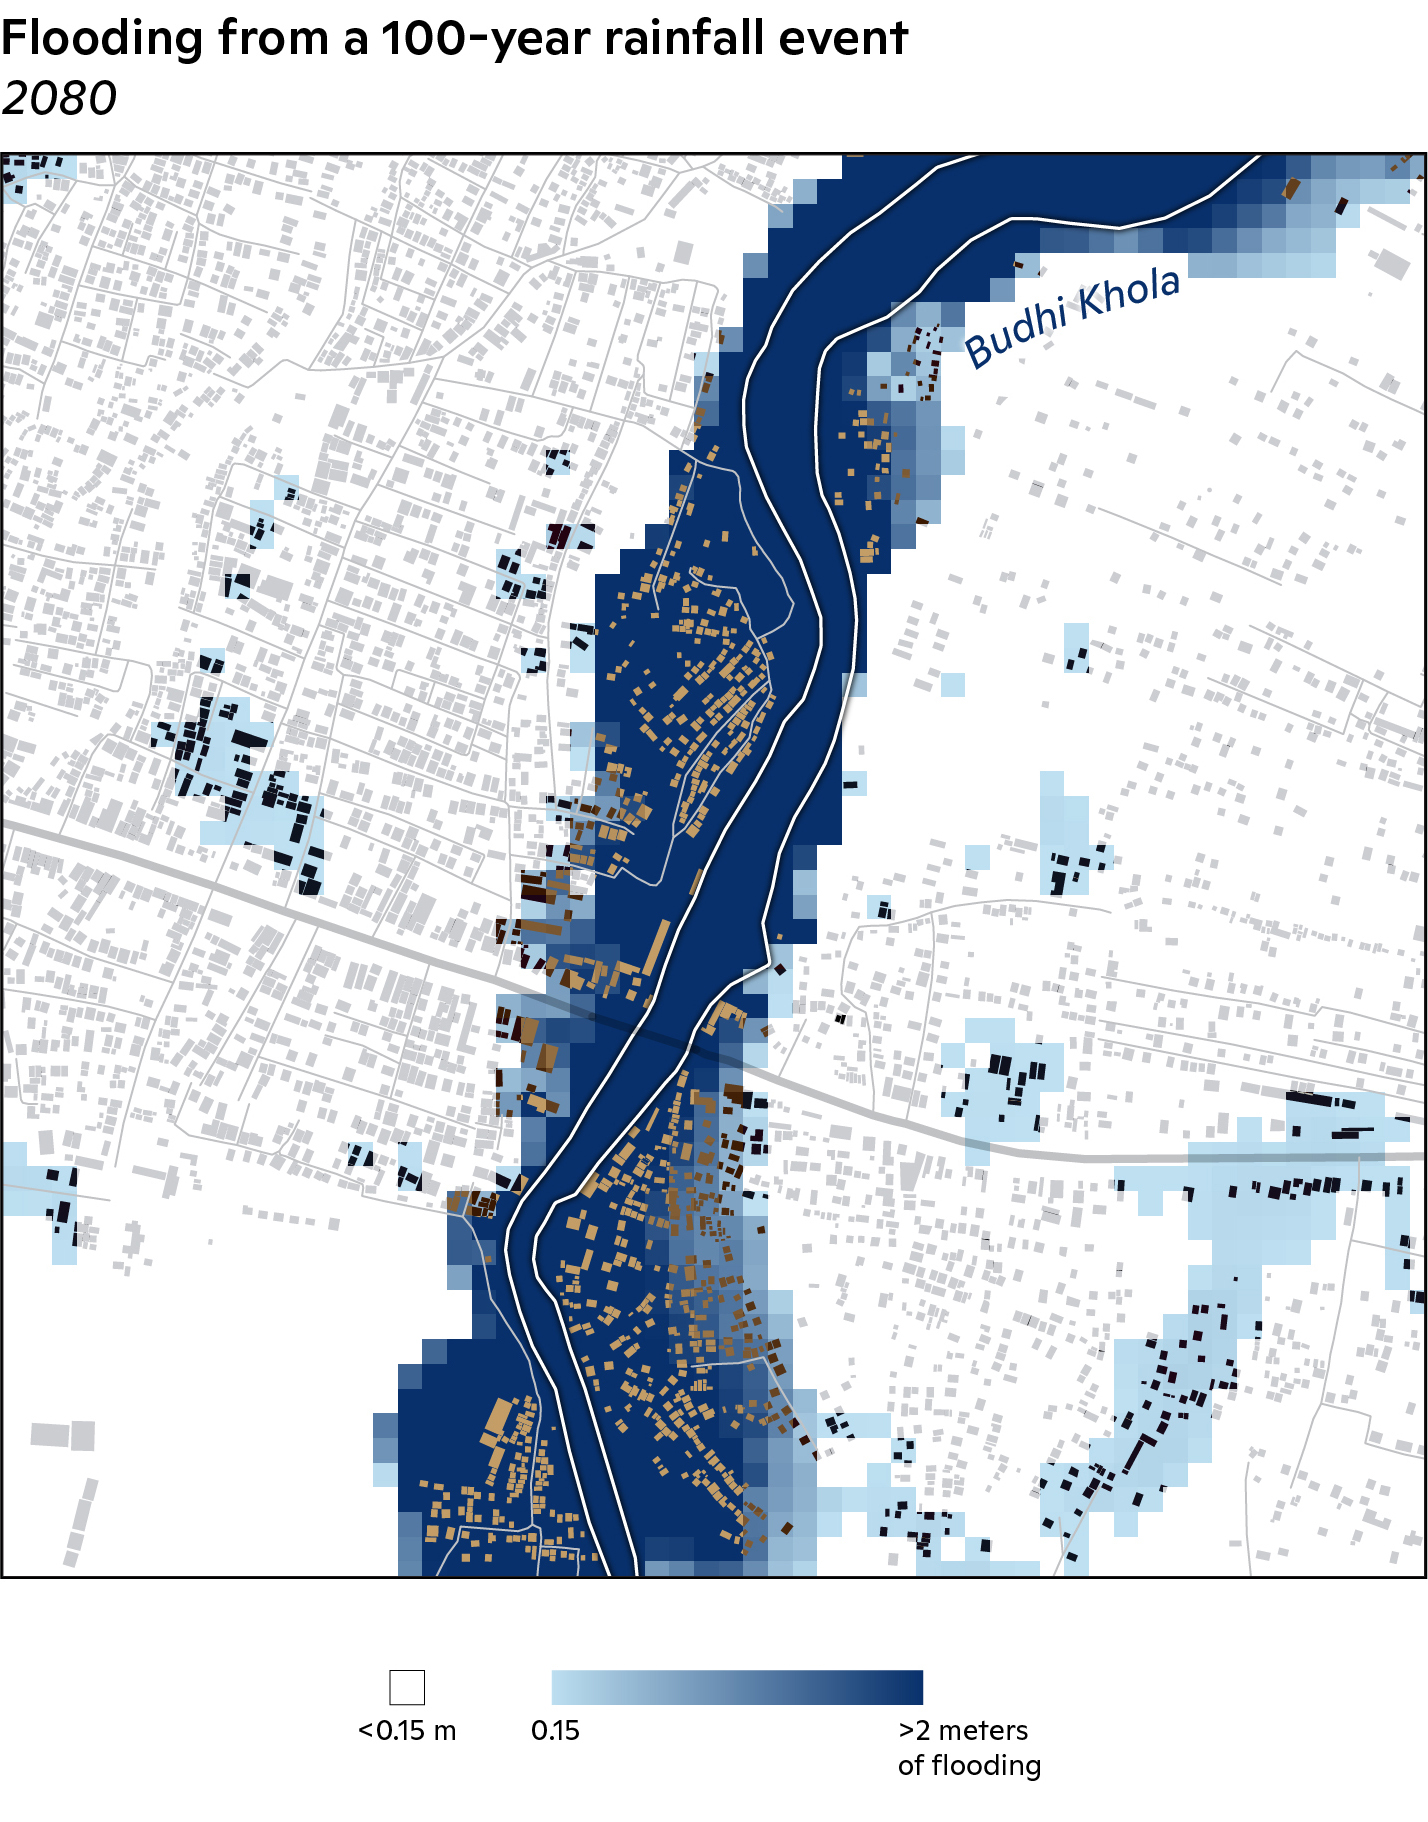
Presented here are the flooding inundation maps for a 1-in-100 year rainfall event for Itahari, Nepal for present time (Figure 1 left), 2041–2060 (Figure 1 center), and 2071–2090 (Figure 1 right). Figure 1 shows that during a present 1-in-100 year rainfall event a substantial amount of flooding (>1m) can occur north of highway H01 and west of highway H08. North and south of this area can experience around 0.5m of inundation in the present time period (Figure 1 left). The Budhi Khola river also expands out along the bank.
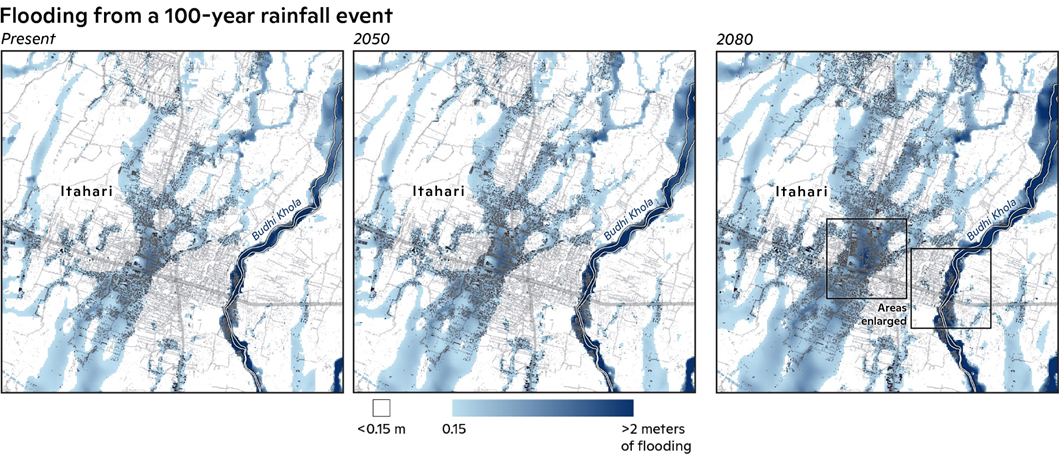
Figure 1: Flood inundation map for a 1-in-100 year rainfall event in present, 2041–2060, and 2071–2090. The colorbar starts at 0.15 m as that is enough to cause building damage. The 2080 map has two boxes that are enlarged in Figure 2. Full size maps can be found in Annex II.
Looking forward, the locations of the flood areas are relatively similar in the present (Figure 1 left), 2050 (2041–2060) (Figure 1 center), and 2080 (2071–2090) (Figure 1 right). The effects of climate change on flooding are primarily seen in the change in the depth of the floods during an extreme rainfall event. By 2080 (Figure 1 right), the area between the highways is close to 2m of inundation while the river continues to expand out of its banks threatening the structures that are close to it. The right side of Figure 2 highlights individual buildings that would be inundated during a 1-in-100 year flood event in 2080. A substantial number of buildings along the Budhi Khola would be flooded, indicating a major threat to the livelihoods of those living near the river. Some buildings included in the flood inundation (Figure 2 left) are residential homes, schools, government facilities, restaurants, doctor offices, and businesses. Along the Budhi Khola river (Figure 2 right), the story is similar with several Hindu temples and grocery stores also at risk of high flood inundation. This increase in flood depth is due to the increase in the amount of rain expected to fall during an extreme event. For reference, the present 100 year event is 18.3 centimeters of rainfall in 24 hours. In 2050, this increases to 24.3 centimeters, and by 2080 it increases to 39.4 centimeters.
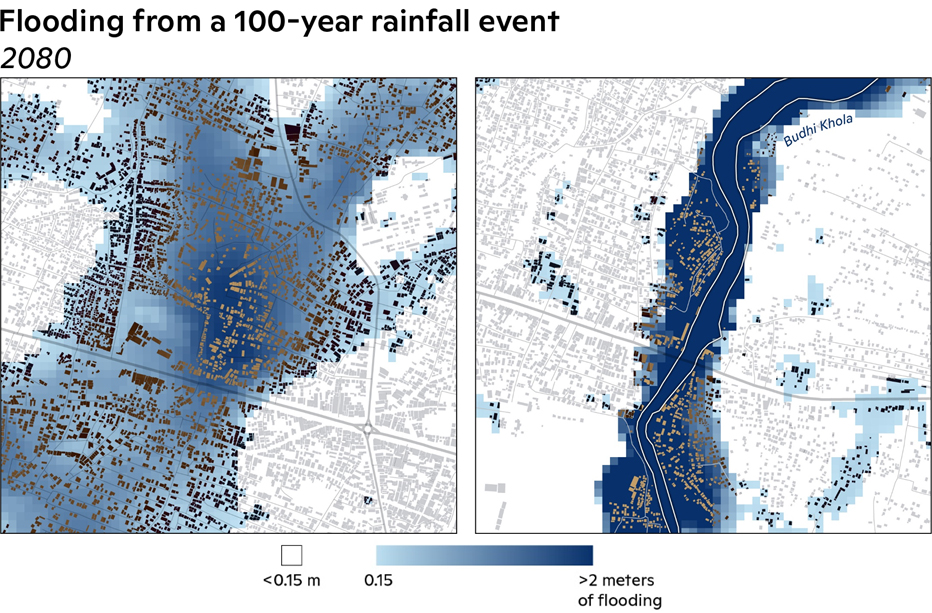
Figure 2: Flood inundation map for a 1-in-100 year rainfall event in 2071–2090 with building polygons included. The left map shows flooding in the center of the city, and the right map shows flooding along the Budhi Khola immediately north and south of the H01 bridge. The colorbar starts at 0.15 m as that is enough to cause building damage. Full size maps can be found in Annex II.
Itahari is already prone to flooding, and more frequent extreme rainfall events means increased flood risk across the city. Increased flooding events will further strain elderly and poorer populations who lack mobility and financial resources to rebound afterwards. There are a wide variety of available technical solutions that could help alleviate some of the flood risk, such as levees, pumps, and permeable greenspace, as well as advanced warning and evacuation measures will help alleviate some of these burdens for the more vulnerable populations of Itahari. It will take a wide coalition of stakeholders to find the appropriate mix of solutions to address Itahari’s flooding risk.
Annex I: Technical Methodology
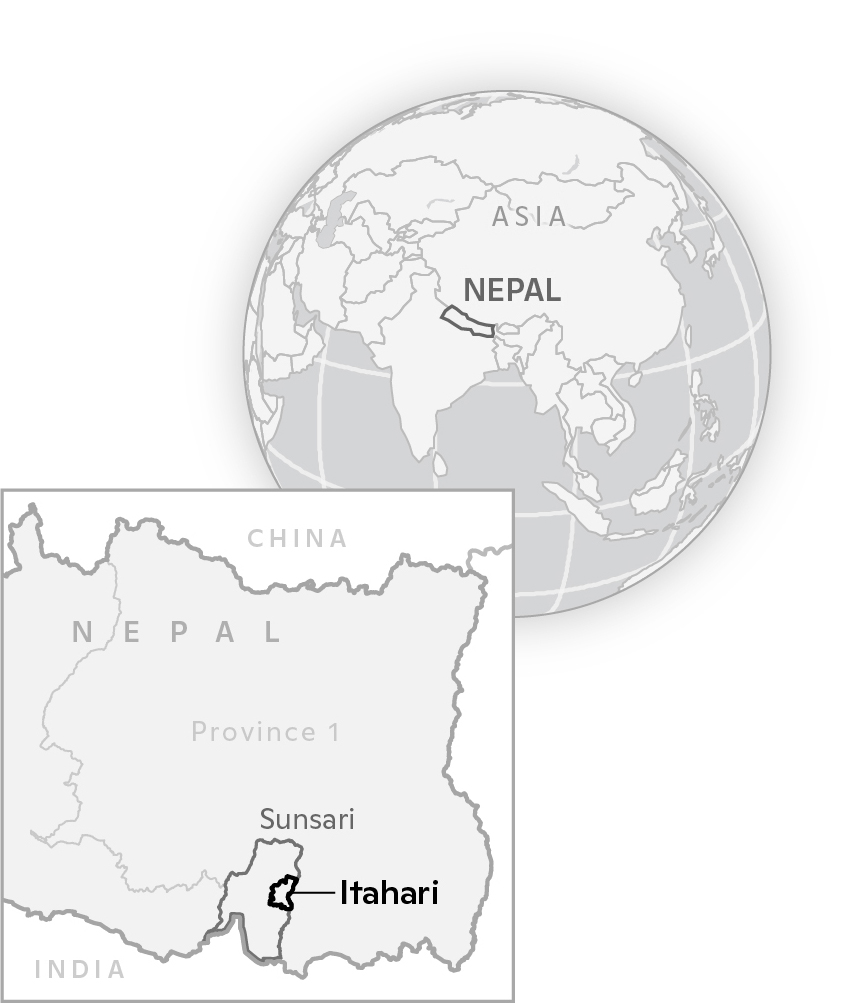
For this climate analysis, we focused on the Terai region of Nepal. We worked with our partners University of Queensland, leaders from Province One, and scientists from Tribhuvan University to identify towns near major rivers that would be mostly likely to experience flooding. Leaders in Province One choose to focus on Itahari due to its economic importance as an industrial center and its proximity to the Budhi Khola.
Present and future flood risk in Itahari is estimated using the LISFLOOD-FP flood model version 5.9 (Bates et al., 2000; Neal et al., 2018; Hoch et al., 2019; Hoch and Eilander, 2018). LISFLOOD-FP, a leading tool in flood risk analysis, has been extensively used across multiple geographies and applications, e.g., in early flood warnings in Juba-Shabelle river basin of East Africa (Thiemig et al., 2010), in validating localized flood studies across the continental United States (Neil et al., 2012; Coulthard et al., 2013; Wing et al., 2017)1, and in modeling inundation extent of Amazonian wetlands (Wilson et al., 2007)2. We modified LISFLOOD-FP to allow for a spatially changing infiltration rate as opposed to a constant value for the entire domain. Overall, LISFLOOD-FP was chosen to model flood risk for Itahari due to its computational efficiency at high spatial resolutions, its ability to accurately estimate flood risk across spatial scales and its easily modifiable open source code book.
Itahari is vulnerable to both fluvial (river) and pluvial (surface) flooding. The limited data on streamflow of the Budhi Khola implied very little flow, so for these simulations, the streamflow of the river was not included. Even with this exclusion, the flood results show extreme fluvial flooding (>2m) along the Budhi Khola river basin indicating that a storm system moving through the Itahari watershed would result in fluvial and pluvial flooding.
Several inputs are required to run the model which are described in detail below:
1) ELAVATION DATA
The elevation data used for Itahari is from the Forest and Buildings removed Copernicus Digital Elevation Model (FABDEM), which has 30-meter horizontal resolution. It was created by removing the buildings and tree heights from the Copernicus GLO 30 Digital Elevation Model (DEM) (Airbus, 2020). Hawker et al., 2022 has further details on FABDEM and the entire dataset can be found at
https://data.bris.ac.uk/data/dataset/25wfy0f9ukoge2gs7a5mqpq2j7.
2) RAINFALL
a. Present rainfall | Daily rainfall data for 1970–2021 in Tarahara was provided by Nepal’s Department of Hydrology and Meteorology. The annual maximum rainfall was taken for each year from the daily values. This was used to calculate the 1-in-100 year event using extreme value distributions.
b. Future rainfall | There are two steps to calculate the future rainfall amounts from the 100-year event. The first is to estimate the change in probability of the 100-year precipitation events in the 2041–2060 and 2071–2090 future periods relative to the historical (1971–2000) baseline. Our calculation uses the change from future period to historical–rather than historical to future–so that rainfall amount can be estimated for future 100-year events. We use SSP585 (Shared Socioeconomic Pathway), a fossil fuel intensive pathway and update of RCP8.5, which closely matches historical carbon dioxide emissions (Schwalm et al., 2020). CMIP6 climate simulation data used has been bias-adjusted and downscaled to 0.5-degree resolution based on Inter-Sectoral Impact Model Intercomparison Project (ISIMIP) version 2.5 methodology (ISIMIP3BASD v2.5) (Lange 2019; Lange 2021). A regional frequency analysis method was used to fit a generalized extreme value (GEV) distribution by the method of L-moments to the full model ensemble output using the Bukovsky regions (Hosking et al., 2005; Bukovsky, 2011). The second step is to assign a rainfall amount to the change in probability. The future percentile value for the pixel containing the Itahari watershed for the historical (1971-2000) 100-year precipitation event was then assigned a precipitation amount based on the frequency curve that was computed based on the two months of hourly precipitation that was provided. While precipitation biases may exist in the raw model output, assessing the extreme rainfall probability change through a percentile-based method and then assigning a precipitation amount based on the observational record should reduce the impact of those biases on estimated changes in future extreme precipitation. Finally, while there is temporal variation of the rainfall input, the flood model only allows for a spatially constant rainfall rate.
3) FLOODPLAIN FRICTION VALUES OR MANNING’S N VALUES
Each pixel in the model domain was assigned a friction value based on land cover from the National Land Cover Monitoring System (NLCMS) for Nepal. Friction values are important for providing resistance to the water in the model. Water will flow much differently through a dense forest (high Manning n value) compared to an open field (low Manning n value). The most recent available land cover data from 2019 was used for this flood study. The data can be found at https://rds.icimod.org/Home/DataDetail?metadataId=1972729.
4) INFILTRATION RATES
Soil infiltration rates were assigned using the Global Curve Number (GCN) 250 meter resolution dataset. Jaafar et al., 2019 describes the full dataset as well as providing links to download the dataset.
Finally, we note sources of uncertainty in this study that have not been previously mentioned. The first being that the uncertainty in climate model output increases with spatial resolution since climate models are estimating some atmospheric processes that occur at spatial resolutions higher than the model resolution. Within a flood model, there is some uncertainty regarding antecedent moisture conditions as these can impact the ability of soils to infiltrate rainfall and thus flooding. Sensitivity tests regarding antecedent moisture conditions were not completed as part of this study. Additionally, there is uncertainty in pluvial flood estimates in urban areas where stormwater systems are not adequately represented. To accurately account for stormwater systems, data would need to be provided on: 1) Locations and height of outfalls, 2) Location and opening size of catch basins (storm drains), 3) Location, diameter, and invert elevation of manholes, 4) Location, length, diameter, material, and invert elevations of stormwater pipes.
Annex II: Maps
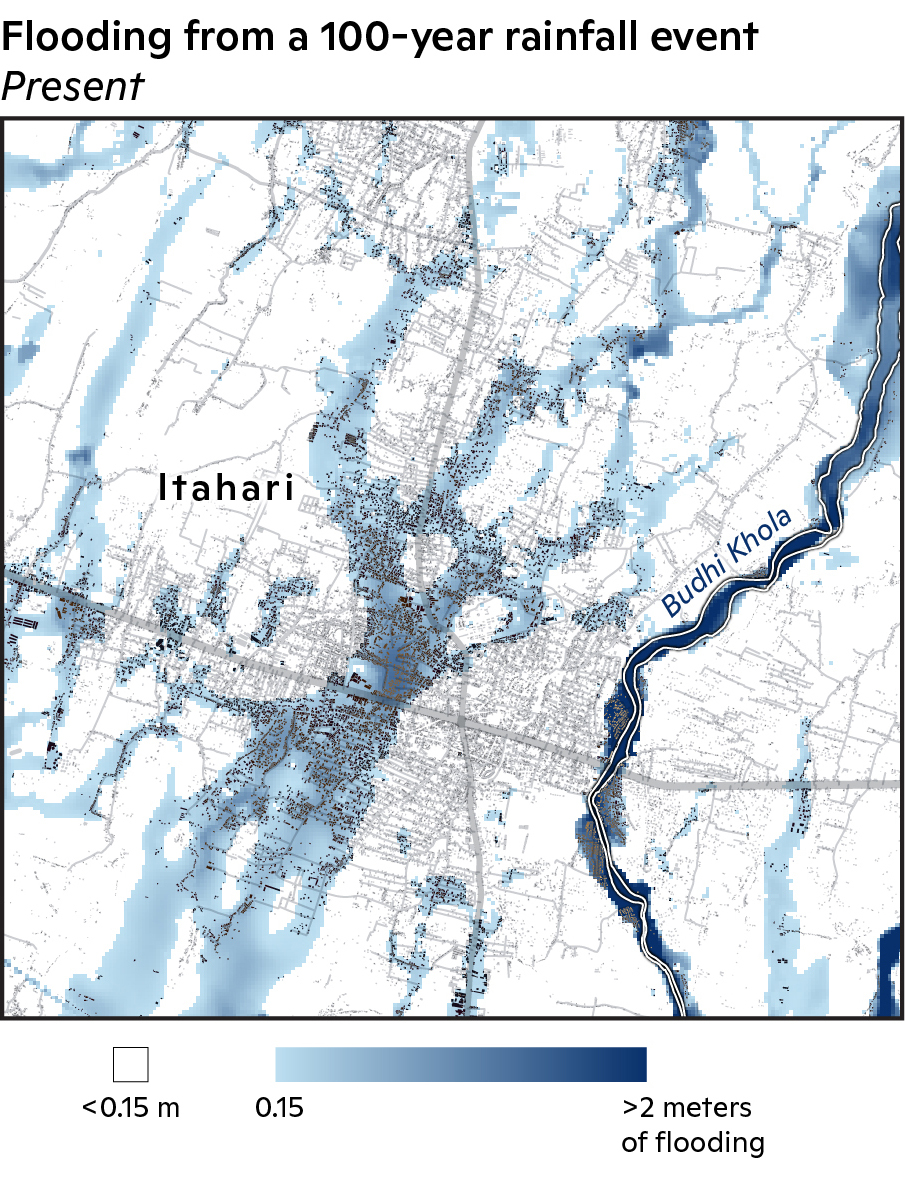
Figure A1: Flood inundation map for a 1-in-100 year rainfall event for Present with building polygons included.
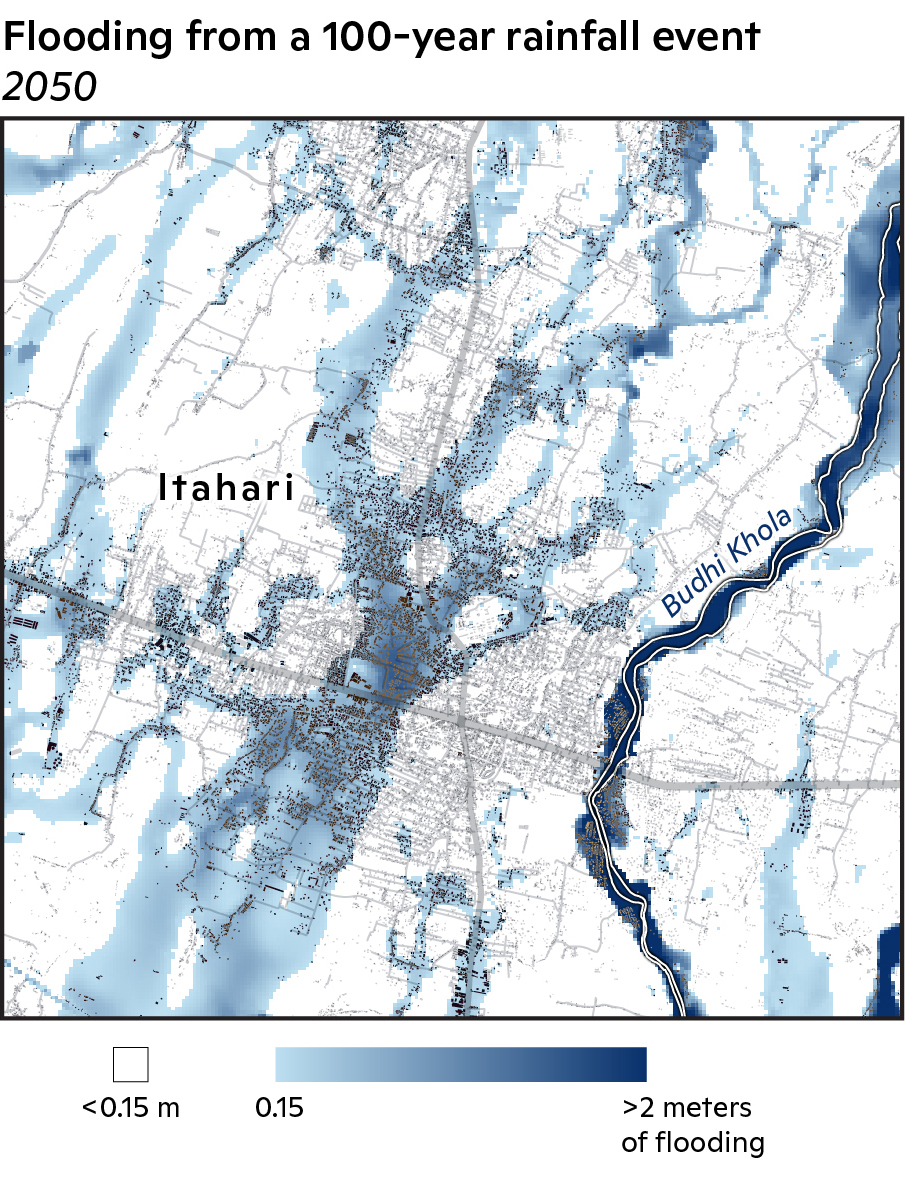
Figure A2: Flood inundation map for a 1-in-100 year rainfall event for 2041–2060 with building polygons included.
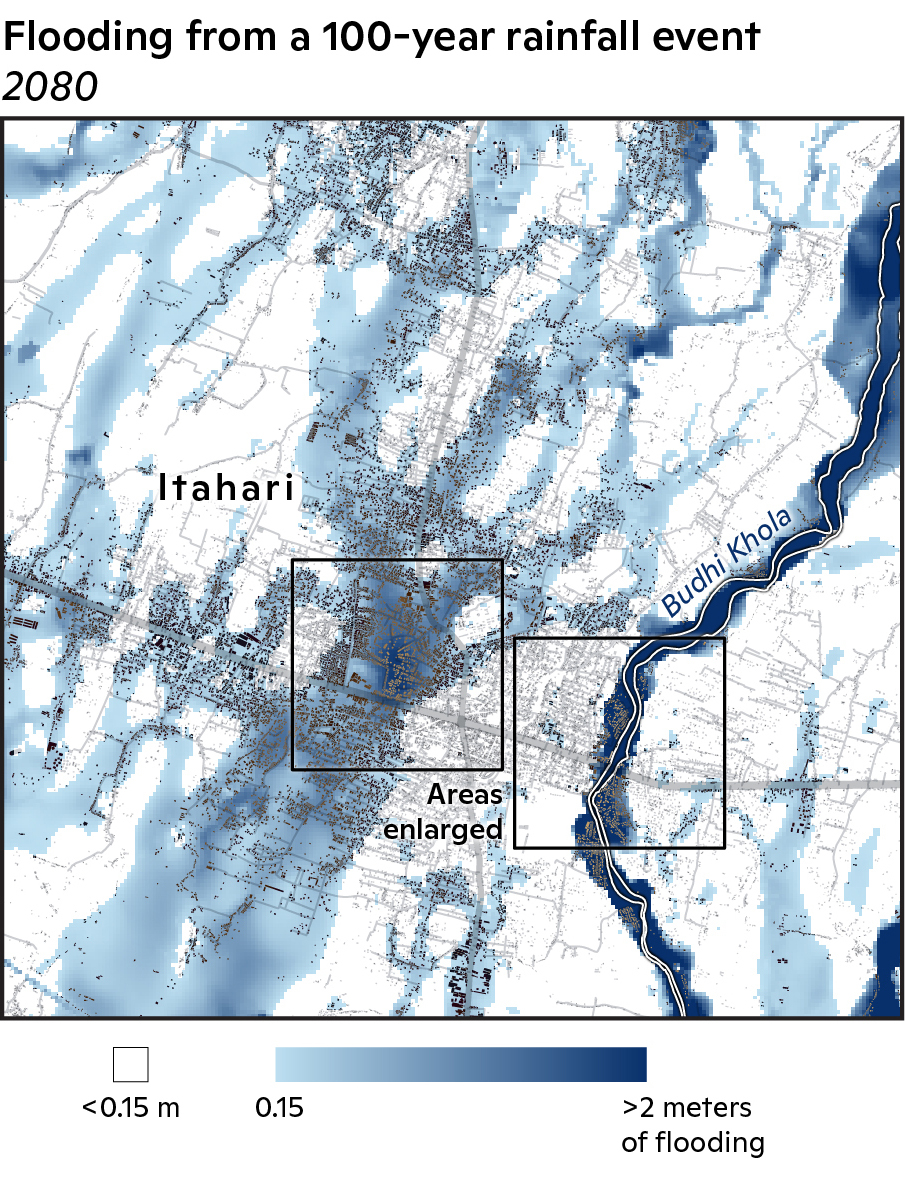
Figure A3: Flood inundation map for a 1-in-100 year rainfall event for 2071–2090 with building polygons included.

Figure A4: Flood inundation map for a 1-in-100 year rainfall event for Present with building polygons included.
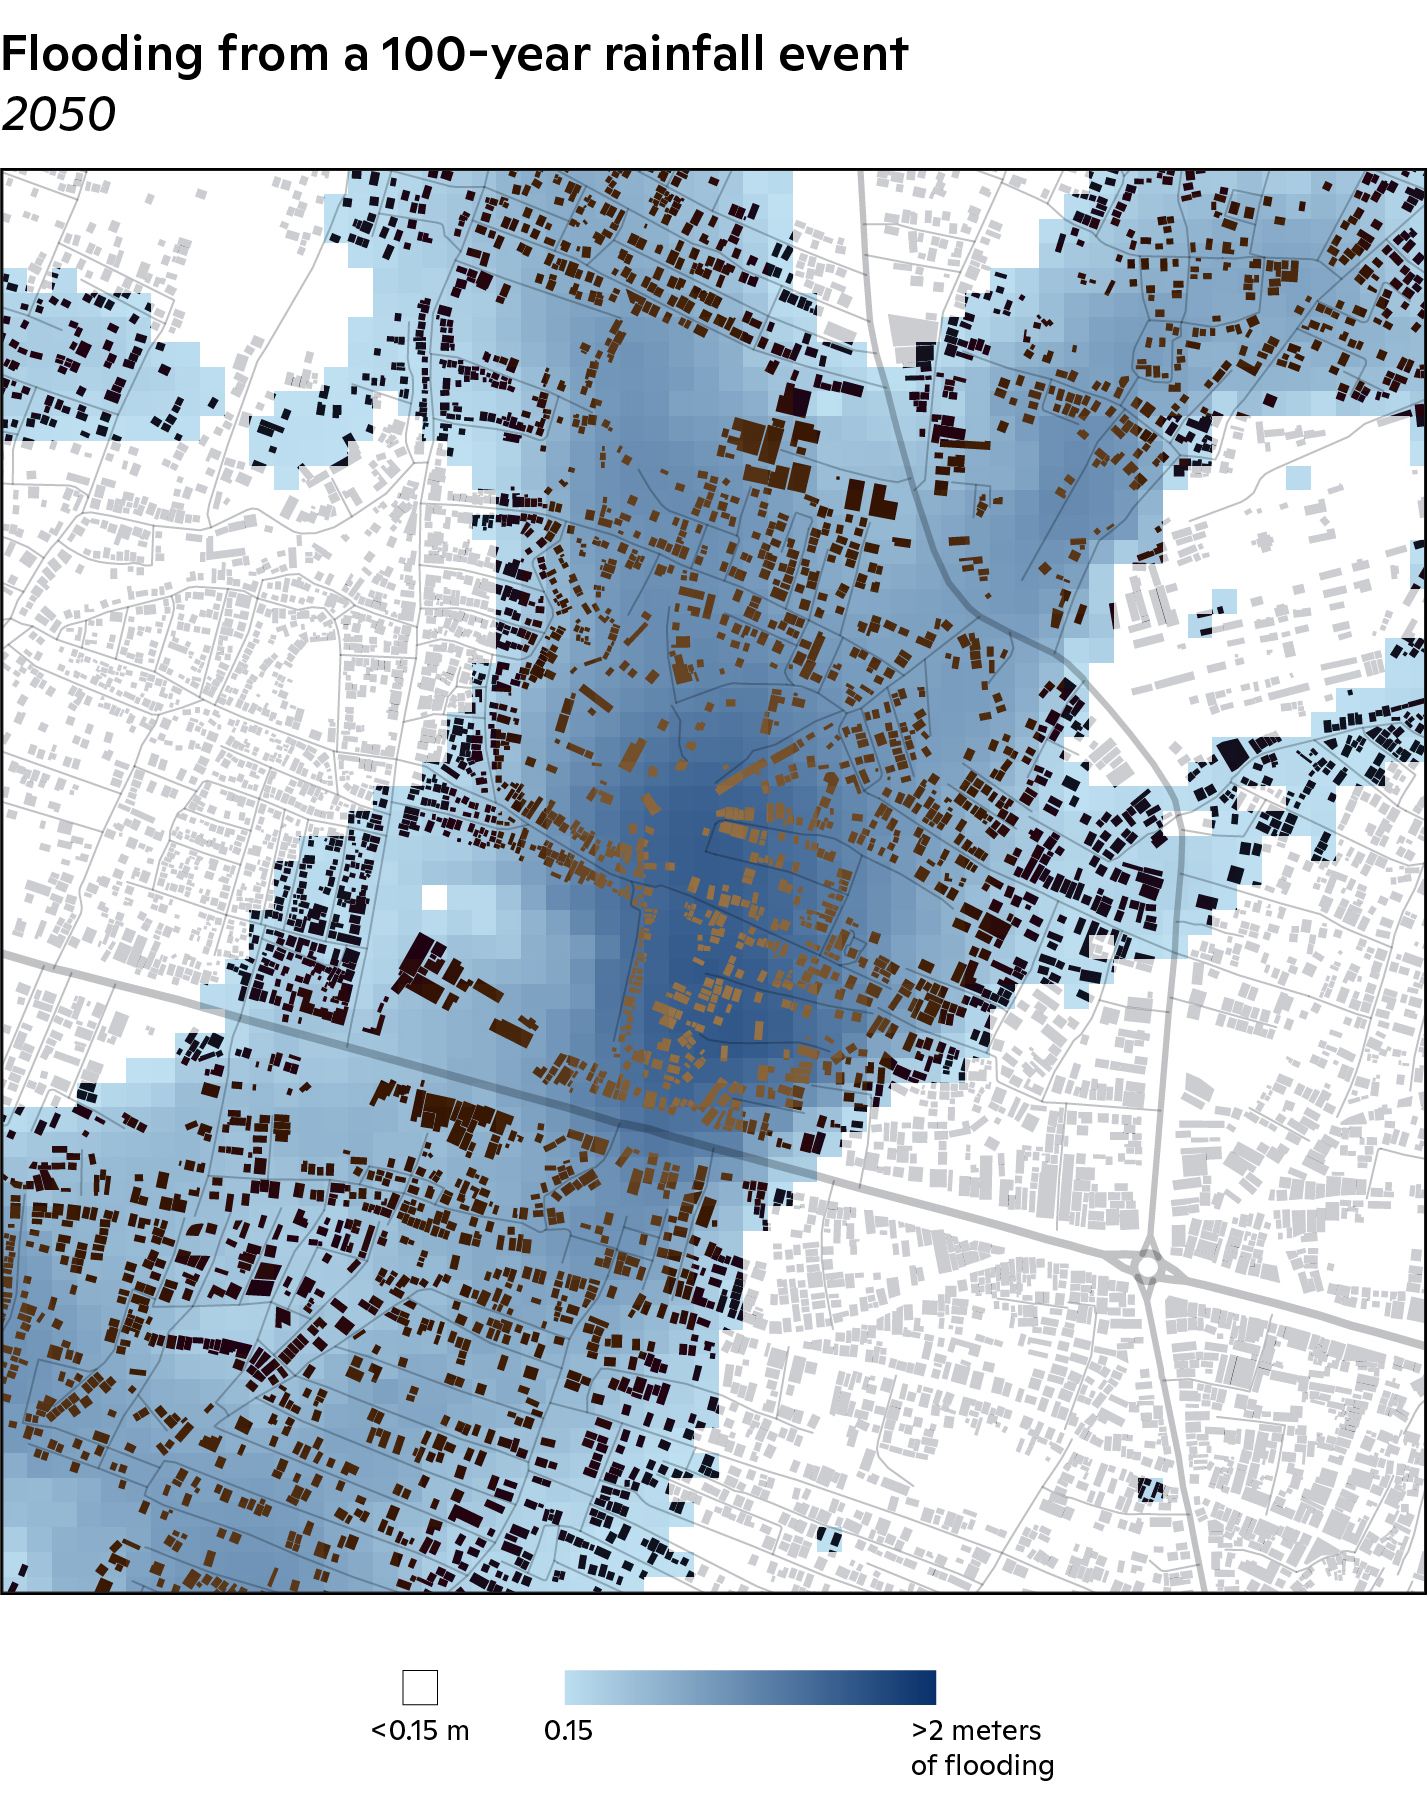
Figure A5: Flood inundation map for a 1-in-100 year rainfall event for 2041–2060 with building polygons included.
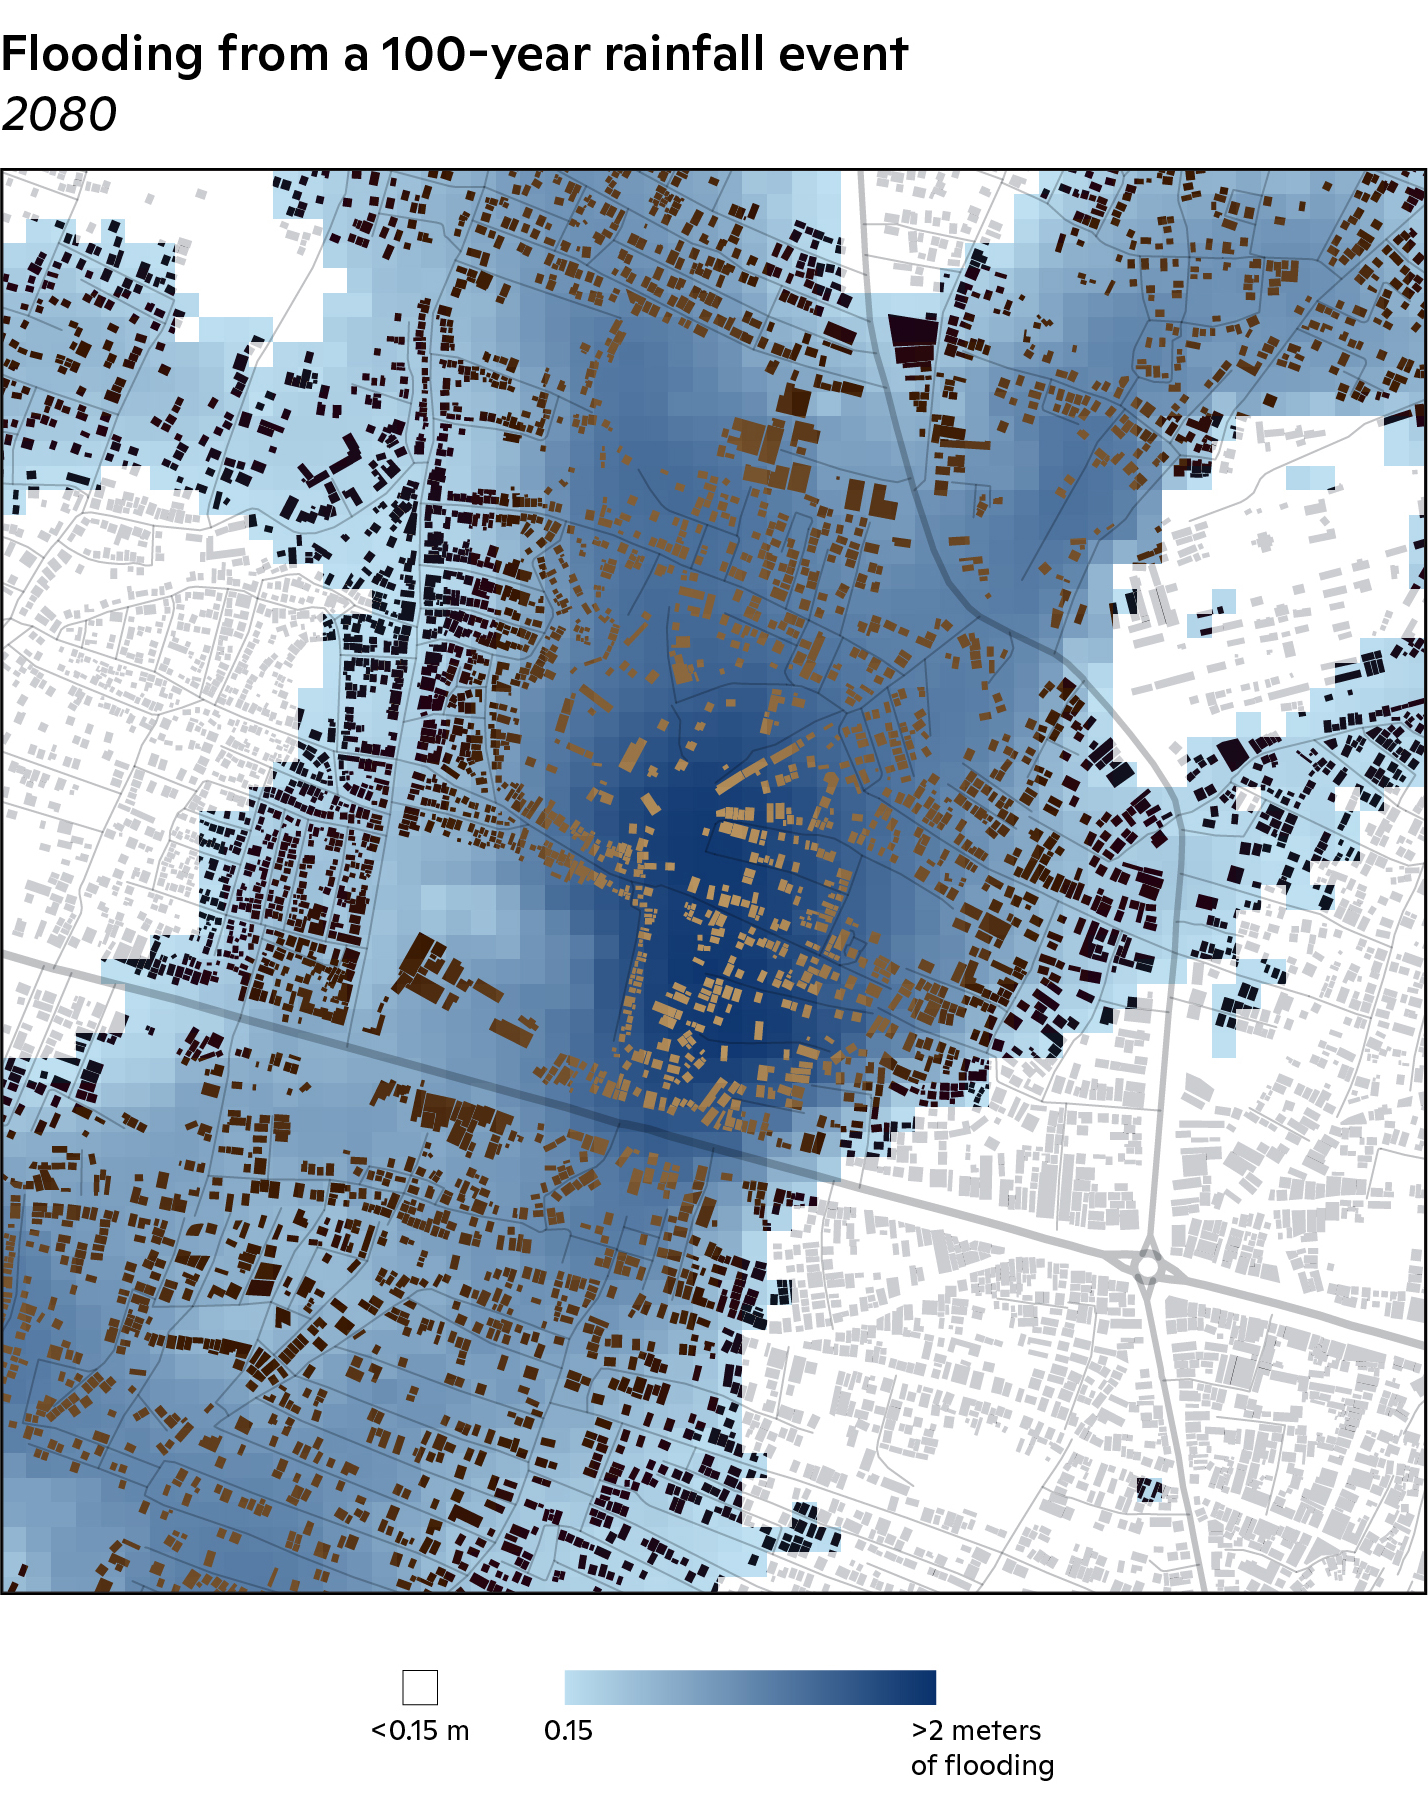
Figure A6: Flood inundation map for a 1-in-100 year rainfall event for 2071–2090 with building polygons included.

Figure A7: Flood inundation map for a 1-in-100 year rainfall event for Present with building polygons included.
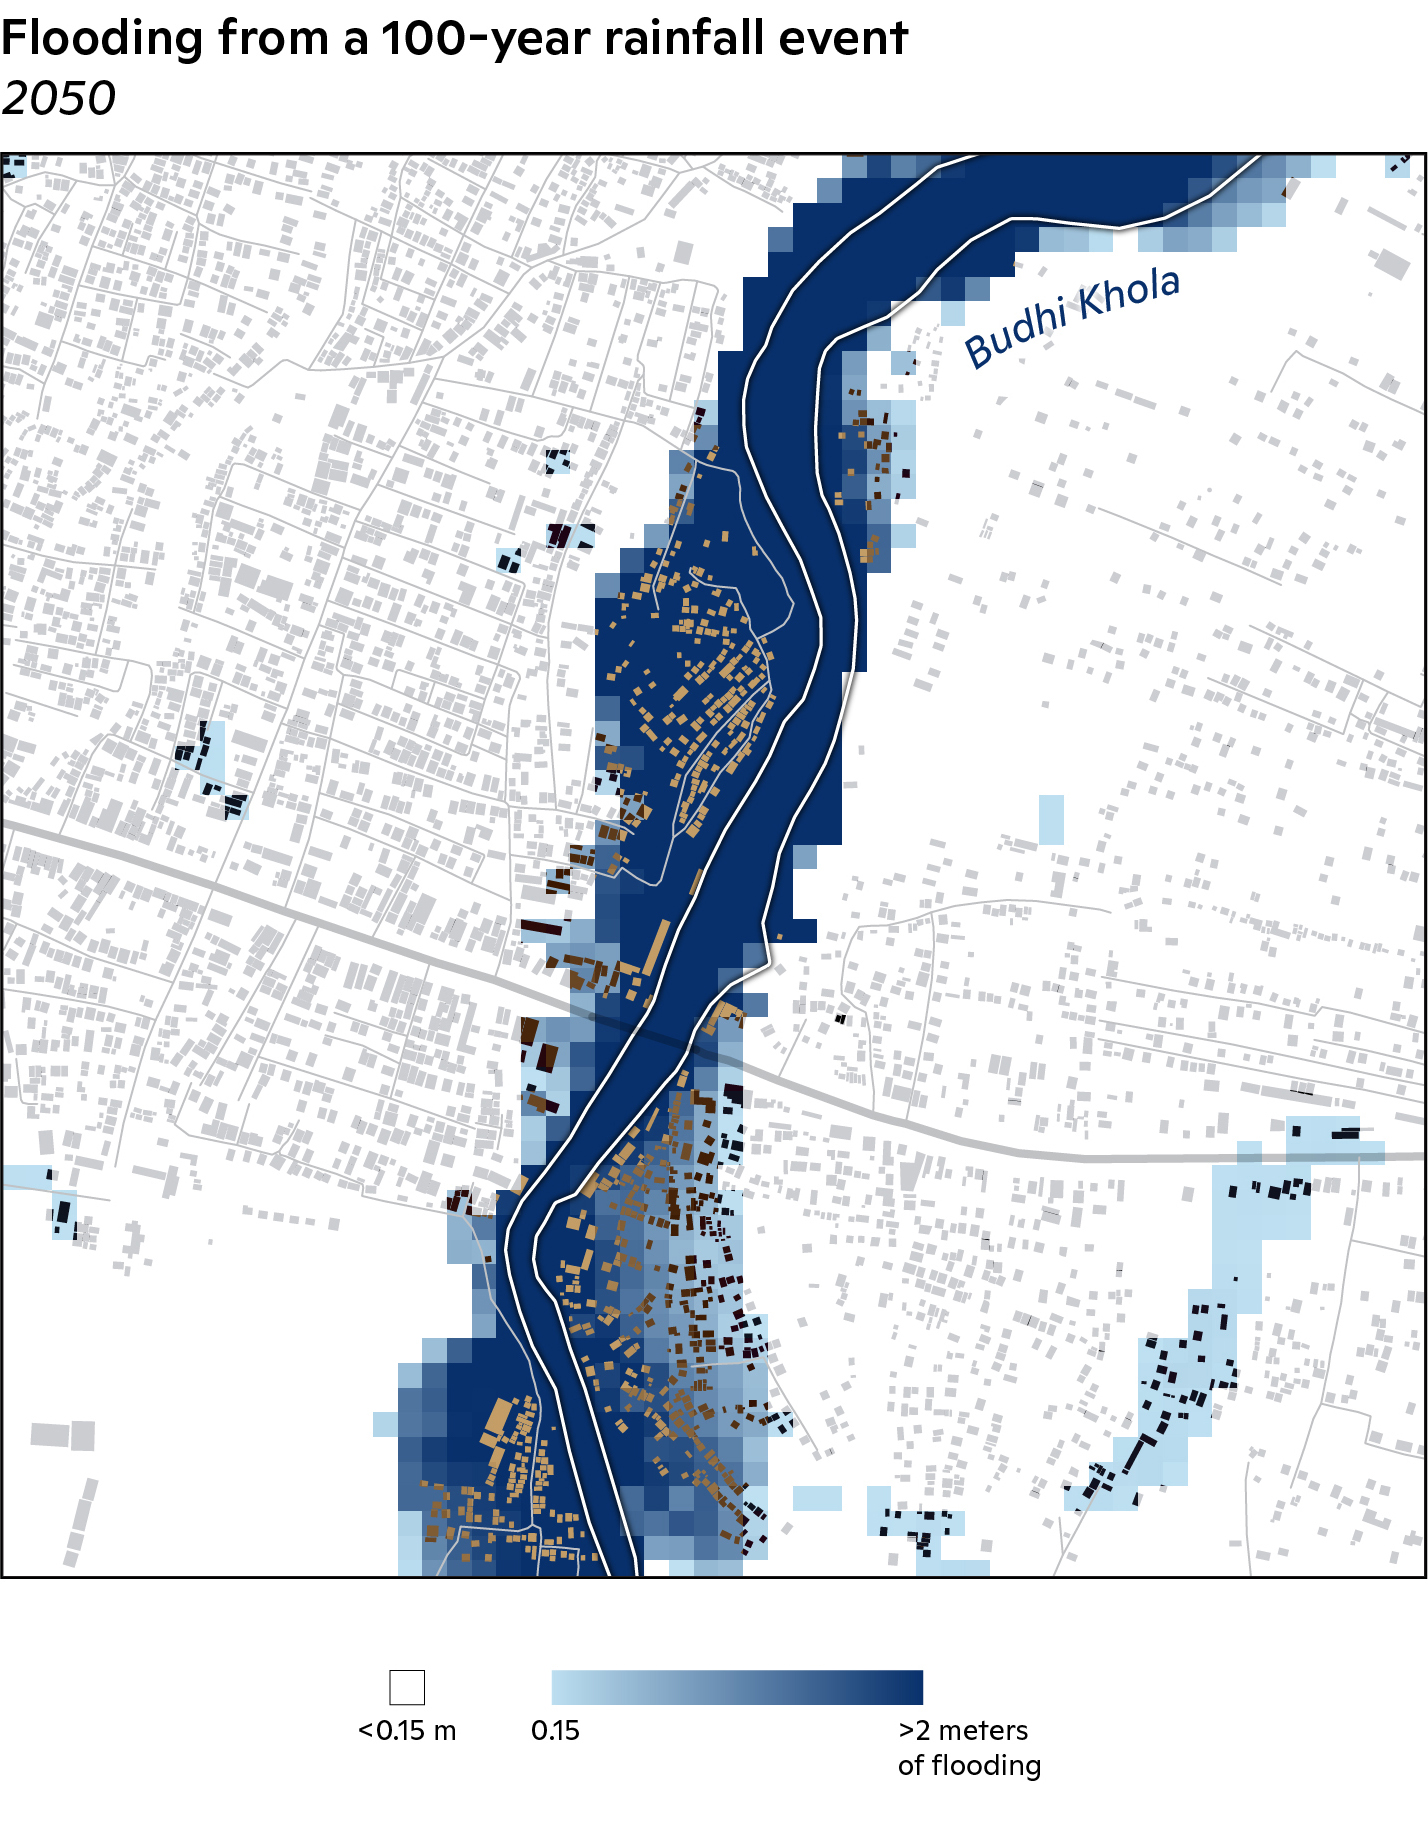
Figure A8: Flood inundation map for a 1-in-100 year rainfall event for 2041–2060 with building polygons included.