Climate risk assessment: Rio Branco, Brazil
Executive summary
- Pollutants in the air we breathe are detrimental to human health. Long-term exposure to air particulate matter in Acre, Brazil, has decreased the average life expectancy by an estimated 2–3 years. Smoke from rural fires is the major source affecting air quality at Rio Branco.
- Observations of fine particulate matter (PM2.5) have become available in Acre through the Purple Air project. Uncorrected data shows that in Rio Branco, an estimated 125 days exceeded the WHO’s daily guidance for PM2.5 levels during the dry season in 2019.
- Satellite observations indicate that rural fires are densely distributed around Rio Branco itself, North Rondônia, as well as northeastern and central Bolivia.
- The source of the smoke arriving at Rio Branco within 6 days comes from nearby areas to the north and east (64% of the time), from the south (31% of the time) or from the east (5% of the time). The average 6-day air parcel spends half of its time inside a radius of just 266 km around Rio Branco.
- Rural fires around Rio Branco are expected to increase due to changes in climate by 38% within 500 km by 2090, under the fossil fuel intensive IPCC scenario. Our analysis also shows that the number of smoke-producing rural fires within two days of wind transport of Rio Branco is expected to increase by a third by 2090. This does not include the effect of increased tree mortality in the region or changes in land cover and land use.
- To improve air quality, fires must be reduced now from their present level.
1. Introduction
The air we all breathe
The air we breathe can have profound and long-lasting impacts on our health. Numerous pollutants, including ozone, nitrogen dioxide, carbon monoxide, sulfur dioxide, and particulate matter, have been identified as potential contributors to a range of health impacts. Among these, of particular concern is the release of particulate matter into the air (PM2.5 and PM10). These microscopic particles can penetrate deep into the body, exacerbating serious conditions such as heart and lung disease, cancer, cognitive problems and susceptibility to COVID-19 (Sakhvidi et al., 2022, Mendy et al., 2021, Zhang et al., 2018, Xing et al., 2016, Kaufman et al., 2016).
A natural way to understand the impact of prolonged exposure to air pollution on public health is to consider its effect on life expectancy. Studies by Chen et al. (2013) and Ebenstein et al. (2017), alongside the University of Chicago AQLI project, have attempted to quantify this impact. Their findings indicate that an increase of 10 µg/m3 in PM10 can reduce life expectancy by 0.64 years, while the corresponding reduction for PM2.5 is 0.98 years. Such long-term effects can exert substantial pressure on healthcare infrastructures, highlighting the importance for authorities to take measures to identify the sources of pollutants and minimize their presence in the air we breathe.
The World Health Organization has established guidelines to assist policymakers in determining safe levels of outdoor air pollution (World Health Organization, 2021). The 2021 guidelines recommend that the annual average concentrations of PM2.5 should not exceed 5 µg/m3, and 24-hour averages should not exceed 15 µg/m3 for more than 3–4 days per year. Unfortunately, most of the world’s population is not living in areas that satisfy these recommendations. Satellite-derived PM2.5 observations from 2020 indicate that these guidelines are exceeded for 97.3% of the world’s population (Greenstone et al., 2022), resulting in an estimated global loss of life expectancy of approximately 2.2 years per person, according to the AQLI dataset. This means that globally, air pollution poses a greater risk to human life than alcohol, firsthand smoking, malaria, or unsafe drinking water.
The introduction of particulate matter into the atmosphere commonly occurs through the combustion of biomass and fossil fuels, i.e., from motor vehicles, industry or rural fires. However, it is not necessary to live in close proximity to a pollutant source to be exposed to dangerous concentration levels. In fact, particulate matter may stay in the atmosphere for anywhere from minutes to weeks, depending on the properties of the particles (Esmen & Corn, 1971), meaning that smaller particulate matter such as PM2.5 can be carried by air currents for potentially hundreds of miles. In the case of high heat accompanying an emission source, such as with rural fires, large plumes can be generated, lifting particles high into the atmosphere and extending their range (Martin et al., 2012). Therefore, when analyzing air pollution risk, one must consider factors such as location, atmospheric flow, meteorological conditions, particle properties, and the source type.
Air pollution is a global issue that is not bound by international borders—the potential range of some pollutants means that air quality is a truly international and transnational issue. It is essential for nations to collaborate in an effort to understand both the sources and transport of pollutants. By working together, countries can take effective measures to safeguard public health for present and future generations.
Rio Branco and Amazonia
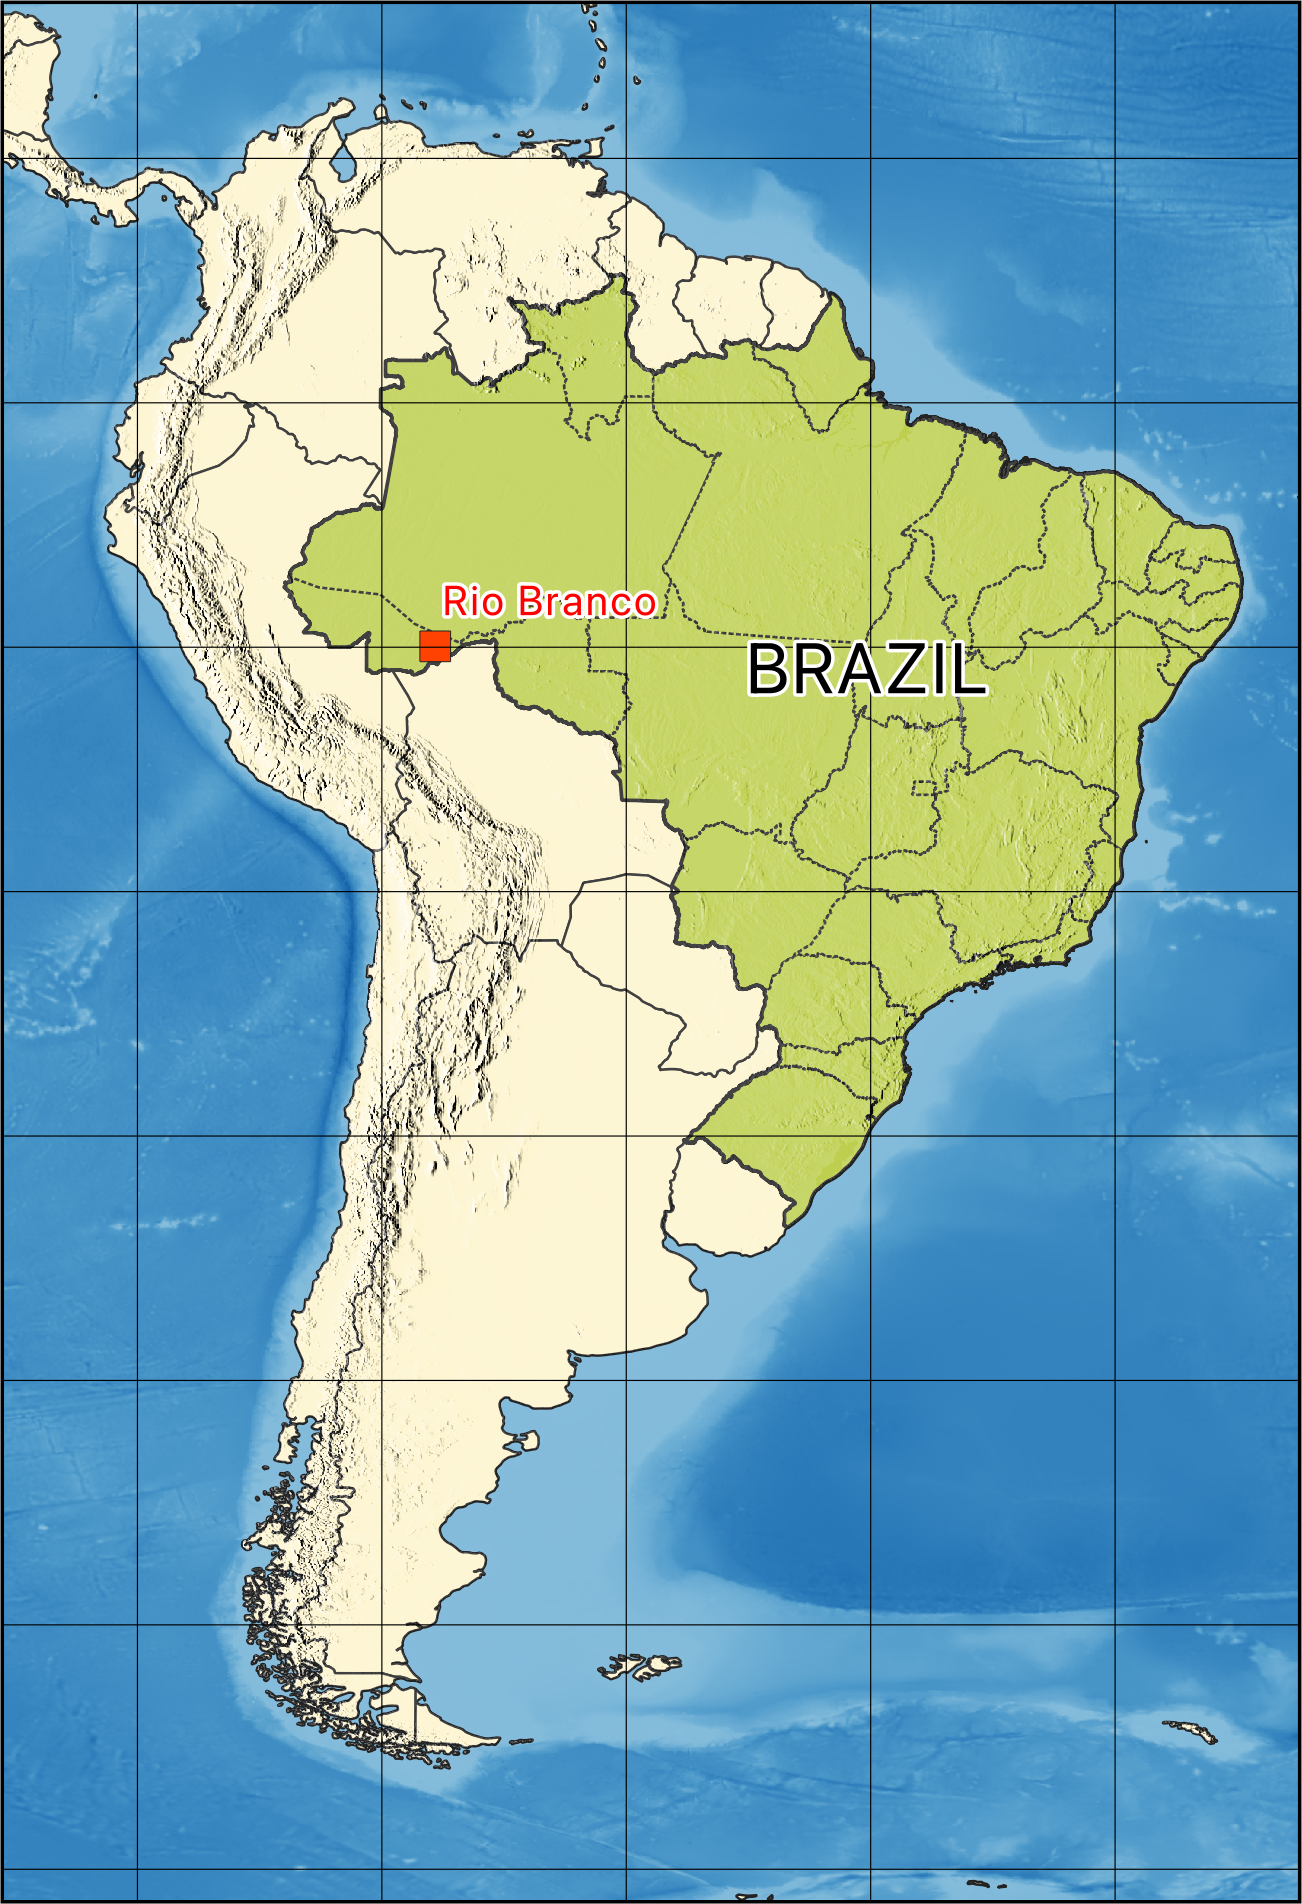
In this study, we assess present observations and make future projections of fire-related air quality for Rio Branco in the Brazilian state of Acre (see Figures 1 and 2). The state of Acre lies in the far west of Brazil, nestled amongst neighboring countries of Peru to the West, Bolivia to the South and the Brazilian states of Amazonas and Rondônia to the North and East. Rio Branco, the capital of Acre and a municipality of approximately 420,000 people, lies in the southeast of the state, less than 50 miles from both the international border with Bolivia and state border with Amazonas. Figure 2 shows land cover types according to the MODIS land cover dataset. Much of the area surrounding Rio Branco is occupied by rainforest (Evergreen Broadleaf Forest), especially to the north and the west. Acre itself is relatively flat and low lying, however the basin is bounded distantly in the west by the Andes Mountains, which controls much of the ground level atmospheric flow.
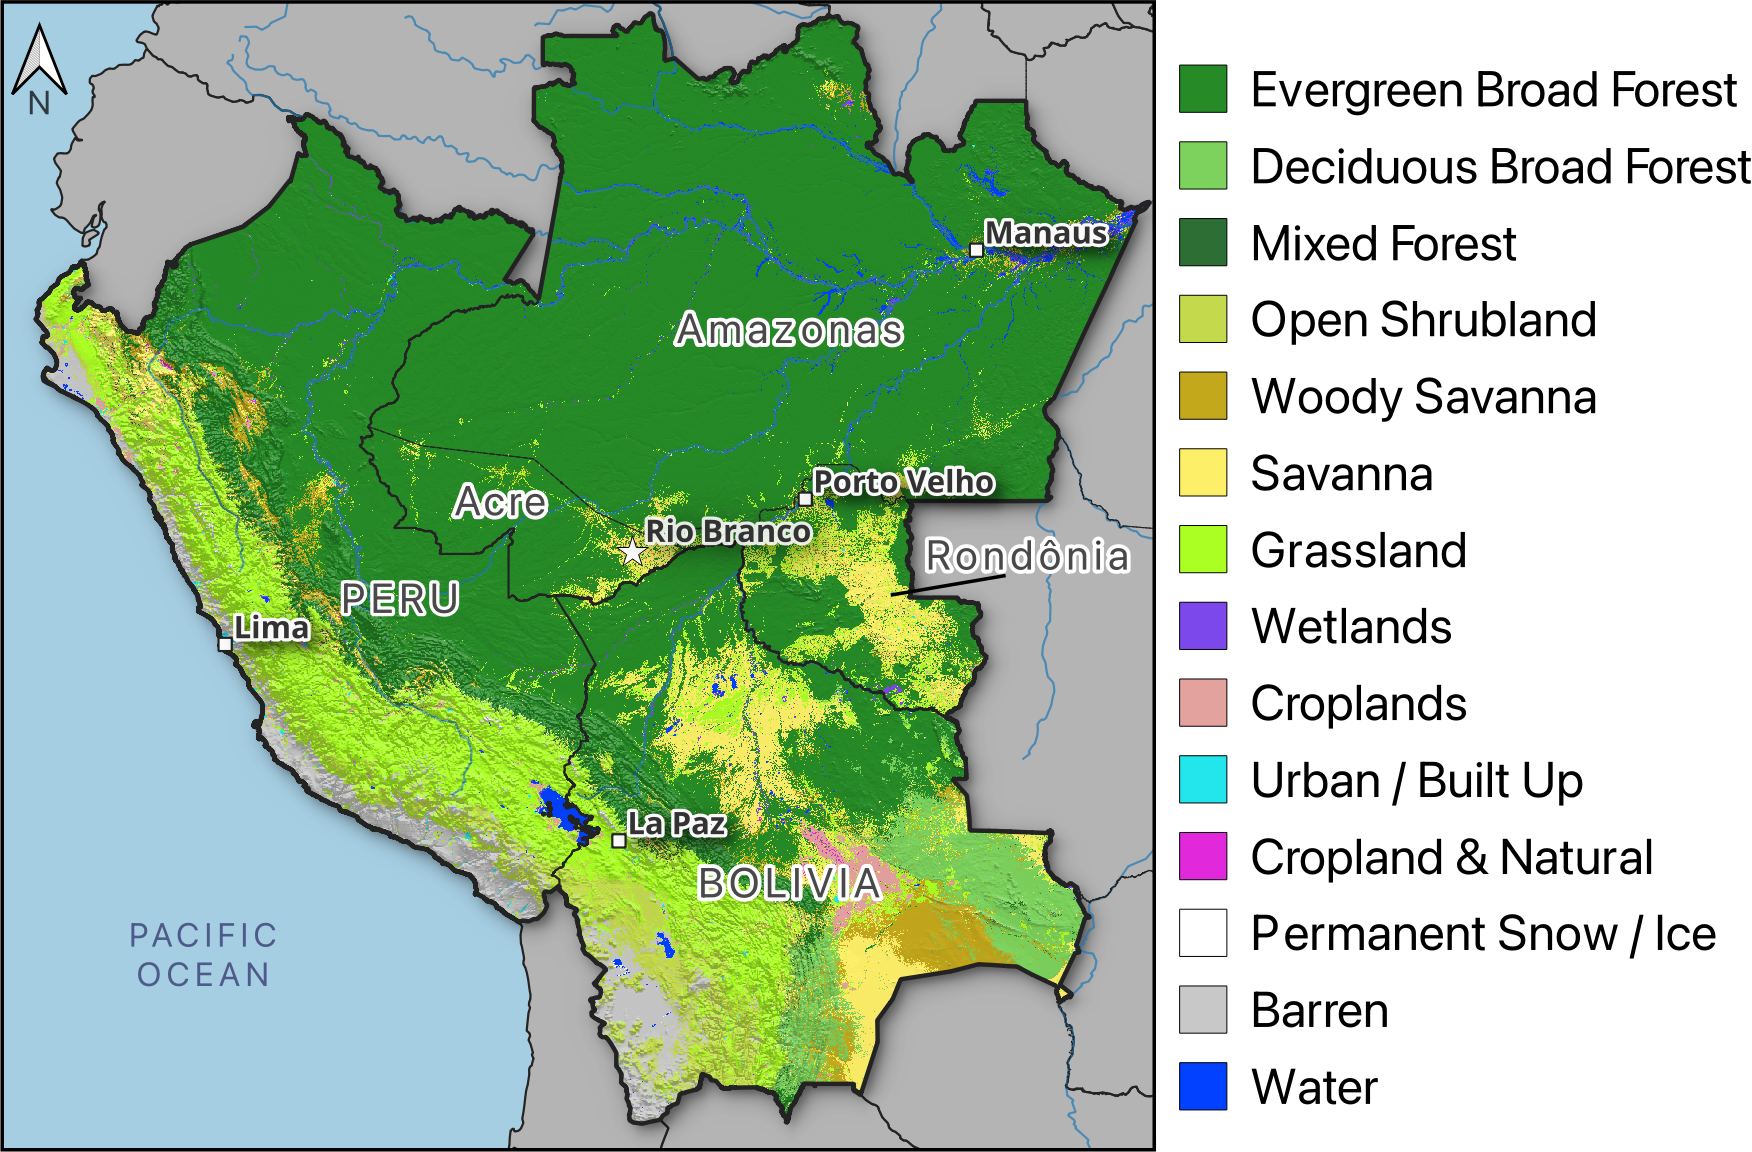
Figure 2. Rio Branco in the Brazilian state of Acre and surrounding states and countries. Colors show the land cover type according to the MODIS Land Cover dataset for 2020
Also apparent in Figure 2 are the alterations left on the landscape by human influences and activities. The highways that connect settlements can be seen as lines of reduced forest cover and increased land cover types such as savanna and shrubland, e.g., extending out from Rio Branco to municipalities in the north and west of Acre. In some areas, the effects of deforestation can be seen, for example in the areas immediately surrounding Rio Branco and in much of Rondônia and Bolivia. Many of these areas have undergone significant deforestation in recent decades. According to Global Forest Watch (Global Forest Watch, 2023) and the Global Land Analysis & Discovery (GLAD) dataset, this ranges from as much as 19% forest loss in Rondônia to 0.96% in Amazonas. Acre itself has seen 5.7% forest loss between 2000 and 2020. Forest loss for other surrounding regions is summarized in the table below.
| Country / State | Tree Cover Loss |
| Rondônia | 3.30 Mha (19%) |
| Acre | 802 kha (5.7%) |
| Bolivia | 3.32 Mha (5.6%) |
| Peru | 762 kha (0.97%) |
| Amazonas | 1.42 Mha (0.96%) |
Human influences like deforestation are a significant driver of one of the primary contributors to air pollutants in the region: rural fire. Although rural fires can occur naturally (often initiated by a lightning strike), studies have shown that most fire events in many areas are related to human impacts (Balch et al., 2017). Deforestation can exacerbate the problem by reducing dense forest area, which holds moisture and humidity better than the less vegetated areas that replace them (Cardil et al., 2020). The probability of rural fire ignition and spread is also a function of meteorological variables such as precipitation, drought, temperature and wind speed. The Fire Weather Index (FWI) is a daily, unitless measurement which combines these meteorological variables in an attempt to account for the effects of fuel moisture and wind on the behavior of rural fires. The metric was developed by the Canadian Forest Service (Stocks et al., 1989) and has seen use globally in the prediction of rural fire risk. In a world of changing climates, meteorological risk factors may change in the future and the FWI is useful for making projections of this risk. Later in this report, we make use of the FWI to make such projections.
In the following sections, we present three analyses for Rio Branco:
- First, we provide an overview of present day (2000–2020) air quality in Rio Branco and rural fires in the surrounding area (Section 2). This is done using satellite and ground level observing instruments which can record particulate matter concentrations. Rural fire spatial distributions are also estimated using satellite observations.
- We simulate the trajectories of air parcels to estimate where air arriving at Rio Branco daily has been 6 days previously (Section 3).
- We project upstream rural fire risk using the Fire Weather Index metric and machine learning (Section 4).
2. Present day air quality in Rio Branco
Air quality observations can be broadly categorized into two types: remotely-sensed data obtained from satellite observations, and in-situ data obtained from instruments on the ground. Each category has its own benefits and limitations.
- Remotely Sensed Observations. Satellites are able to observe large areas, however their observations may have temporal inconsistencies. The orbital period of satellites, and cloudy days and night time reduce the effective time for monitoring. Despite this limitation, their data are used for obtaining low frequency averages over a region. Measurements of particulate matter are often derived from a satellite observed metric called Aerosol Optical Depth (AOD).
- In-situ measurements. Conversely, to remotely sensed observations, in-situ measurements provide on-the-ground data for a fixed location. However, they can do this at a very high frequency and report conditions that are often more relevant for the local communities, who breathe the air.
In a nutshell, in-situ measurements provide the best representation of local conditions. However, they have spatial limitations. On the other hand, satellite observations can fill in the spatial gaps but with temporal limitations. Often, spatially and temporally “complete” datasets can be created by combining both types of observations with estimates from computer simulations using a technique called data assimilation.
Figure 3 shows a selection of time series of PM2.5 concentrations across Acre between the years 2000 and 2018. Location specific data (at Rio Branco and Cruzeiro do Sul) is taken from a gridded dataset created by the University of Washington St. Louis (van Donkelaar et al., 2021). This data estimates surface PM2.5 at the monthly level by combining satellite AOD, simulations using a chemical transport model and ground-based observations where available. The figure also shows the annual average across all of Acre, which is what is used in the life expectancy estimates from the AQLI dataset mentioned in Section 1.
Figure 3(a) shows monthly mean PM2.5 concentrations at the two locations in Acre. The data shows a seasonal cycle in PM2.5 at both locations, which aligns well with the fire season (July–November), suggesting that this signal is primarily driven by rural fires. Annual peaks are higher every year in Rio Branco than in Cruzeiro do Sul, as shown in Figure 3(c). Figure 3(b) shows the annual mean PM2.5 levels at each location and across all of Acre. Despite some annual variability, all annual averages exceed the WHO guideline threshold of 5 µg/m3 per year. Using the AQLI life expectancy loss estimates, this translates into an average loss of life expectancy in Acre of 2.7 years, equating to a total loss of approximately 2.5 million years of life.
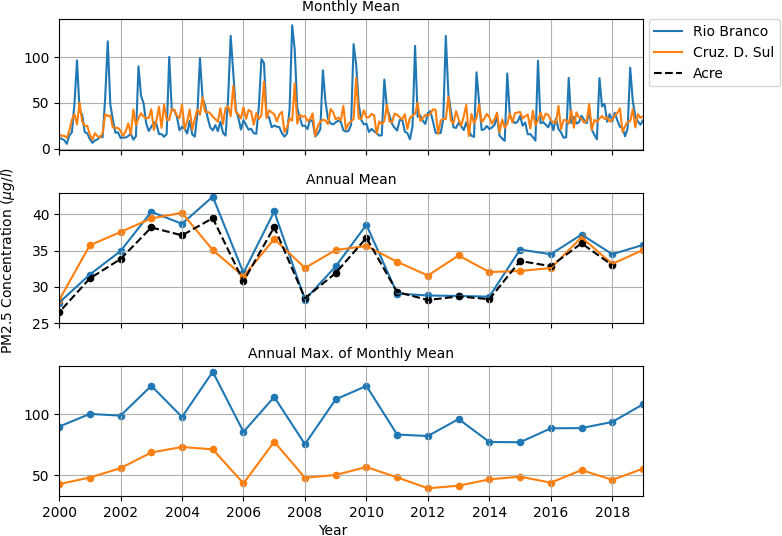
Figure 3. PM2.5 observations derived from satellite measurements at Rio Branco, Cruzeiro do Sul and averaged across all of Acre. Top: Monthly mean measurements, Middle: Annual mean measurements. Bottom: Annual maxima of monthly mean time series. Data is taken from the Donkelaar (University of Washington St Louis) dataset.
The AQLI dataset is a powerful tool for quantifying the impacts of air pollution. However, further study is needed to quantify the long term health effects of air pollution, especially particulate matter. The studies used in the AQLI project focus on urban populations in China, and the results here have been extrapolated globally. More localized assessments of air quality health impacts are relatively limited however.
The previously discussed limitations of satellite data place constraints on how finely resolved the above measurements can be spatially. The resulting averaging scales mean that the data may not perfectly represent the air that is actually being breathed by someone in Rio Branco. For this, we need high frequency consistent in-situ measurements. Historically, such observations for Rio Branco and surrounding regions have been scarce. However, recent funding allowed for the installation of a number of in-situ instruments to be a part of the Purple Air network (https://www2.purpleair.com). These instruments have been recording high frequency particulate matter concentrations at a number of locations around Acre, including Rio Branco since 2018.
Figure 4 shows examples of time series taken from 4 of these locations: two near Cruzeiro do Sul and two near Rio Branco. The values shown are raw data and uncorrected to account for calibration errors. The locations of the available Purple Air sensors in Acre are also shown. It is clear from the figure that, in the raw data, the WHO guidelines for daily concentrations (shown by the red dashed line) are frequently exceeded. For example, In 2019 there are 125 days exceeding 15 µg/m3.
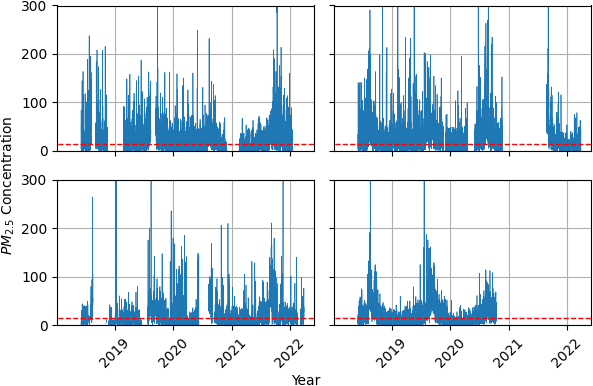
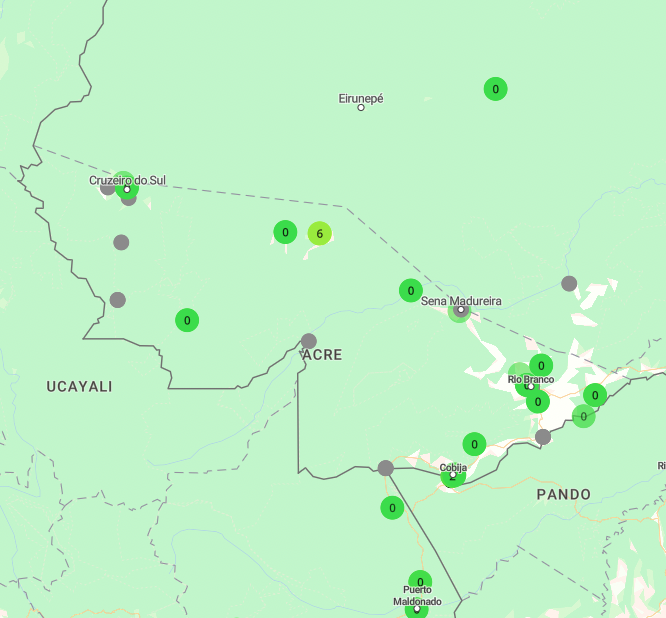
Figure 4. Examples of high frequency observations of PM2.5 from four Purple Air sensors in Acre. The available sensor locations in Acre, as of 30th March 2023, are shown in the right panel. On the left, the top row shows data for near Cruzeiro do Sul and the bottom shows data for near Rio Branco. Red dashed lines show the WHO guidelines for daily PM2.5 concentration levels.
3. Where is the smoke coming from?
When considering the source of the smoke that arrives at Rio Branco, there are a number of separate questions to consider. Two of the most important are discussed in the following sections.
3.1 Where are the rural fires?
For this section, we need observations of rural fire events. In this study, we have used the FiredPy fire event delineation model (Balch, 2020) to define fire event polygons using MODIS burned area data (Giglio, 2018). The MODIS product uses satellites to identify where and when burning has occurred at a resolution of 500 m. The FiredPy system then ingests this data to identify distinct fire events, including a geospatial shape of fire, ignition location, total burned area and burn rates. We can analyze this data to determine spatial distributions of fire in the study area.
Figure 5 shows the number of fire events per year (according to ignition location), as observed by the MODIS data, within 1/4-degree grid cells. The distribution is shown for our study area: Bolivia, Peru and the Brazilian states of Acre, Amazonia and Rondônia. It is important to consider a large area in this analysis as the potential range of particulate matter can be large, as discussed in Section 1. Many of the patterns we see in this data are closely associated with the land cover distribution shown in Figure 2, for example:
- Fire events are observed most abundantly in less vegetated regions (e.g., savanna, shrubland, grassland) around Rio Branco, across to Porto Velho and in central
- Bolivia. Many of these areas have undergone significant deforestation.
- North and west of Rio Branco, moving into Peru and Amazonas, we see fewer fire events and these regions are generally much more heavily forested. This may be due to a combination of reduced human influence and better moisture retention than shrublands or savanna-like areas.
- A small number of fire events follow alongside natural features such as the Amazon River and its tributaries, indicating the presence of human influence.
- Areas described as the “bare” land cover type such as southwest Bolivia or coastal Peru see very few to no fire events at all. This makes sense as there isn’t the biomass to burn in these areas.
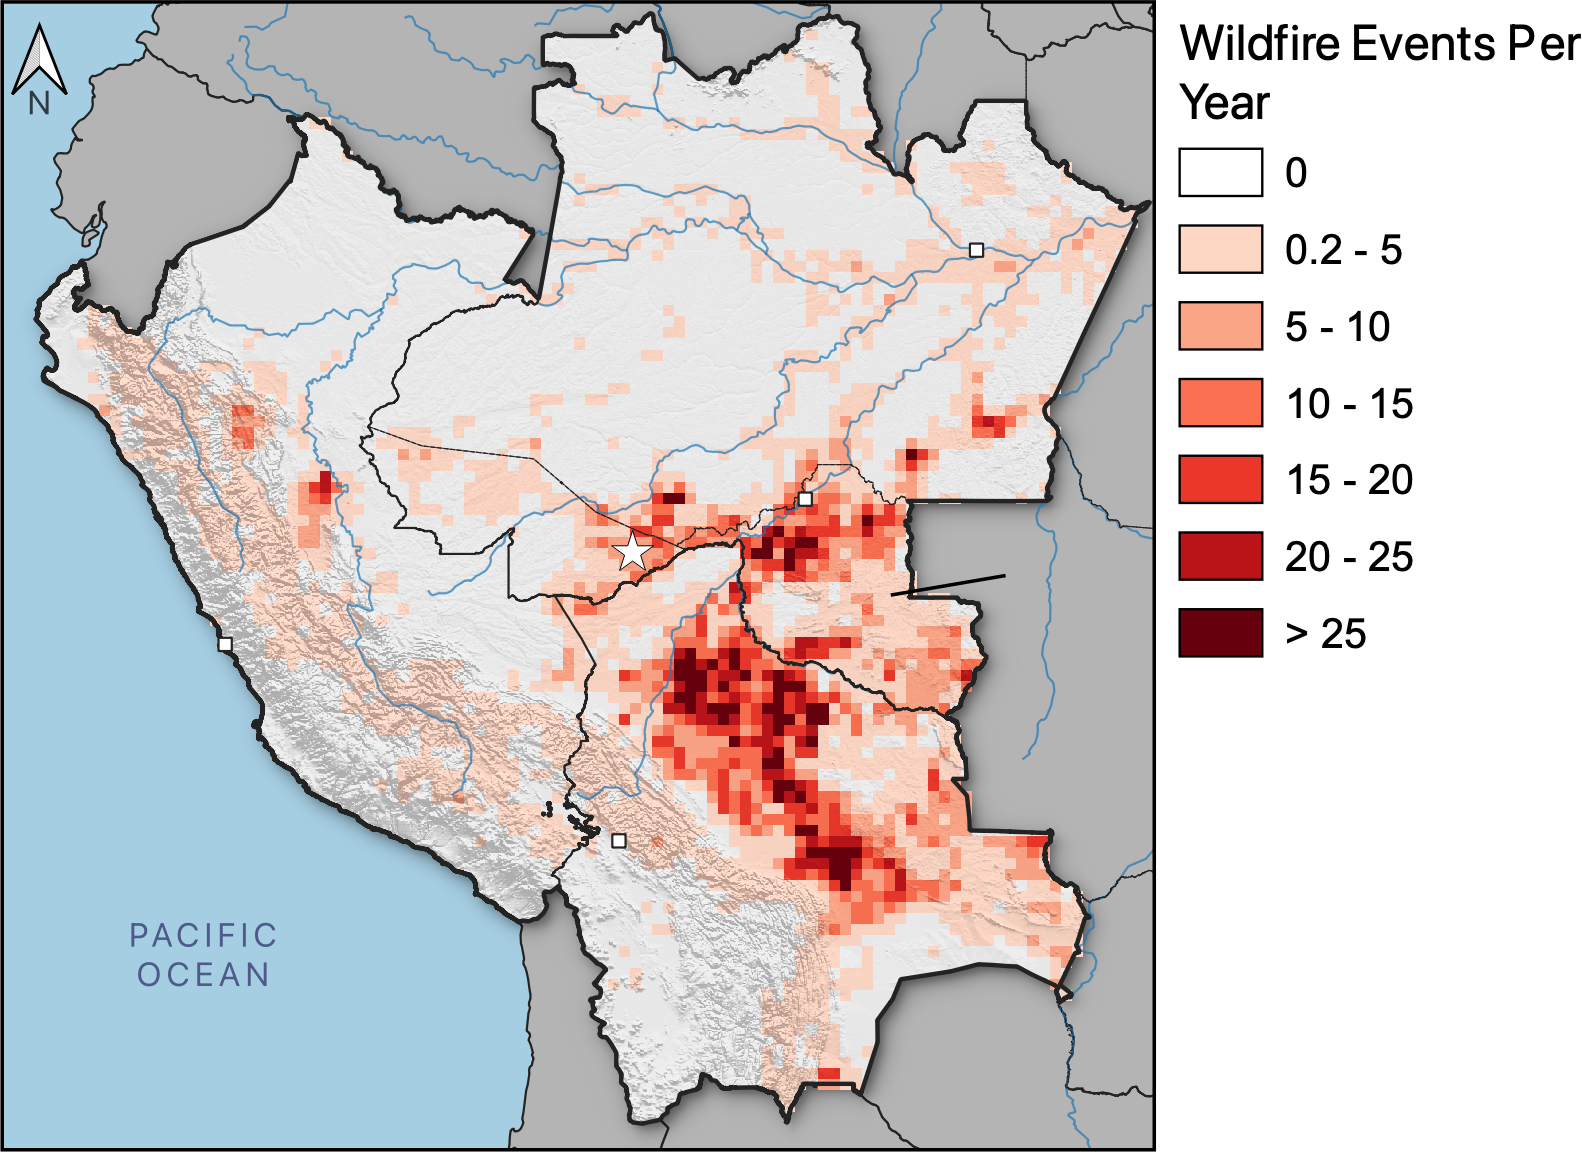
Figure 5. Gridded fire distributions. Each value shows the number of fire events per year within a 1/4-degree grid box according to MODIS burned area data and the FiredPy event identification model.
3.2 Where does the smoke go?
Understanding how emissions travel through the atmosphere from the locations depicted in Figure 5 is crucial, particularly in determining the likelihood of pollutants reaching Rio Branco. Most importantly, we need to know how likely emissions are to reach Rio Branco. In this study, we employed the HYSPLIT (Hybrid Single-Particle Lagrangian Integrated Trajectory) model developed by NOAA (Stein, 2015) to simulate the pathways that air parcels take before reaching Rio Branco. HYSPLIT’s trajectory mode functions by treating an air parcel as a single particle that is suspended and carried through the atmospheric flow. This atmospheric flow is three-dimensional and provided by the user. For this analysis, we have used the “backwards” mode of HYSPLIT, to push the particle through a reversed flow. Instead of being pushed forward from Rio Branco by the atmospheric winds, we reverse the wind direction to see where it is likely to have come from. These backwards trajectories are simulated for six days prior to arrival at 50 m above Rio Branco.
To accurately model the movement of air parcels, we utilize the GDAS (Global Data Assimilation System) 1-degree atmospheric data. This dataset contains all necessary atmospheric variables at multiple vertical levels. While a higher resolution may be necessary for more localized analyses, 1-degree resolution is sufficient for our purposes. For our analysis, we calculate one backwards trajectory per day between 2000 and 2018 for the months of August to November, which corresponds to the height of the fire season. In total, we have approximately 2200 trajectories to analyze. More information about the setup and testing of our HYSPLIT model can be found in Appendix C.
We employ two methods for this analysis: clustering and density analysis. Trajectory clustering allows us to simplify our large ensemble of trajectories by identifying a smaller number of clusters, i.e. trajectories that have similar behaviors. A density analysis calculates how many trajectory data points we have in a set of grid boxes, allowing us to see which areas are most commonly traversed by modeled air parcels.
Figure 6(a) shows the full ensemble of daily trajectories and Figure 6(b) shows the average trajectories of each cluster identified by the HYSPLIT clustering algorithm. The percentage of all trajectories represented by each cluster is also provided. Although there are seven clusters, this analysis shows three main patterns:
- A slow relatively local flow from the north and the east. Most of the trajectories reaching Rio Branco in six days come from within 1000 km and have traveled from the North, over Acre and Amazonas or from the northeast. These account for approximately 64% of all trajectories reaching Rio Branco.
- A fast flow up from the south, partially controlled by the Andes mountains. The algorithm identified four such clusters, which travel over very similar areas but at varying speeds. Colors in the figure are simply used to distinguish these trajectories. In total, these clusters account for approximately 31% of air trajectories arriving at Rio Branco.
- A fast and widespread flow from the east. Approximately 5% of air parcels arriving at Rio Branco come quickly from the east. There is a large latitudinal spread in this cluster, however.
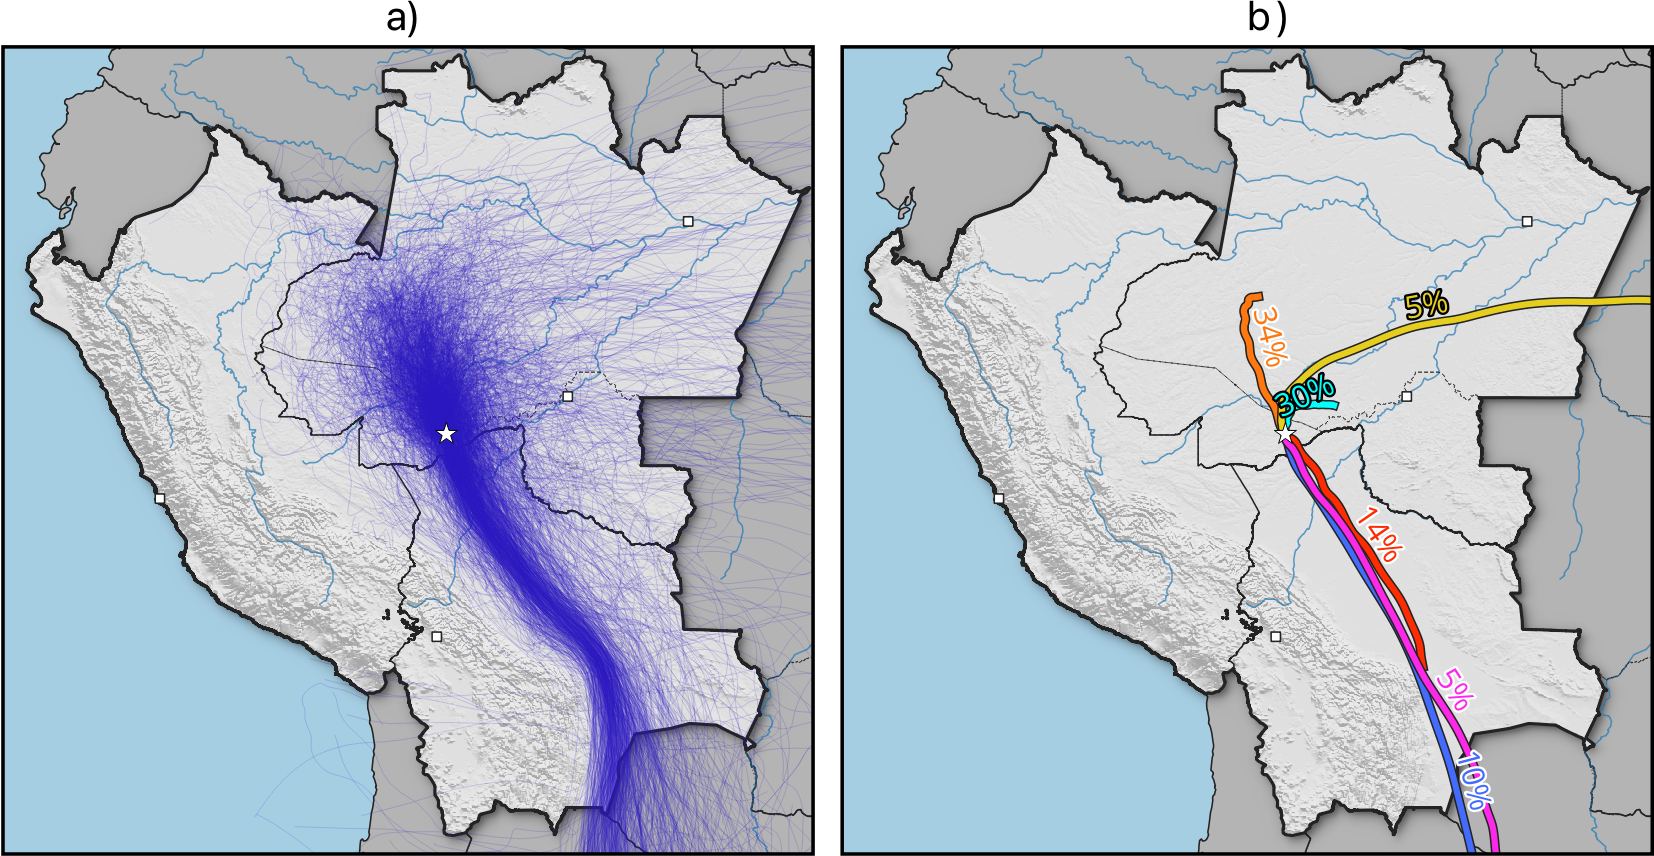
Figure 6. 20 years of 6-day backward trajectories released from Rio Branco. a) The full ensemble of trajectories. Each blue line shows a single daily trajectory. b) Clustered trajectories and their percentage contributions to the total ensemble. Colors are only used to distinguish different trajectories.
Figure 7(a) shows the percentage of all trajectories that passed over each grid cell at least once. This data can be thought of intuitively by asking the question: for an air parcel arriving at Rio Branco on any day during the fire season, what is the probability that it passed over any given grid cell (for at least one hour) during the previous six days? In the data, we see a clear spatial skew in the trajectory distribution, approximately oriented between NNW and SSE. Here, we are seeing the controlling effect of the Andes mountains on the local atmospheric flow. Generally, the most well-defined regimes follow that of the cluster analysis above, with trajectories coming from a large and nearby area north of Rio Branco, or approaching quickly from the south. Very few to no trajectories come from Peru, especially past the Andes mountains, or southwest Bolivia.
Figure 7(a) gives us no information about where most of the air is spending its time before arriving at Rio Branco. Each grid square tells us how many trajectories passed over for at least one hour, but if a trajectory spends all of its time at that location it only counts once. Trajectories can move at different speeds on their six-day journey to Rio Branco, with some moving very little distance at all and others traveling 1000s of miles. Figure 7(b) shows the percentage of time spent across all trajectories in each grid box. Broadly speaking, this shows where air parcels arriving at Rio Branco spent their time during the previous six days. Many of the structures seen in this data are similar to those in Figure 7(a), however there are subtle differences. The data is weighted more to the large region north of Rio Branco than to the southern trajectories because of the slower moving nature of the northern air. The dashed line in the figure shows the radius around Rio Branco in which 50% of this distribution lies.
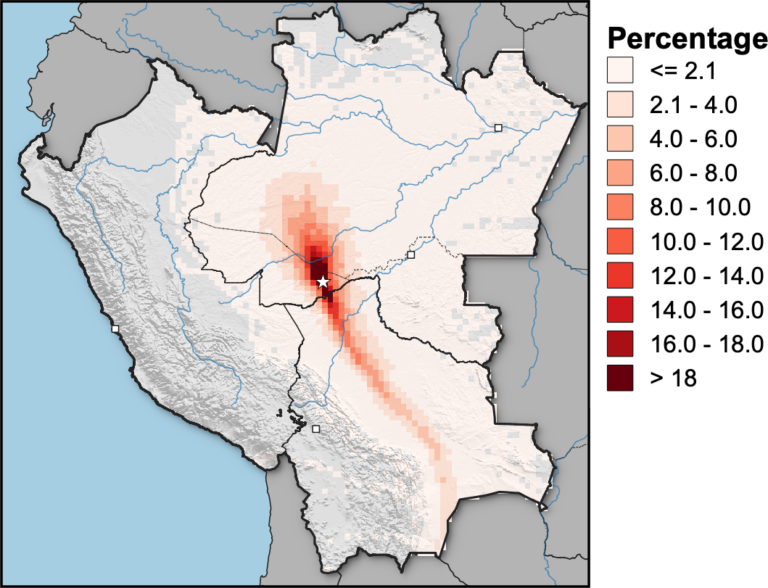
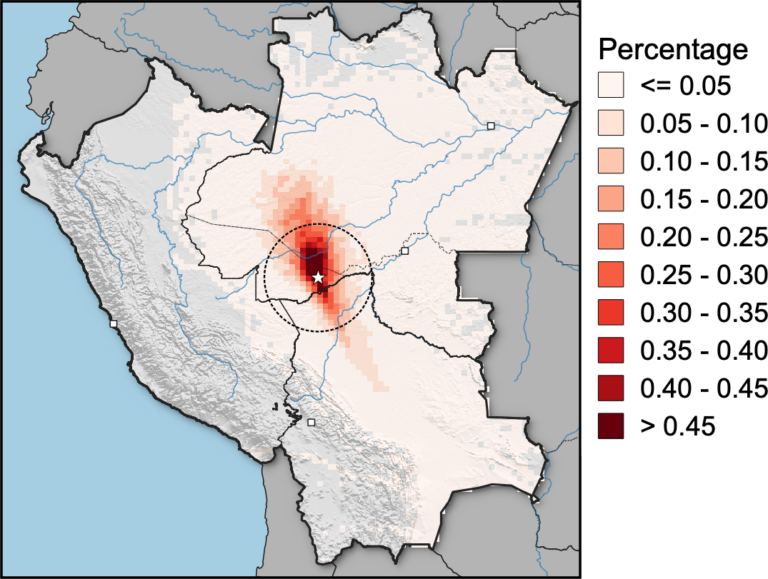
Figure 7. Gridded distributions of 20 years of backwards trajectories from Rio Branco. a) The percentage of trajectories passing over each grid square. b) The proportion of all simulated time spent over each grid square.
4. The future of Rio Branco
The drivers of fire-related air quality, both human and meteorological, are expected to undergo significant changes in the future. Deforestation is likely to continue, human activity will keep increasing, and global warming will cause changes in precipitation, drought, wind, and temperature. In this section, we present two approaches to help us predict increases in the number of upstream fires around Rio Branco due to changes in climate conditions. The first is the Fire Weather Index and fire danger days, an existing concept that we discuss in Section 4.2. We then extend this metric to include land-based variables such as land cover and human influence in Section 4.3. In this section, we also introduce the concepts of radial and upstream events for Rio Branco.
4.1 Quantifying fire impact: Radial and upstream analyses
The fire risk projections in this section have been analyzed for the whole study region, i.e. Acre, Amazonas, Rondônia, Peru, and Bolivia. However, increased fire risk in some areas may have more impact on air quality in Rio Branco than in others. To assess these impacts, we have adopted a “radial” and “upstream” approach. A radial event refers to an occurrence within a fixed radius around Rio Branco. We can calculate changes within these radii by analyzing the two-dimensional distributions of fire counts. The radii used are 266 km, 532 km, and 1064 km, based on the radii defined in Section 3’s analysis.
The radial approach does not take into account the patterns of atmospheric flow presented in Section 3. Therefore, we combine our fire projections with the trajectory percentage dataset (the percentage of trajectories passing over each grid point—see Figure 7(a)). For a single location, we can estimate statistically how many fire events per year are passed over by a trajectory that ultimately arrives at Rio Branco (an upstream event). To do this, we multiply the trajectory percentage at this location with the number of events per year. For example, suppose a location sees 10% of all trajectories pass over it within six days of reaching Rio Branco and this location is also projected to have 20 additional fires per year in 2050. On average, this location would contribute two additional fire danger days in Rio Branco’s upstream flow. By performing this calculation at every location and summing across the whole region, we obtain an estimate of the number of “upstream” events for Rio Branco. Mathematically, this is equivalent to taking the dot product of the two datasets.
We can apply this approach to varying time windows for trajectories at Rio Branco. Below, we present results for three time windows: 0–2 days upstream, 2–4 days upstream and 4–6 days upstream.
4.2 Upstream fire danger days
In Section 1 we introduced the Fire Weather Index, a daily, unitless measurement of fire danger, derived from temperature, relative humidity, wind speed, and precipitation. It is useful to assess fire risk in terms of changes in the number of “fire danger days.” A fire danger day is defined as any day with an FWI value in the highest 5% of values at each location, i.e., a 1-in-20 day occurrence. This threshold indicates a high-danger fire day, where fires have the potential to quickly grow out of control in the event of natural or human-caused ignition. Then, we can assess how risk changes in the future by counting the number of days with an FWI value greater than these historical extremes. In other words, we take the value of the highest 5% of FWI values at every location for the 2000-2020 period, and count how many times this is exceeded under future time periods.
In the analysis below, we use FWI data derived from three CMIP5 models dynamically downscaled using REMO2015, for the IPCC RCP85 scenario. This data is bias adjusted and statistically downscaled to 1/4-degree resolution. Bias adjustment is done relative to ERA5 (Vitolo et al., 2020), a historical gridded dataset that incorporates observations. Performing this adjustment means that the bias in the CMIP5 data and ERA5 data will match for the historical period, which in our case is 2000–2020. Statistical downscaling allows us to obtain a higher resolution dataset.
Figure 8 shows the change in FWI danger days for 2040–2060 and 2070–2090 around our study region. We see the number of danger days either stay approximately the same or increase in both time periods. Generally, increases are larger for the late century time period. In some areas this increase is significant, reaching over 100 additional days per year in Northeast Amazonas and low-lying regions of Peru. In the areas immediately surrounding Rio Branco however, these increases are generally small.
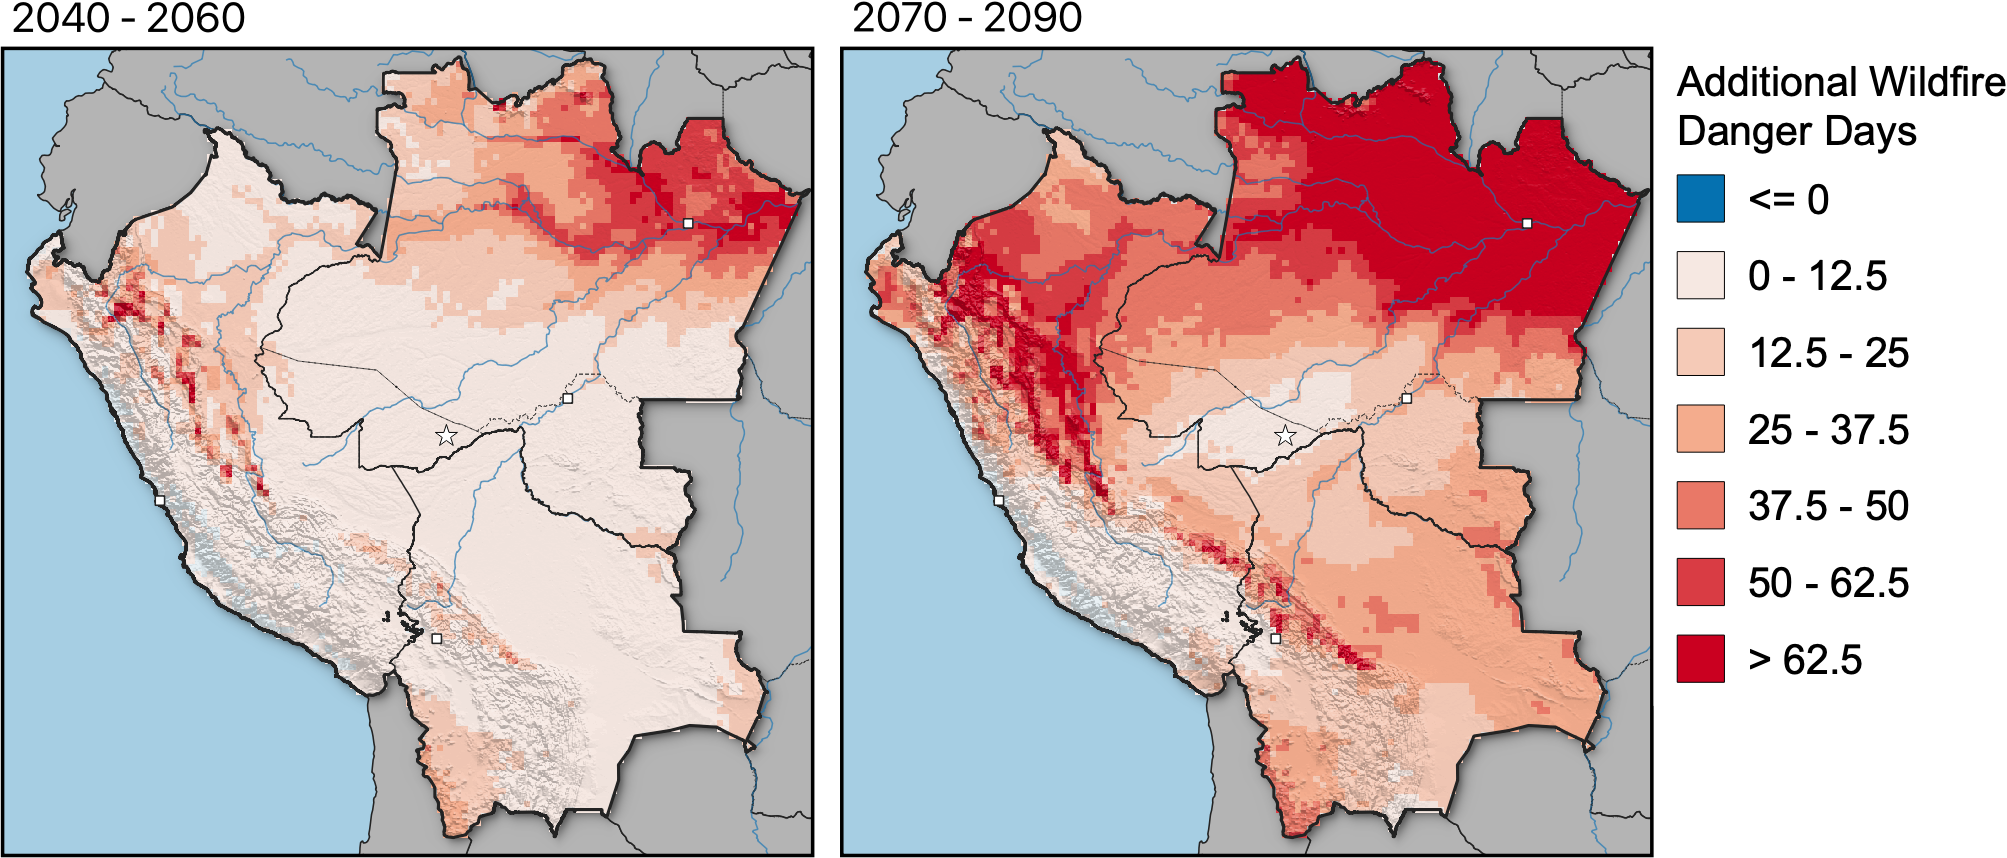
Figure 8. The change in fire danger days per year relative to 2000-2020 in two future periods according to CMIP5 projections under the RCP85 IPCC scenario. A fire danger day is defined as a value of Fire Weather Index exceeding the 95th percentile at each location for the reference period.
Increases in fire danger days may lead to increases in the number of fires and therefore concentration of particulate matter. Figure 9(a) shows the percentage increase in the number of area total fire danger days within three radii around Rio Branco. Within the smallest radius, we see increases of 26% and 75% for the 2040-2060 and 2070-2090 time periods respectively. For all radii, the number of fire danger days increases towards the end of the century. Larger radii see larger increases, which agrees well with the data in Figure 8, i.e. as we move further from Rio Branco, we see large increases in the number of fire danger days.
Figure 9(b) shows the projected increases in the number of upstream fire danger days for 0-2, 2-4 and 4-6 days upstream. Similarly to the radial analysis, we see an increase towards the end of the century and the further we move from Rio Branco.
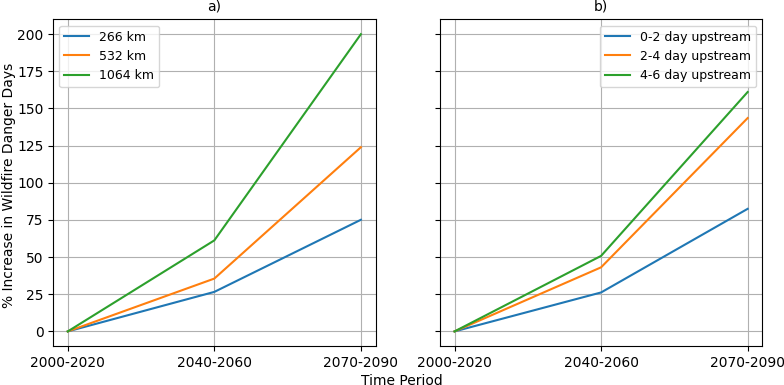
Figure 9. Percentage increases in the area sum number of FWI fire danger days a) within 3 different radii around Rio Branco and b) upstream from Rio Branco.
4.3 Extending FWI using Machine Learning
The Fire Weather Index is an effective tool for evaluating fire risk, but it alone does not provide complete insight into the likelihood of fires. This is due to the fact that fire ignition is influenced not only by weather, but also by factors such as land cover, land use, and human activity. Furthermore, fire danger days are not an absolute measure of risk as they depend on a specific baseline period for each location. To improve upon using FWI danger days, we have developed a machine learning model that incorporates these additional factors to enhance the FWI.
A machine learning model is a powerful tool that can learn from historical data and make predictions based on new inputs. In our case, we want to predict fire occurrence and its probability using variables such as FWI and landcover. Machine learning models must be “trained” or “fit” to the data that we have, then they can then be applied to provide predictions using new inputs. Below, we give a brief description of the model here but see Appendix-A for more details on the methodology behind this model.
We develop our model to output the probability of daily fire ignition within 0.25 x 0.25 grid cells. Inputs to the model are FWI, the proportion of 17 land cover types within each cell from the MODIS dataset, human footprint data (Venter, 2018), WGLC lightning density dataset (Kaplan, 2021), mean elevation from the SRTM30 dataset, and latitude. We use a gridded version of the FiredPy fire event locations to determine whether there was a fire event within a given grid cell on a given day. In other words, we provide the trained model with all of the above information and it will attempt to give us a probability that a fire event started on that day. Once we have applied the model for every day and location in the study region, we sum daily probabilities for each year to obtain expected annual counts of fire events for each grid cell. For example, if a single grid point has a 1/365 chance of ignition for every day in the year, we would expect there to be one event per year (on average) at that location. A separate model is developed for Peru, Bolivia and three Brazilian states to account for social and political differences.
Training of the model is done using FWI data from the ERA5 dataset (Vitolo, 2020) for 2000–2018. It is important to assess how accurately the model predictions are. To evaluate this, we train the model on a subset of the data and compare its predictions to another subset that it has never seen before. Our analysis shows that 90% of predictions are within 15% of the true distribution. That is, if the model predicts a daily probability of 10%, the actual observed distribution is between 8.5%–11.5% with 90% confidence. Once the models are trained, we use FWI data derived from three CMIP5 model runs to obtain projected annual fire counts up to the year 2100. This is done for the IPCC RCP85 model scenario.
Figure 10 shows radial counts and upstream counts for the three radii and upstream time periods. Here we see relatively little change for all time periods in the number of upstream fires until around the year 2050. However, after this point, the number increases rapidly. By 2090, our model predicts that the number of annual fires will have increased by 34% two days upstream of Rio Branco and 40% for 2–6 days upstream. The radial counts show a very similar pattern, with a sudden acceleration in 2050. Generally, larger increases tend to be in the same locations as high present-day counts. Broadly speaking, this matches up with the data shown in Figure 8. For 2050, increases in FWI danger days are small in the areas around Rio Branco but increase significantly by 2090.
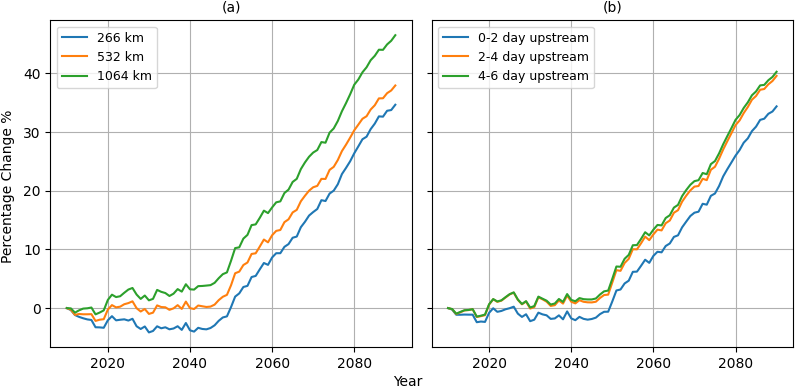
Figure 10. Percentage changes in the number of fires at Rio Branco according to climatological projections (RCP85) of FWI and machine learning. a) The percentage change within three annuli concentric around Rio Branco. b) The percentage change in 6-day upstream fires.
5. Further discussion & conclusions
Air quality is critical for public health, making it a primary driver for research. In Section 2 of this study, we touched upon an important metric for quantifying the impact of air pollution on public health: its impact on life expectancy. Based on data from University of Chicago Air Quality Life Index (AQLI) project, it is estimated that meeting World Health Organization guidelines could save 2–3 years of life expectancy per person in Acre. This highlights the importance of reducing air pollution to improve the quality of life for everyone in the community.
AQLI life expectancy estimates were made using annual mean observations of PM2.5 across all of Acre. However, in Section 2, we demonstrated that observations on a monthly frequency can significantly vary across the state. For instance, the south (near Rio Branco) experiences more fire occurrences than the North (near Cruzeiro do Sul), resulting in higher seasonal peaks. Understanding how air quality varies across Acre is vital for understanding impacts on public health.
We showed that we can use gridded datasets derived from combinations of models and observations to estimate these spatial variations. However, such datasets can lack accuracy in areas where observations are sparse. The most reliable way to get locally representative observations is through well maintained in-situ instrumentation, such as those presented in Section 2, extracted from the Purple Air database. The state of Acre has made great progress recently in installing and maintaining such in-situ instruments and it is highly recommended that this continues.
The accessibility of air quality data to all communities, including indigenous communities, farmers, researching and decision-makers, is crucial. While the Purple Air website provides some level of accessibility, the data processing is minimal, and it is not tailored for the region. Willian de Flores (Universidade Federal do Acre) has developed a website (http://www.acrequalidadedoar.info), that displays processed air quality data from the Purple Air database that is bespoke for Acre. The website offers air quality information in the Portuguese language by municipality in Acre, comparisons to World Health Organization guidelines, color-coded risk levels, and explanations of the data. It has seen success in Acre and could serve as a prototype template for other regions seeking to improve access to real-time air quality data.
Using the HYSPLIT model, we identified three major regimes for air parcels arriving at Rio Branco. Our analysis reveals that approximately 31% of trajectories approach quickly from the south, 64% from the nearby areas to the north and east, and a smaller 5% from the East. This data is useful for identifying areas that are “upstream” of Rio Branco, and with what frequency. Understanding the source of air arriving in the region is a crucial step towards reducing the impact of smoke on all communities. For example, our analysis shows that across all modeled trajectories, half of the total modeled time was spent within just 266 km of Rio Branco. The 31% of air parcels arriving from the south are also likely to contribute to the quality of air in Acre. Despite making up a smaller proportion of the modeled trajectories, our analysis using the FiredPy model shows more underlying fire events. As some of this air and many of these fires are occurring in Bolivia, this shows the importance of regional communities and authorities working together to reduce these emissions. However, despite the higher fire event density to the south, we emphasize that most air parcels are carrying the impacts of nearby areas, meaning that it is future decisions made within Brazil—for example around deforestation, urbanization and fire control policies—that could have significant consequences for Rio Branco. Conducting similar trajectory analyses with HYSPLIT in other locations surrounding Acre and neighboring countries is an essential next step.
Managing and understanding the impact of fire-related air quality in Rio Branco and Acre is increasingly important for the future. Our analyses suggest that by 2090, there could be an increase of 34% in the number of fires occurring within 0–2 days atmospherically upstream of Rio Branco, and 40% for areas within 2–6 days. These increases could lead to a significant rise in particulate matter concentrations, with adverse effects on public health. Furthermore, these changes are due to meteorological changes only, and do not consider possible changes in land cover, land use and human influence. If current trends in land use continue, then these projections are likely to be an underestimate in the context of the climate scenario used in this study (RCP85). Therefore, our projections should be used as a conservative estimate of future upstream fire risk under a high-emissions scenario.
Download the full pdf with references, appendices and methods.