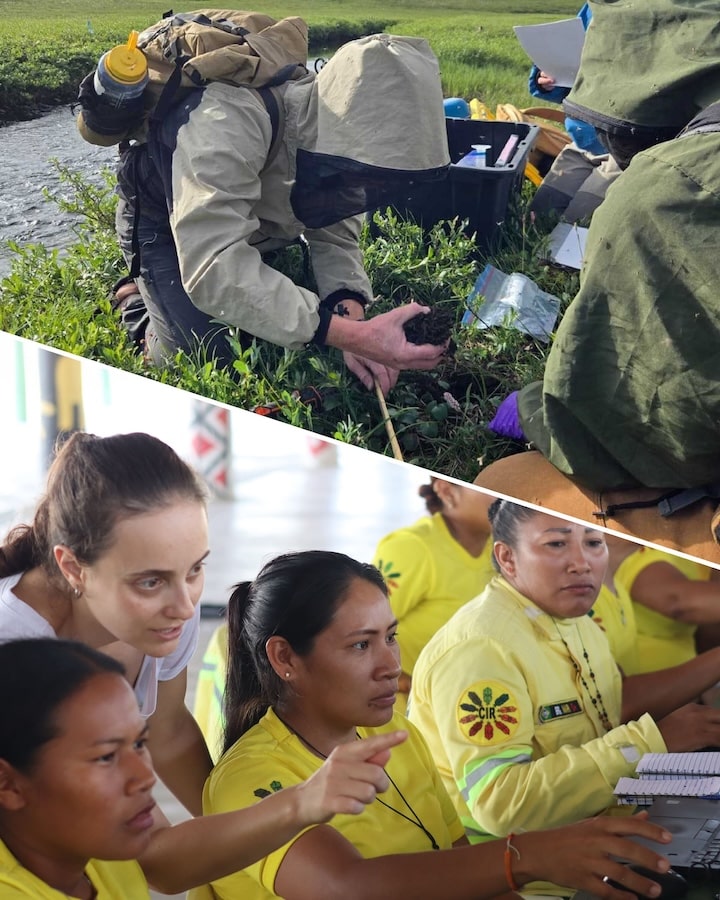
2025 marked the first year I went out in the field as a member of Woodwell Climate’s Permafrost Pathways monitoring team. I travelled around Alaska to our carbon monitoring sites, maintaining and installing equipment and taking static measurements of greenhouse gases — namely carbon dioxide, methane and nitrous oxide — in various degraded and disturbed permafrost landscapes around Fairbanks and west of Prudhoe Bay by the Arctic Ocean.
In late April this year, I returned to Toolik together with Dr. Jennifer Watts, Dr. Kyle Arndt, Christina Minions, Dr. Kelly Gleason (snow scientist from Portland State University) and photographer Jayme Dittmar to install an eddy covariance tower by a retrogressive thaw slump (here). Eddy covariance towers monitor and capture fluxes, or the exchange between land and atmosphere, of energy and greenhouse gases. Thaw slumps are areas of tundra that have collapsed due to thawing ice-rich permafrost. When the ice melts, the ground collapses, revealing old, buried carbon rich soils that begin releasing their carbon back to the atmosphere. The towers help us better understand how much carbon these features contribute to calibrate models of Arctic carbon emissions.
Spring is one of the best times to be in northern latitudes. Near endless days, the bright snow, the monochromatic stretches of landscapes, the binary experience of both intensity and complete stillness. Now suddenly, the interruption of a small group of people gathering, pulling around equipment, cords, cables, instruments, and then suddenly there is a new structure in the landscape and the people disappear. Off to a great start, we packed and organized our tools and equipment and headed from the wintery landscape of the north towards the onset of green-up to the south.
Back in Fairbanks, the bloom of birches in early June is one of my favorite sights. The dense stretches of light, delicate greenness and resinous fragrance from the new sprung leaves that are drowning in summer sunlight makes me almost feel all the carbon dioxide being sucked out of the air by the trees. This, again, makes me really appreciate the northern latitudes. The vastness that cradles your existence grounds you and at the same time lifts you with the intensity of the surrounding life. It is an energy that can only be felt at these latitudes. A form of mania that propels you onward without pause.
In late June the trip headed to Nome and Council where I, together with colleagues Dani Trangmoe and Dr.Kelcy Kent, maintain the tower there. With each site visit, not only do I get an improved grasp of the equipment, but also a better understanding of the surrounding landscapes, now even more chlorophyll-saturated peak green. I shuttled to Anchorage and then back up to Bethel with Trangmoe to join Dr. Jackie Hung and Christina Minions at the two towers located a 40 minute flight northeast of the town. Here, we upgraded solar structures, maintained and swapped equipment and hauled out old and damaged power supplies and misc. materials. I really appreciated the time being out there and the sense of community that comes with remote camps, although we only stayed out for about a week.
Afterwards we circled through Anchorage again on our way to the very top— the Arctic Ocean. I assisted Hung and fellow researchers from Woods Hole Oceanographic Institute and the Marine Biological Laboratory to collect greenhouse gas measurements from coastal tundra. The contrast of the flora and fauna against the infrastructures from the oil and gas fields makes for a surreal sight. From here I am going southward again, stopping at Toolik to check on the new tower and enjoy the buzzing environment that Toolik is offering during this time of year. The intensity of the arctic summers is reflected in the frantic work of scientists that all gather here to conduct a wide range of work.
At what other place in the world than Toolik would one be able to hike out on the tundra and do maintenance work on an eddy covariance tower in the morning, come back for a snack, go out in a helicopter to search for new areas of permafrost degradation, get a panoramic sight of thousands of caribou, come back to a hearty meal, and finish off the day catching some grayling at the river inlet by the Toolik lake. The beautiful clear light, the humming of mosquitoes, and the rippling sounds of the water give me a sense of belonging, a sense of home.
I spent my last weeks in Alaska in Fairbanks again, making boreholes in permafrost together with a magnificent team gathered from across the U.S. We can learn a lot from these seven-meter-deep boreholes. Not only studying the samples that we retrieve, but also how these permafrost soils evolve and change with climate change with sensors that monitor variables such as temperature, oxygen and soil moisture. The drilling was challenging and physically demanding, but at the same time something of a treasure hunt as each of the soil samples we were able to retrieve has the potential to unlock a wealth of information that can help us expand our understanding of the changing permafrost soils in the region. In the end it felt well worth the effort, especially being privileged to work with such a dedicated and knowledgeable group.
2025 also marked my tenth year of working in the Arctic. As a junior scientist, I remember reading and hearing about Woodwell Climate’s work in the Yukon-Kuskokwim Delta long before I joined the team. I remember spending a full summer on the Delta by the coast, learning about and experiencing firsthand the effects of both permafrost thaw and coastal erosion. Knowing that Woodwell’s first eddy covariance tower was installed in this region around the same time, and that it has been collecting data ever since, has given me a sense of perspective not only on my career, or the Permafrost Pathways project for which this tower was the springboard, but also the future of the Arctic landscapes that I have come to love.
I am grateful to have been given this perspective, and to work in and celebrate all these unique and beautiful places. If it wasn’t for the people and the relationships built through this work, we would know much less about these complex and fascinating landscapes. It is through these encounters with people and the environment that we can not only deepen our understanding but also gain connection. These encounters and interactions give a sense of belonging as a part of something bigger.
When I was young, there were always a few horses and ponies on our family farm. I was a pretty good rider. I even showed ponies in the 4-H children’s show at the local county fair.
My previous horse experience, however, proved little help for the day-long horse riding treks I found myself on this summer during a spontaneous trip to Northwestern Mongolia with friend and colleague, Marina Tonkopeeva of the International Center for Reindeer Husbandry (ICR). We were there to visit indigenous Dukha reindeer herders in the Taiga regions near Tsagaannuur, not far from the Russian border. The only access to these remote communities, I quickly discovered, was by riding many hours on horseback. Our journey included two separate horse treks, one to the East Taiga camp, home to about a dozen herder families and a second to the more rugged West Taiga region, higher up in the mountains where we met with two families on a much smaller camp in their autumn location. I was forced to relearn horsemanship on the fly across the Mongolian wilderness and was wishing I still had the resilience and physical toughness of my youth.
The goal of this trip was exploratory. I hoped to connect with herders and introduce cartography as a powerful tool, and importantly to gain first-hand knowledge about the lands I would be mapping. From many other field trips in the past, I’ve learned that there is true inspiration in taking the time to travel to a field site. It allows me, as a cartographer, to build relationships and make connections between my virtual world of geospatial data and reality. Experiencing things like natural colors and landscape dynamics all help with making maps, post-trip. My goal was also to co-produce maps with the Dukha herders. Co-production of maps essentially means combining Indigenous knowledge with western science and cartography to communicate a story, based on mutual understanding and trust. Through the process of co-production, I can learn about the intended audience of our proposed maps, about how the maps will be used, and what story we will tell with the maps we make together.
With the help of our host and colleague, Khongorzul Mungunshagai, we met with many reindeer herding families and shared detailed satellite images inside their teepees. Over reindeer milk tea and cheese, we discussed migratory paths, seasonal camp locations, and shared stories about regional changes.
Indigenous communities across the planet have adapted to climate variability for millennia; however, the combined impacts of rapid warming and resource development are having an unprecedented impact on Indigenous peoples and their lands. Reindeer husbandry, which has been practiced for thousands of years, constitutes the modern-day livelihood of tens of thousands of Indigenous people who tend millions of domesticated reindeer on lands that span the Eurasian permafrost region. Traditional reindeer husbandry practices are now being challenged by loss of land due to development, conservation, and climate change.
The Dukha people of Mongolia, like other indigenous peoples, have lived respectfully and in harmony with the land since time immemorial; however, their lifeways are being challenged by land use decisions that have been implemented without proper consultation and consent. Impacts of these land use changes on traditional grazing lands are being further exacerbated by landscape and landcover changes associated with climate change including increased fire, permafrost thaw, and shrubification. This is of particular concern in Mongolia, where the rate of summertime warming is three times faster than the average for Northern Hemisphere lands, resulting in land degradation from permafrost thaw and changes in vegetation cover due to desertification.
Additionally, the Mongolian government’s new national parks have created unmarked boundaries and land-use restrictions that are essentially invisible lines of attack on the Dukha’s traditional lifestyle. They are being forced to alter ancient migration routes or grazing sites, and they often unknowingly cross park borders because the government hasn’t provided any clear, useful maps.
Woodwell Climate has recently awarded a Fund for Climate Solutions grant to continue this work. We plan to work closely with Dukha reindeer herders using GIS tools to map land use and land cover changes in Mongolia and their impacts on grazing lands. We will co-produce maps to support climate change research and advocacy for environmentally and culturally-just land management practices. This work would build on past co-production successes working with ICR and Sámi reindeer herders in Norway and with Indigenous communities in Alaska.
It’s clear that maps are a powerful medium for clearly communicating information and important stories. Whether I’m visiting politicians, working with scientists, or gathering in a teepee on the taiga, I’ve found that maps are always a welcome addition to the conversation and they help grease the wheels of communication. Leaving the Taiga and enduring the long trip home, I was physically worn out, but the vision of the Mongolian landscapes and the clarity in the work that lies ahead gave the long trip back purpose. I took home not just memories of making new friends (both two legged and four) and of a stunning ecosystem, but a commitment to help map a path forward with our partners at ICR and the Dukha.
Summers in the Arctic-boreal region are becoming increasingly defined by fire. In 2023, Canada endured its worst wildfire season in history, with nearly 200,000 Canadians displaced. Fast forward to summer 2025, and the country faces its second-worst wildfire season on record, with 470 outbreaks deemed “out of control” by August. Siberia and Alaska are also confronting active fire seasons.
For Arctic communities, the physical impacts of smoke exposure, the toll of evacuations and destruction, and the threats to cultural traditions compound the danger of extreme fires. But Indigenous science and cultural traditions offer a path towards justice and resilience.
Climate change and colonial histories fuel the fire
Climate change has created hotter and drier conditions in the north, increasing the frequency and intensity of Arctic-boreal wildfires. These wildfires amplify global warming, creating a feedback loop by burning deep into permafrost, a carbon-rich soil, and releasing stored carbon dioxide and methane into the atmosphere. A recent study led by Permafrost Pathways researchers found that wildfire has contributed to the Arctic’s shift from a net absorber to a net emitter of carbon. That increase in emissions in turn fuels even more fires. Between 2003 and 2023, the Arctic-boreal region saw a sevenfold increase in extreme wildfires.
“Things have really changed in our traditional territories,” said Woodwell Climate’s Adaptation Specialist, Brooke Woods. Woods is a Tribal member from Rampart, Alaska, and she currently lives in Fairbanks, Alaska. “We had two fires close to Rampart this summer. We’ve had back-to-back fires over the past three summers. Growing up, I don’t ever recall back-to-back wildfires surrounding our communities.”
The increase is also due, in part, to increased lightning strikes, which are occurring more frequently as warming temperatures further destabilize atmospheric conditions, leading to more storms that produce lightning.
“Our summers are drier and we’re having more severe heat events as well as more intense lightning and thunderstorms now, too,” said Woods. “When we had the fire in Rampart, in the midst of this wildfire, one of the storms actually produced 1600 lightning strikes across Alaska.”
The history of colonialism in North America has also played a role in today’s extreme wildfire regimes. For millennia, Indigenous Peoples across the Arctic practiced cultural burning—using small, controlled fires to manage the land, reduce dry fuel buildup, and prevent large, catastrophic wildfires. These practices not only protected ecosystems but also supported biodiversity and were deeply rooted in cultural knowledge and tradition. However, colonization disrupted these systems as Indigenous communities were forcibly removed from their lands, and cultural burning was often banned and criminalized altogether.
“Elders risked jail time for burning,” Dr. Amy Cardinal Christianson told Chatelaine Magazine. Christianson is a Metis wildfire expert and Policy Advisor for the Indigenous Leadership Initiative who co-hosts the podcast Good Fire and serves on the board of the International Association of Wildland Fire. “That’s how badly they knew that the land needed to burn.”
This erasure, combined with colonial fire suppression tactics, has led to the accumulation of flammable undergrowth that makes the land more vulnerable to intense and widespread fires.
Smoke, displacement, and cultural survival
Increasingly active Arctic-boreal wildfires are not just environmental disasters, they’re also cultural and human crises.
Wildfire smoke—which can contain soot and high levels of mercury— threatens the health of Arctic communities and can put vulnerable groups, like elders, young children, and those with pre-existing health conditions, at prolonged risk well after the fires have gone out.
“In my baby’s first year of life in 2023, we had such bad air quality [in Fairbanks]. It impacted his respiratory system, and it was just so hard for him to be able to nurse,” said Woods. “I was even considering driving 300 miles to the next urban area to get him to clean, healthy air because there was also a fire in Rampart. It impacted our safety in both of the places that we call home.”
The mental toll of wildfires can also be just as devastating as the physical impacts, as communities must navigate evacuation logistics, loss, and displacement with very little governmental support.
“Communities are thinking about how the wildfire crisis is real—it’s driven them from their home and maybe destroyed their home—they’re thinking ‘what else am I going to lose’?” said Edward Alexander, Senior Arctic Lead at the Woodwell Climate Research Center, Chair of Gwich’in Council International, and Co-Chair of the Arctic Council’s Expert Group on Wildland Fire. “Then, becoming unhoused… people lose their jobs, their businesses, or their investments. They lose forward momentum in their life.”
In addition, evacuation is far more complicated in the Arctic. Many remote communities and villages in Alaska and Canada either have only one main road or aren’t connected to road systems at all, making them accessible only by plane or boat, which presents a logistical and financial challenge for mass evacuation. The combined impacts of smoke, heat, and economic insecurity can also present impossible choices.
“If you look at not only the health disparities but your income, what can you afford to keep yourself healthy?” said Woods. “Can you afford air filters for your home? Can you afford and have access to air conditioners with filters? Because not only are you battling the smoke, but you’re also battling this heat. So just navigating those at different income levels can be very complex.”
Fire doesn’t just destroy infrastructure and threaten health and well-being, it also disrupts Indigenous ways of life, cultural connections to land, intergenerational knowledge sharing, language revitalization, and cultural history tied to specific places like hunting trails, fish camps, and seasonal migration.
“When we were still able to subsistence fish in Alaska, and had wildfires at the same time, there were community members in Rampart that were not able to meet all of their subsistence needs due to wildfires,” Woods said.
Traditional solutions for modern problems: A return to cultural burning
In Good Fire, Christianson discusses ways to restore the modern world’s broken relationship with fire and the need to integrate systems that not only respond appropriately but are also proactive and predicated on Indigenous Knowledge and expertise. This is where cultural burning offers a way forward—a way to view fire not as a threat, but as a critical tool for keeping land healthy and communities safe.
The First Nations Emergency Services Society (FNESS) and the Indigenous Leadership Initiative (ILI) recently released the “Create a Cultural Burn Pathway” workbook to support Indigenous communities in creating cultural burn programs to reduce wildfire risk and maintain healthy connections to the land.
“Fire doesn’t have to be scary,” said Christianson in a video produced by the Indigenous Leadership Initiative. “It doesn’t have to be something we live in fear of every summer. We can have a better relationship with fire that can have really important benefits.”
Traditional burning is a culturally grounded, community-empowered, and ecologically practical approach to managing and mitigating wildfire risk in the North, born from generations of Traditional Ecological Knowledge. Unlike conventional fire suppression, which often seeks to eliminate fire altogether, cultural burning is a proactive, place-based practice rooted in Indigenous governance, values, and ecological understanding. These approaches aren’t about fighting fire—they’re about embracing it to foster sovereignty, revitalize knowledge, and deepen connection to the land.
Beyond the health of the land and forests, cultural fire also contributes to cultural resilience and maintains Indigenous connections to land and community. Cultural burns ensure practices are guided by traditional protocols and adapted to local ecosystems. Community members, including youth, are involved—passing knowledge between generations and restoring cultural roles that were disrupted by colonization.
Which is why, according to Alexander, placing the emphasis on the health of the forest, ecosystems, and community overall, rather than on controlling fire, should be the real goal.
“We should be thinking a little differently,” Alexander said. “Cultural fire is a tool, but fire is not the emphasis. It’s the health of the forest, it’s the health of the land, it’s the health of the animals and birds, it’s the health of our peoples and communities. That’s the emphasis.”
From ‘wildfire to mildfire,’ Indigenous fire stewardship as a path forward
Cultural burning is just one part of the solution, which will involve moving away from colonial fire suppression methods altogether and supporting Indigenous-led fire stewardship models with meaningful changes in policy and funding. Woods says she’d like to see Indigenous-led fire programs represented as part of a broader recognition of Indigenous sovereignty in the North.
“I’d like to see more local people leading the work rather than just renting out their equipment or hiring them as boat captains,” Woods said. There are more opportunities for Indigenous People to help their own communities. I feel there’s always time to course correct and really acknowledge and honor the 229 Tribes of Alaska and their practices that have maintained very healthy land and ecosystems for so long.”
In Alaska, Indigenous-led wildfire initiatives—like the U.S. Bureau of Land Management (BLM) Emergency Firefighter (EFF) program—create opportunities for local members of Alaska Native communities to join crews and integrate their traditional knowledge and expertise of the land to help keep their communities safe. In Canada, Fire Guardian programs—which Dr. Christianson has long been advocating for—aim to get good fire back on the land through Indigenous stewardship and traditional practices.
Alexander says he hopes recognizing cultural burning and other forms of Indigenous Knowledge as legitimate science will help prioritize them in land management.
“It’s critically important science that we need to help us manage the wildland fire crisis in the circumpolar north,” said Alexander.
Alexander imagines a future where wildfire becomes mildfire. Where communities in the north are adequately resourced and wildfire management becomes proactive and rooted in Indigenous Knowledge and expertise, while prioritizing and supporting sovereignty.
“Indigenous fire management looks like a vibrant landscape where you don’t have severe wildland fire, but you have increased biodiversity, where the vegetation is more nutritious for the plants and animals, and that permafrost and other hugely important resources are protected,” Alexander said. “I also think that it’s an integral part of respecting the sovereignty of Indigenous Peoples, of respecting the self-determination of Indigenous Peoples to manage our territories how we see fit, and I think that it’s a really critical approach that we need to all be listening to. Our collective future really depends on it.”
In the northern ecosystems of the Alaskan boreal forest and tundra, wildfire is a natural – and even necessary – process. But as temperatures rapidly warm, wildfire frequency and severity in the state are breaking historical records.
Scientists at Woodwell Climate Research Center are studying the effects of these increased fires on the ecosystem. In a study published earlier this year, a research team led by Research Scientist Dr. Scott Zolkos examined the relationship between northern wildfires and one concerning byproduct of them: mercury pollution.
Higher temperatures, more wildfires, more pollution
In the last 25 years, Alaska has experienced some of the worst fire seasons on record. One of the reasons behind this is that climate change is hitting the north harder than other regions.
Northern latitudes, including the Arctic and boreal regions, are warming three to four times faster than the rest of the planet. As warmer temperatures melt snow earlier in the year and dry out soil and vegetation, the fire season lengthens and intensifies. According to Woodwell scientists, 2024 was the second-highest year for wildfire emissions north of the Arctic Circle.
“It’s really sort of a new phenomenon, the level of burning we’re seeing in the tundra,” Dr. Brendan Rogers, Senior Scientist, says.
Increasing fires means increasing air, water, and ecosystem pollution from the byproducts of burning vegetation and soils. Mercury is a toxic pollutant in wildfire smoke, but there is sparse research on mercury release from northern peatland wildfires which means scientists don’t yet have a great understanding of how increasing northern wildfire activity could counteract efforts to curtail human-caused mercury release. To understand these impacts, Zolkos and collaborators studied areas of the Yukon-Kuskokwim (YK) Delta in southwestern Alaska— a peatland environment that burned in 2015. The summer of 2015 made history as one of Alaska’s worst fire seasons, with over 5 million acres of land burned.
The research team used peatland soil samples that were collected between 2016 and 2018 by undergraduate participants of The Polaris Project to measure mercury. They then used the new mercury data together with organic carbon and burn depth measurements from another recent study to develop models that predicted mercury emissions from the 2015 wildfires.
Measuring mercury release
Mercury continuously cycles through the environment in air, water and soil, often changing between liquid and gaseous forms. It enters the atmosphere as emissions from human activities like the burning of fossil fuels and natural processes like wildfires and volcanoes. High levels of mercury can accumulate in the ground when vegetation takes up mercury from the atmosphere, then decomposes and deposits it into the soil. In northern peatlands, mercury has been accumulating with organic matter for thousands of years.
Mercury emissions occur when wildfire burns organic matter in soil and releases mercury that is bound to it back into the atmosphere. With increased temperatures and wildfire activity, the stabilization accumulation of mercury in the soil is threatened – and so is air quality.
“There are huge mercury stores in northern peatlands,” Zolkos says. “If peatlands burn more, it could potentially offset global efforts to reduce human mercury release into the environment.”
Zolkos and collaborators found that levels of mercury in peat in the YK Delta were similar to those in peatlands elsewhere in the north. Using an atmospheric chemical transport model developed by collaborators, the researchers also found that mercury deposition within 10 kilometers of wildfire sites was two times higher than normal, even though the majority of emissions from the fire traveled beyond Alaska.
With this information, Zolkos believes that increasing fire activity has the potential to unlock large amounts of soil-bound mercury in the North. The challenge now is figuring out exactly how much mercury is being released and where it ends up.
As a step to understanding this, Zolkos is leading a pilot project to develop an atmospheric mercury monitoring network across wildfire-susceptible peatlands in Alaska and Canada. Twenty-six air samplers, which collect mercury molecules in the air, were deployed at seven sites in Arctic-boreal peatlands across Alaska and Canada during the summers of 2024 and 2025. After the 2025 summer season is complete, the samplers will be sent to a lab at Harvard University, where Zolkos will measure their mercury content.
“Our goal is to work with collaborators to deploy these simple and cost-effective samplers that capture mercury in the atmosphere,” Zolkos says. “And from that, we can back-calculate the concentration of mercury in the air to understand wildfire impacts.”
By studying trends, Zolkos can compare levels of mercury in the air in areas affected and not affected by wildfire. And with added contextual data, scientists can model how much mercury might have been released from the soil and vegetation by wildfire.
Understanding wildfire impacts on air quality
In addition to containing mercury, wildfire smoke also emits particulate matter (PM2.5). PM2.5 refers to particles that are smaller than 2.5 micrometers in diameter – thirty times smaller than the average human hair. When breathed in, they can affect the heart and lungs and cause a variety of health problems, including aggravated asthma, decreased lung function, and increased respiratory symptoms.
Together with collaborators from the Permafrost Pathways project, Zolkos is also collaborating with Alaska Native communities to install PurpleAir sensors, a system of particulate matter monitors, to support tribally-led wildfire air pollution monitoring. This project helps to address monitoring needs in Alaska, where nearly 90% of rural communities reached or exceeded unhealthy levels of PM2.5 at least once due to wildfire in the last two decades.
“It’s a really great opportunity to work together with Alaskan Native communities and also to share knowledge, learn from them, and try and help them with any needs that they have for environmental monitoring,” Zolkos says.
So far, particulate matter sensors have been deployed in Pond Inlet in Nunavut, Canada, Churchill in Manitoba, Canada, and Akiachak, Alaska.
“The complex impacts of wildfire on Arctic and global communities is not something that can be solved by taking a measurement and seeing a number alone. These climate health impacts require a more holistic way of thinking and doing research” Dr. Sue Natali, Senior Scientist and lead of the Permafrost Pathways project, says. “What gives me hope is that the Western scientific community is now listening and hearing more from Indigenous partners to co-produce research to support climate resilient communities,”
When I started at Woodwell Climate, I had very little personal or professional experience with boreal wildfire. I was a forest ecologist drawn to this space by the urgency of the climate crisis and the understanding that northern ecosystems are some of the most threatened and critical to protect from a global perspective. More severe and frequent wildfires from extreme warming are burning deeper into the soil, releasing ancient carbon and accelerating permafrost thaw. Still largely unaccounted for in global climate models, these carbon emissions from wildfire and wildfire-induced permafrost thaw could eat up as much as 10% of the remaining global carbon budget. More boreal wildfire means greater impacts of climate change, which means more boreal wildfire. But when I joined the boreal fire management team at Woodwell, the global picture was the extent of my perspective.
This past June, under a haze of wildfire smoke with visible fires burning across the landscape, Woodwell Climate’s fire management team made our way back to Fort Yukon, Alaska. Situated in Yukon Flats National Wildlife Refuge at the confluence of the Yukon and Porcupine Rivers, this region is home to Gwich’in Athabascan people who have been living and stewarding fire on these lands for millennia. Our time there was brief, but it was enough to leave us humbled by the reality that the heart of the wildfire story—both the impacts and the solutions—lie in communities like Fort Yukon.
We listened to community members and elders tell stories about fire, water, plants, and animals, all of which centered around observations of profound change over the past generation. As we shared fire history maps at the Gwichyaa Zhee Giwch’in tribal government office, we were gently reminded that their knowledge of changing wildfire patterns long preceded scientists like us bringing western data to their village. We learned that fire’s impact on critical ecosystems also affects culture, economic stability, subsistence, and traditional ways of life. Increasing smoke exposure threatens the health of community members, particularly elders, and makes the subsistence lifestyle harder and more dangerous. A spin on the phrase “wildland urban interface,” Woodwell’s Senior Arctic Lead Edward Alexander coined the phrase “wildland cultural interface,” which brilliantly captures the reality that these fire-prone landscapes, culture, and community are intertwined in tangible and emotional ways for the Gwich’in people.
“There’s too much fire now” was a common phrase we heard from people in Fort Yukon. Jimmy Fox, the former Yukon Flats National Wildlife Refuge (YFNWR) manager had been hearing this from community members for a long time, along with deep concerns about the loss of “yedoma” permafrost, a type of vulnerable permafrost with high ice and carbon content widespread throughout the Yukon Flats. With the idea originating from a sharing circle with Gwich’in Council International, in 2023 Jimmy enacted a pilot project to enhance the fire suppression policy of 1.6 million acres of yedoma land on the Yukon Flats to explicitly protect carbon and climate, the first of its kind in fire management policy. He was motivated by both the massive amount of carbon at risk of being emitted by wildfire and the increasing threats to this “wildland cultural interface” for communities on the Yukon Flats.
Ever since I met Jimmy, I have been impressed by his determination to use his agency to enact powerful climate solutions. Jimmy was also inspired by a presentation from my postdoctoral predecessor, Dr. Carly Phillips, who spoke to the fire management community about her research showing that fire suppression could be a cost-efficient way to keep these massive, ancient stores of carbon in the ground. Our current research is now focused on expanding this analysis to explicitly quantify the carbon that would be saved by targeted, early-action fire suppression strategies on yedoma permafrost landscapes. This pilot project continues to show the fire management community that boreal fire suppression, if done with intention and proper input from local communities, can be a climate solution that meets the urgency of this moment.
“Suppression” can be a contentious word in fire management spaces. Over-suppression has led to fuel build up and increased flammability in the lower 48. But these northern boreal forests in Alaska and Canada are different. These forests do not have the same history of over-suppression, and current research suggests that the impacts of climate change are the overwhelming driver of increased fire frequency and severity. That said, fire is still a natural and important process for boreal forests. The goal with using fire suppression as a climate solution is never to eliminate fire from the landscape, but rather bring fires back to historical or pre-climate change levels. And perhaps most importantly, suppression is only one piece of the solution. The ultimate vision is for a diverse set of fire management strategies, with a particular focus on the revitalization of Indigenous fire stewardship and cultural burning, to cultivate a healthier relationship between fire and the landscape.
The boreal wildfire problem is dire from the global to local level. But as I have participated in socializing this work to scientists, managers, and community leaders over the past year, from Fort Yukon, Alaska to Capitol Hill, I see growing enthusiasm for solutions that is not as widely publicized as the crisis itself. I see a vision of Woodwell Climate contributing to a transformation in boreal fire management that has already begun in Indigenous communities, one that integrates Indigenous knowledge and community-centered values with rigorous science, and ends with real reductions in global carbon emissions. Let’s begin.
As the Arctic heats up three to four times faster than the rest of Earth, hotter temperatures have super-charged northern fires, causing them to burn more area, more frequently, and more intensely.
These fires have a range of harmful impacts on communities, ecosystems, and wildlife in the north. When it comes to carbon, they represent a unique now-and-future threat to global climate. That’s because much of the boreal forest, which circles the high northern latitudes, is underlain by carbon-rich frozen ground called permafrost. Stocked with carbon from dead animal and plant matter that’s accumulated over hundreds to thousands of years, permafrost functions as Earth’s “deep freezer,” keeping the planet cool by keeping carbon out of the atmosphere.
When permafrost thaws, microbes begin to access and break down the once-frozen carbon, releasing it to the atmosphere where it contributes to warming. Wildfires accelerate this process by burning off the organic soil layer that protects permafrost— opening the door on the freezer. And as temperatures in the north rise and boreal forests dry out and experience greater climate stress, the fires these forests evolved with have become more frequent and severe, with consequences for both permafrost and our climate.
Why are boreal forests important to climate?
The boreal forest, the largest forested biome on Earth, covers large stretches of North America, Europe, and Russia and stores 25% of the planet’s terrestrial carbon. Roughly 80% of this carbon is stored belowground in the form of soil organic matter and permafrost. So when the forest burns, the carbon released from the trees is just the tip of the iceberg. Eighty percent or more of carbon emissions from boreal fires in North America and in central Siberia come from belowground combustion of soil organic matter.
Boreal forests have been reliable safekeepers of this belowground carbon historically by providing an insulating soil organic layer that protects permafrost. But increasingly severe fires are changing that picture.
What happens to permafrost when the boreal burns?
Wildfires threaten this belowground carbon in boreal forests in multiple ways, both during and long after the fire itself.
As a fire burns, it combusts the carbon stored in trees and plants, releasing it into the atmosphere along with smoke and harmful pollutants. Intense fires also burn through duff and soil layers that carpet the forest floor.
Burning these insulating layers exposes the permafrost below to warmer temperatures for years after a fire. A recent synthesis study led by Postdoctoral Researcher Dr. Anna Talucci of Woodwell Climate found that in burned sites across the boreal and tundra regions, the depth of seasonally thawed ground increased for two decades after a fire.
That means that long after a fire is extinguished, permafrost is still thawing and releasing carbon in the form of carbon dioxide and methane. Where this ground is rich in ice, it can sink and collapse after a fire, causing ponding, erosion, and creating bogs and wetlands that release methane.
All of this carbon released to the atmosphere contributes to further warming, which in turn contributes to drying forests, hotter temperatures, and more lightning ignitions in the boreal forests. That’s because warming has boosted both lightning ignition efficiency, or the likelihood that lightning starts a fire, and the number of lightning strikes in the region.
Average yearly burned area across Alaska and Canada has roughly doubled since the 1960s. Emissions from Canada’s 2023 fire season exceeded total fossil fuel emissions from every other nation except the U.S., China, and India for that year. And the frequency of extreme wildfires across the circumpolar boreal region increased seven-fold from 2003 to 2023.
These trends, amplified by the permafrost-fire feedback, worsen both Arctic impacts and global emissions and could hamper our ability to meet agreed-on climate goals.
Gaps in boreal fire research
Wildfires in boreal forests are already weakening the region’s carbon storage capacity, signalling a crucial shift in the global climate system. Addressing critical gaps in our understanding of the fire-permafrost feedback will help prepare for such shifts and their local and global implications.
Research teams including Permafrost Pathways and collaborators are refining tools to predict what increasing fires mean for regional and global carbon emissions and climate targets. Such insights are needed to inform the Intergovernmental Panel on Climate Change’s (IPCC) inventory of global emissions, which does not yet include fire emissions or fire-caused permafrost thaw emissions. Efforts to better model and predict the complex interactions between permafrost and fire are also critical to informing adaptation and management responses.
The region’s vastness, as well as geopolitical conditions, presents challenges to collecting field data. Here, modeling can help scale the insights from what field data is available. And developing more accurate fire maps in Alaska and Siberia, where less burned area satellite data exists, could equip researchers and communities with better near-real-time information. Long-term monitoring efforts that study pre- and post-fire conditions, such as those led by Łı́ı́dlı̨ı̨ Kų́ę́ First Nation at the Scotty Creek Research Station, are providing critical insights about fire’s acute and long-term effects on permafrost.
What we can do: solutions that support resilience
The impacts from widespread severe northern wildfires transcend boundaries, affecting health and ways of life for communities living in the Arctic and around the globe.
But there are solutions at hand. Cultural burning, an important practice for many Arctic Indigenous communities, can help boreal forests build resilience by removing fuels with low-intensity seasonal fire. And collaborative management approaches that suppress fires in permafrost regions have been shown to be a cost-effective climate mitigation tool that has co-benefits for human health and the global climate.
But the most important solution to help keep the global wildfire-permafrost feedback loop in check is to reduce greenhouse gas emissions. Lowering overall emissions will slow rising temperatures in the north and give communities, boreal forests, and other ecosystems a better chance to recover and to adapt.
Each year at the Mountainfilm documentary film festival a mural is erected on a coffee shop in downtown Telluride, Colorado— a mountain mining town turned world-class winter sports destination. The festival showcases films with thought-provoking themes including environmental justice, Indigenous sovereignty, racial equity, and our collective responsibility to care for the natural world. These murals carry those themes year-round, becoming an integral part of Telluride’s main avenue and vibrant art culture. Past murals have been commissioned from artists including Shepard Fairey and Banksy.
This year, Woodwell’s lead cartographer Greg Fiske was selected to display his maps as art for the mural wall. The resulting piece, “Cartographies of Arctic Change”, will remain in place until next spring, and shows the rapidly changing Arctic landscape as seen by Fiske during the process of turning satellite imagery into data used by the Center’s climate scientists. Here, Fiske talks about his process and thinking behind the creation of this mural:
SR: How did this opportunity come about?
GF: It kind of came out of nowhere. I certainly wasn’t expecting it when they said, “we think your stuff would look great on this wall. What do you think?” And I said sure!
Of course, I’ve never created a map this size (26.5 by 36 feet), so I was eager to experiment. We had to go back and forth about which of the maps would best suit the space, yet also tell a story that leads viewers to our science here at Woodwell.
SR: How did you decide on the final image?
GF: I was told that whatever you put on the wall tends to influence the feeling that you get while you’re sitting there, having your coffee. [The shop owners] said that they made a mistake one year putting up an image of something cold like an iceberg, and it kind of made the whole place feel cold and dreary. So when we selected the maps, we had to make sure that they didn’t make people feel awkward while sitting there enjoying the outdoor space.
We came up with the idea of multiple maps in strips instead of one big map to be able to have each map show something different, but could all have a single theme and tell a story.
SR: What is that story?
GF: “Cartographies of Arctic Change”— it’s what we look at on a regular basis within our geospatial analyses, modeling, and science here at Woodwell that indicates rapid change in the Arctic.
Each one of these slices in the mural, in addition to being beautiful art, are also actually the data that goes into the models that drive Woodwell’s Arctic science.
The Arctic is one of the fastest changing landscapes on the planet— melting ice, thawing ground, lakes forming or draining, less snow and more fires— and you get a unique view of those changes when you spend so much time looking at geospatial data and satellite imagery.
I’m one of the people who pull in this raw data and prepare it for others who may be creating models or mapping some element of a landscape. I look at this data and make sure it’s the right format, quality, and resolution to satisfy the needs of models, but in doing so, there are many cases where I’m like, “Wow, this is really beautiful. Other folks should see the data at this stage, instead of just the final product.” So some of those images are what ended up in the mural. I hope it can give the many viewers who will see it a new perspective on the impacts climate change is having on one of the most beautiful regions of the world.
SR: What does it mean to you to have been selected to showcase that beauty through this mural?
GF: Of course it’s an honor. It’s interesting to think about something that I’ve seen so many times at screen size or social media size now being amplified to building size. I’m super thankful to the folks at Mountainfilm and Telco for displaying our work. I’ve never seen any of my maps in mural format and I won’t actually know how it’ll look until I get to Telluride and see it in person. I’m super excited!
In the Arctic, permafrost plays a crucial role in building infrastructure. However, as the region warms and permafrost thaws, infrastructure is threatened as the ground shifts beneath the built environment. Unfortunately, the full extent of the risks associated with this process is not yet realized, but researchers are working to address this knowledge gap.
Woodwell Climate Associate Scientist, Dr. Anna Liljedahl, along with UConn Department of Natural Resources and the Environment researchers Elias Manos and Assistant Professor Dr. Chandi Witharana developed a method that uses high-resolution satellite imagery and deep machine learning to map Alaskan infrastructure and more accurately project economic risks associated with permafrost thaw. Their findings published in Nature Communications Earth and Environment estimated that the costs of permafrost damage to infrastructure will double under low and medium emissions scenarios by 2050.
“Damages to infrastructure caused by permafrost thaw is on par with the average yearly cost of all natural disasters in the country, yet permafrost thaw is not recognized by the federal government as a natural hazard making it harder for people in Alaska to obtain disaster relief funding,” says Liljedahl.
This study is the latest from Witharana’s research group, which examines the ways satellites can help monitor changes in the Arctic landscape over time. According to Manos, in order to understand the hazards of a changing climate, we need a clear understanding of what’s at risk—in this case, vital structures like buildings and roads.
Permafrost serves as a structural foundation; piles are secured through it and buildings are often designed specifically to help the thermal integrity of this anchor layer. But the structural integrity of the layer, and consequently the structures above, is compromised as the permafrost thaws.
“When the temperature of permafrost starts to increase, piles start to shift out of place, and that’s what we call bearing capacity loss, or decrease in bearing capacity. That was the main hazard that we looked at which impacts buildings,” says Manos. “Then there’s also transportation infrastructure that’s primarily impacted by ground subsidence. When ice-rich permafrost thaws, the ground will cave in and that was the hazard we used to assess the disaster risk for roads.”
Previous studies have made risk estimates based on data from OpenStreetMap (OSM), which is one of the most widely used geospatial data sets available, says Manos. OSM is available for every nation across the globe, and information is updated by volunteers who manually input local data, like buildings, trails, roads, or other kinds of infrastructure, from high-resolution imagery on a global scale. For some regions, like Europe and parts of the United States, the data is accurate, says Manos, but that is not true for all locations. Unfortunately for the Arctic, OSM data is lacking.
“There are several previous risk studies that relied on this incomplete infrastructure data. It all goes back to the fact that infrastructure across the Arctic is not completely mapped, and that’s problematic if you want to understand disasters because you must have the full picture to understand the scale of what is or could potentially be exposed,” says Manos.
To fill in that picture, Witharana’s group developed a method to accurately map infrastructure and permafrost thaw risk called High-resolution Arctic Built Infrastructure and Terrain Analysis Tool (HABITAT). The model uses machine learning and AI to extract road and building information from high-resolution satellite images from the years 2018-2023. They compared the HABITAT data with OSM data to evaluate the new model’s quality and to look for potential misclassifications. Then they added the new information to OSM, nearly doubling the amount of information available for Alaska.
“The sheer amount of infrastructure and buildings that were missing from Open Street Map was, really shocking to me, 47% missing,” says Manos. “Though OpenStreetMap is a powerful volunteer-based resource, it has limitations and that is not a surprise.”
Witharana adds that by combining OSM data with the thousands of sub-meter resolution satellite images provided by the National Science Foundation, along with access to NSF supercomputing infrastructure, it was possible for the researchers to enhance the completeness of these datasets.
“We can see that impact and do better assessments of economic disturbances and risk so we can prepare for whatever policy actions or downstream efforts that are needed,” says Witharana “That’s a major outcome. Overall, the integration of AI and big data sets within our application has helped make useful, actionable products that researchers and communities can use right now.”
Witharana, Liljedahl, and Manos have plans to expand this analysis to account for the entire Arctic region to assess economic losses using a comprehensive infrastructure map.
“Alaska is decades behind the rest of the country in terms of geospatial data readiness. Maps are key for assessments and planning and I think the research community can help with some of that,” says Liljedahl.