Amazon Deforestation and Fire Update: November 2020
Escalating fires and widespread dry conditions raise concerns about forest degradation.
Deforestation and fires in the Brazilian Amazon drew international attention last year as they jumped to their highest level in over a decade. 2020 has been different, but no less extraordinary. October was a record-setting month for both deforestation and fires. In total, deforestation in 2020 has dropped to somewhat less than last year’s record extent, but is still above average. And because it is an extraordinarily dry year, fires are now greater than in any year since measurements began in 1998.
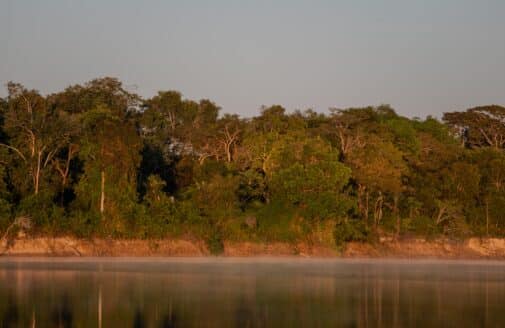
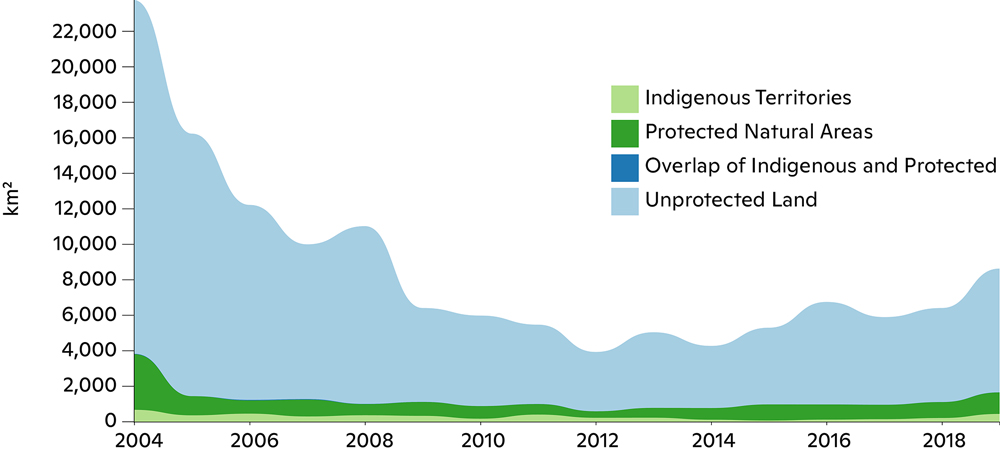
Amazon forests absorb and store roughly a tenth of human carbon dioxide emissions each year, but this critical carbon sink is threatened by deforestation and degradation of forest health. Deforestation in the Brazilian Amazon declined by 70% between 2004 and 2014. In recent years, however, deforestation has increased and fires have followed as people burn the trees they’ve recently cut down.
Building on the deforestation and fire data released regularly by Brazilian government scientists, we present an analysis of the carbon footprint of this year’s deforestation as well as where deforestation is happening and an analysis of the current climate conditions—key information for identifying fire risk hotspots and shaping solutions.
Climate / Drought
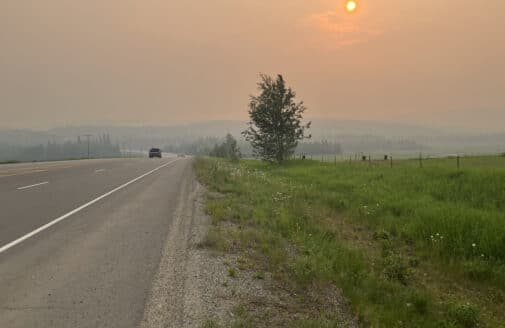
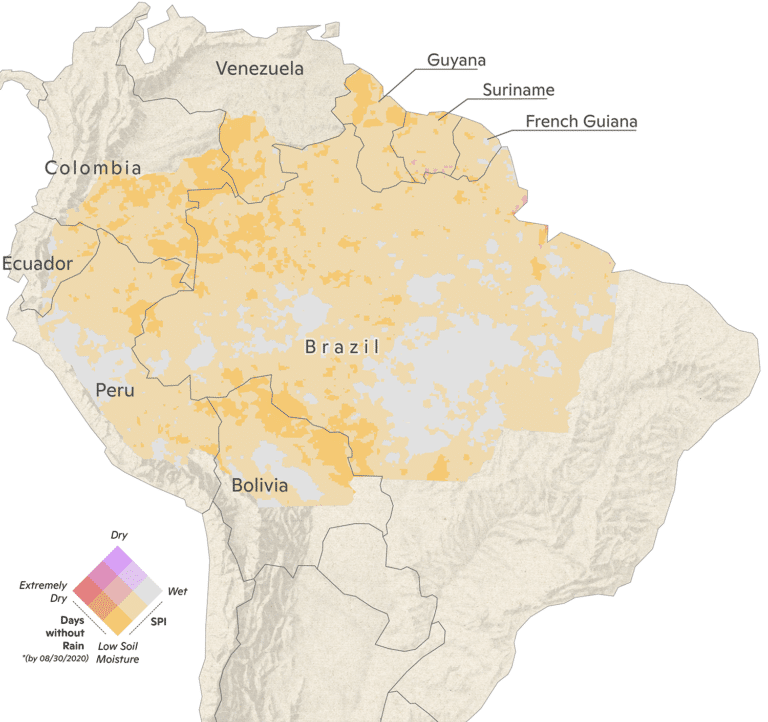
Forest fires are not a naturally occurring phenomenon in the Amazon—they are almost always a result of human activities. When deforestation coincides with dry conditions, fires lit to burn felled trees can escape into neighboring forests, destroying or degrading them. Large swaths of the Amazon region are anomalously dry this year (yellow). In particular, August, September, and October 2020 appear to be the driest in more than 20 years, creating conditions that favor large fires and severe damage to forests.
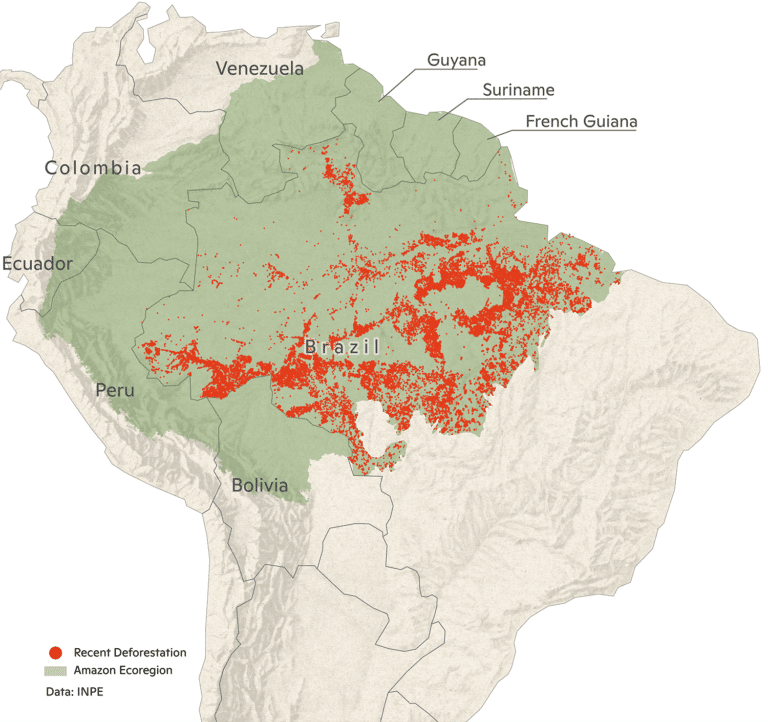
The red dots represent locations where deforestation has occurred since October 2019. We chose October as the cutoff because most areas that were deforested in this period will be burned this year.
Learn More
Climate conditions are represented by the Standardized Precipitation Index (SPI), which characterizes the meteorological drought for a period of 3 months, using monthly precipitation data (CHIRPS daily). At this time scale the index is closely related to soil moisture. It quantifies observed precipitation as a standardized departure from a selected probability distribution function that models the raw precipitation data. The SPI values can be interpreted as the number of standard deviations by which the observed anomaly deviates from the long-term mean. For the operational community, the SPI has been recognized as the standard index that should be available worldwide for quantifying and reporting meteorological drought.
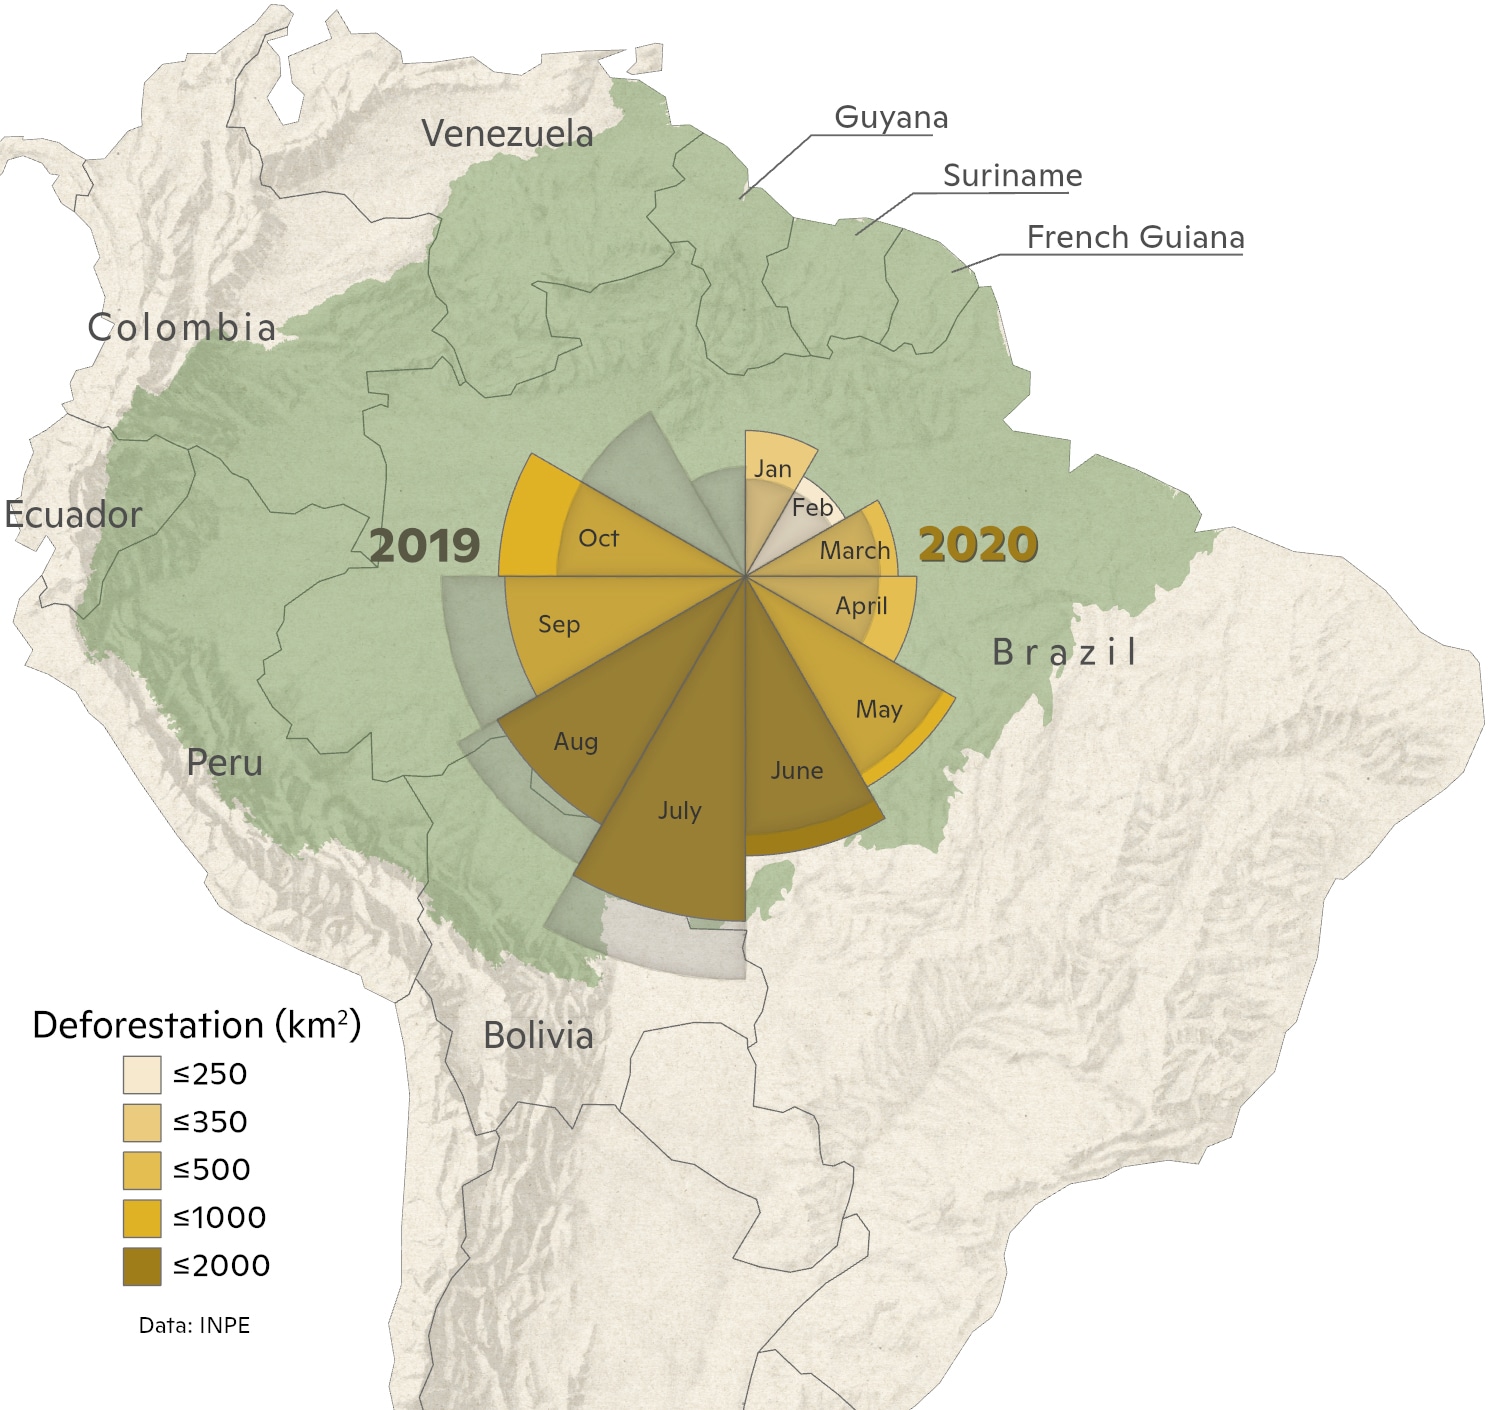
Deforestation
8,550 km2 of forest has been destroyed so far in 2020. Although the total so far this year is less than in 2019, October 2020 was 50% greater than in 2019. This year, as in previous years, most deforestation has taken place on unprotected lands, including private properties and federal lands without a protected status. However, deforestation in protected natural areas has been rising and accounts for 16% of deforestation to date this year, suggesting a need for greater enforcement of existing designations.
Learn More
Monthly estimates of deforestation in 2019 and 2020 are taken from the Brazilian national space agency Real-Time System for Detection of Deforestation (DETER). DETER estimates are provided each month, but are based on relatively coarse resolution MODIS satellite products. Therefore, values tend to be an underestimate.
Annual deforestation values from 2004-2019 are provided by the Brazilian national space agency Program to Calculate Deforestation in the Amazon (PRODES). The PRODES product is based on 30m resolution Landsat imagery and is therefore a more accurate representation of the total deforestation, but it can only be provided on an annual basis.
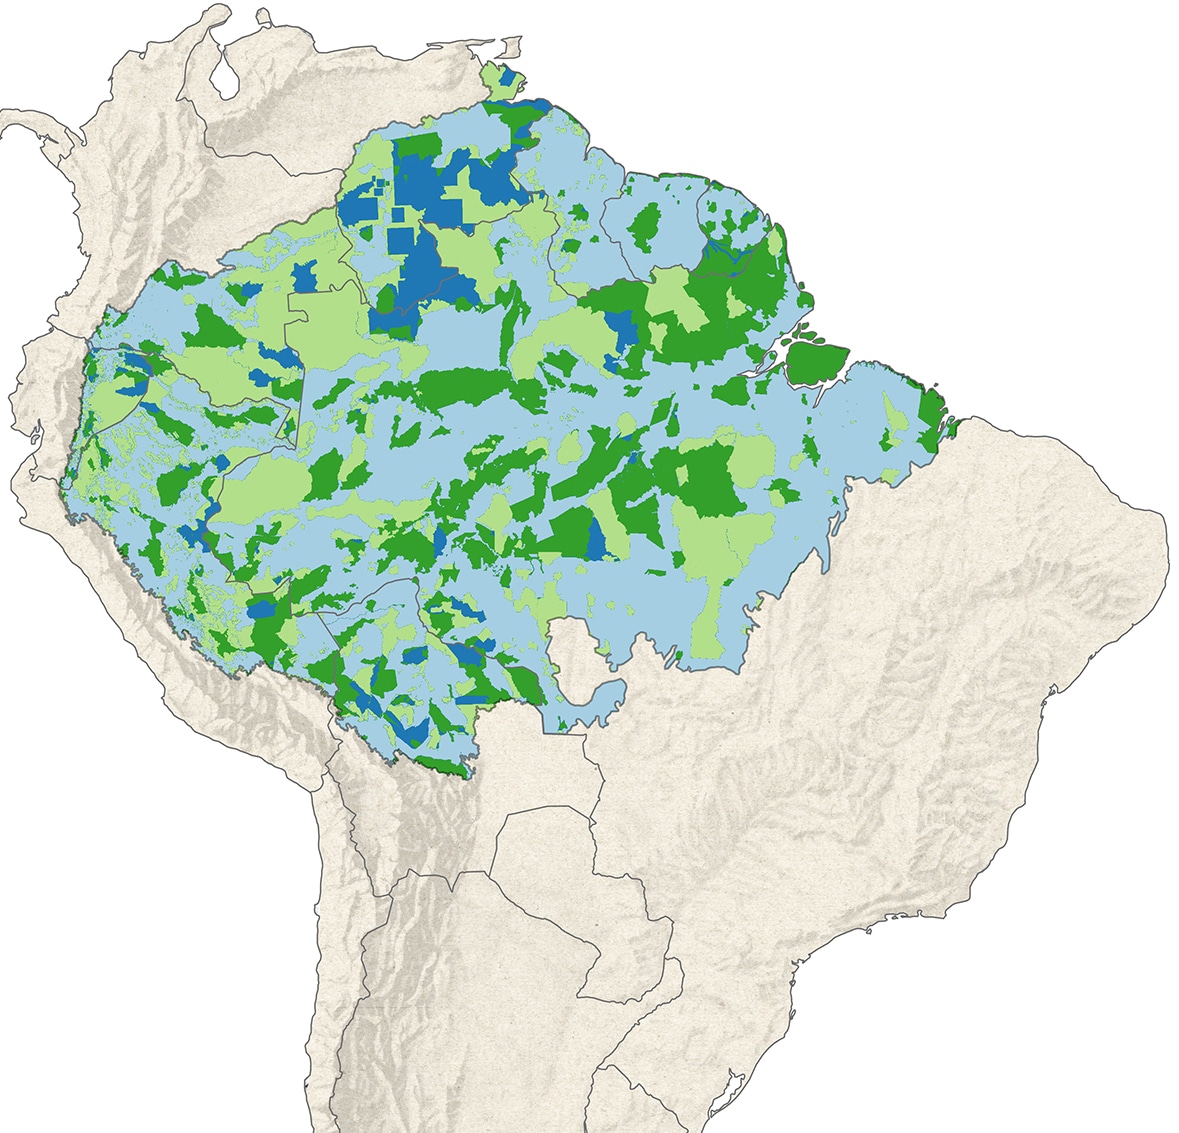
Deforestation by Land Tenure

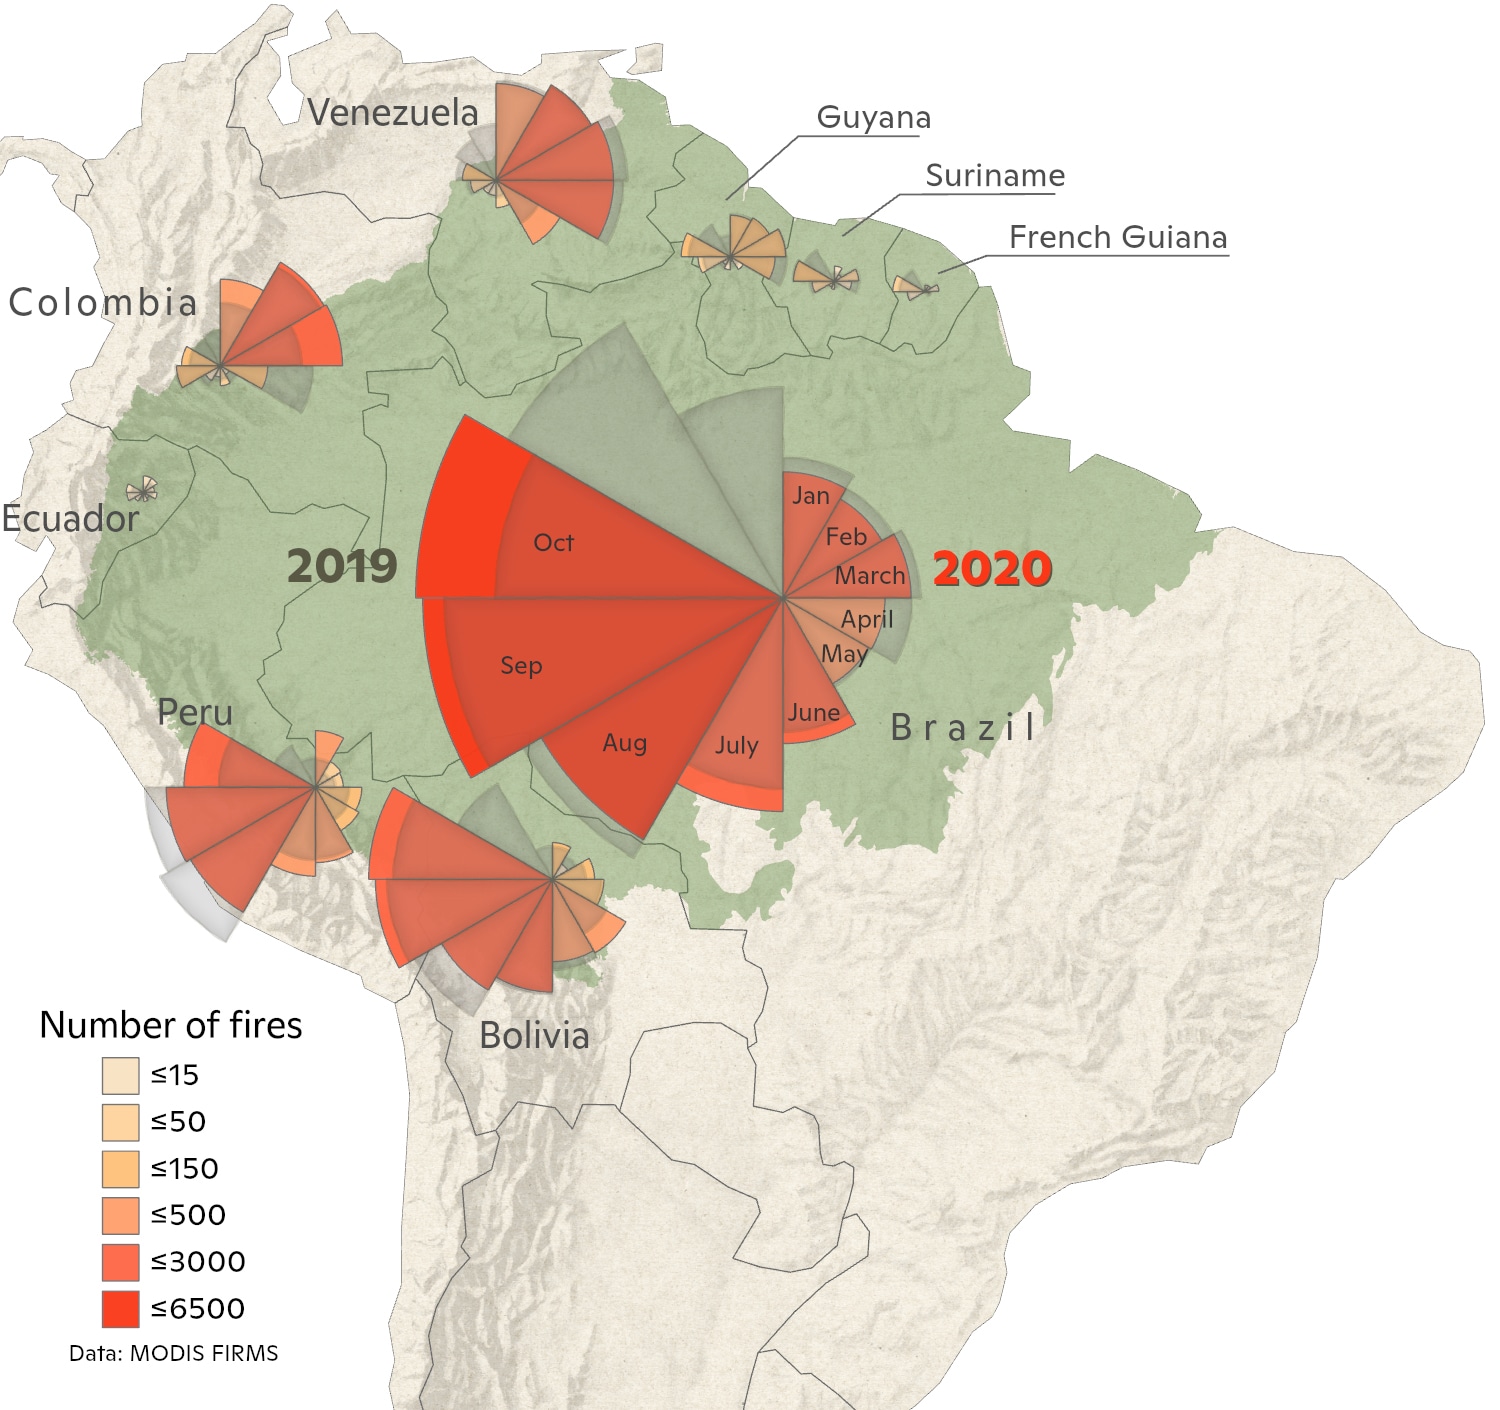
Fires
October is usually the month when fires begin to decrease in the Amazon. But that is not the case this year. We’ve counted almost 6500 fires this month compared to about 3600 in October 2019. This year appears to be on track to have more fires than ever recorded in the Amazon. This is a direct result of the continued high deforestation rates and the historic drought that has plagued much of Brazil this year. Interestingly, the drought and resulting fires are also consistent with the extreme number of tropical storms in the Atlantic this year. Anomalously warm ocean temperatures in the North Atlantic, which are associated with the large number of storms also draw the rainfall in South America further north than usual, leaving drought in its place. The last time we saw something comparable was in 2005 when the Atlantic set the previous record for number of storms and vast areas of the Amazon burned.
Learn More
We are using active fires hotspot data based on thermal information acquired from the Modis sensor on board the Aqua satellite with the afternoon daily passage. This is the reference satellite data used by the Brazilian National Space Agency to report fire activity in Brazil. The data is a detection of a fire front of at least 30m width and 1m height. All this information is available at Programa Queimadas Instituto Nacional de Pesquisas Espaciais.
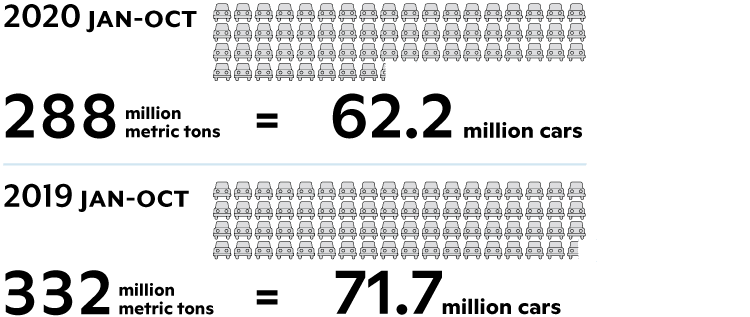
Committed Carbon
The burning of felled trees following deforestation results in the conversion of carbon previously stored in plant biomass (i.e., in leaves, branches, and stems) to carbon dioxide (CO2), contributing further to the rise in atmospheric CO2 that is the primary driver of planetary warming. In January-October 2020, CO2 emissions committed to the atmosphere as a result of forest clearing are expected to be roughly 288.3 million metric tons (MMT). That’s equivalent to roughly 62.2 million cars and is about 1/2 of Brazil’s annual total CO2 emissions.
Learn More
Learn more: See Walker et al., 2020, PNAS for details on carbon density calculations.
More Information
Heather Goldstone, Chief Communications Officer
Woodwell Climate Research Center
hgoldstone@woodwellclimate.org, 508-444-1553
Cristina Amorim, Head of Communications
IPAM Amazônia
cristina.amorim@ipam.org.br, +55 (61) 9 9127-6994