2020 Amazon Deforestation and Fire Outlook
Deforestation in the Brazilian Amazon declined by 70% between 2004 and 2014. In recent years, however, deforestation has increased and fires have followed as people burn the trees they’ve recently cut down. In 2019, deforestation jumped to the greatest rates in over a decade and fires did also, despite it being a relatively wet year. 2020 looks even worse. As part of our efforts to help reverse this problem we are presenting here the most current information on how much land has been deforested, where it has occurred, how many fires have burned, the current state of drought, and the amount of carbon that will eventually be released by degradation of these forests. The information will be updated every month to provide a clear picture of what is happening now and where actions must be taken. For now, we will have information only on Brazil, but in the coming months we will expand to all Amazon nations.
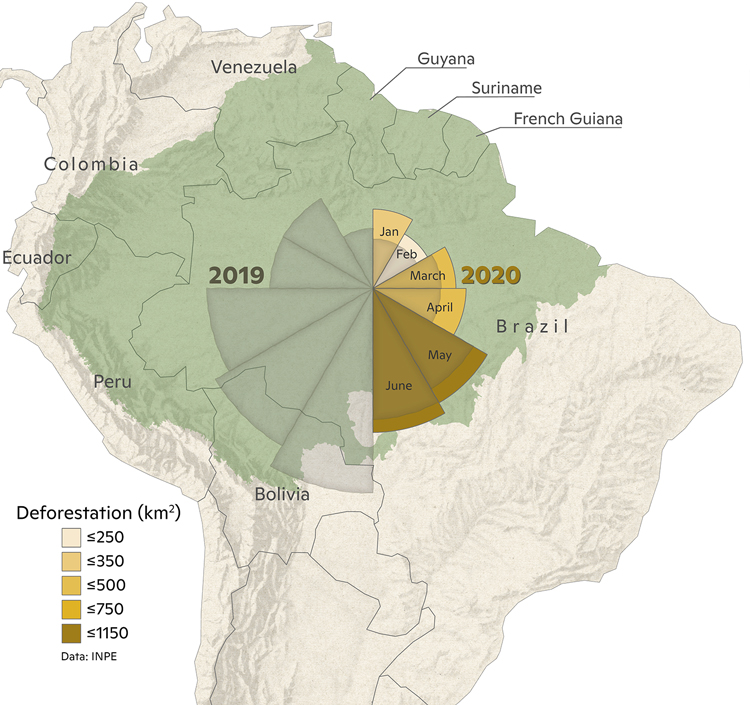
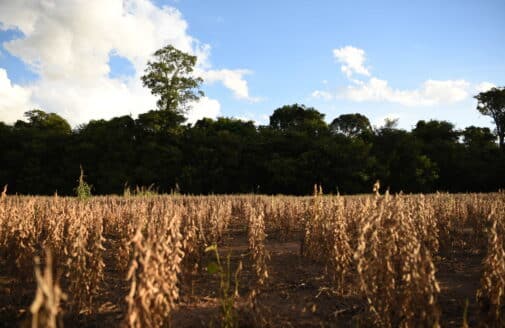
Deforestation
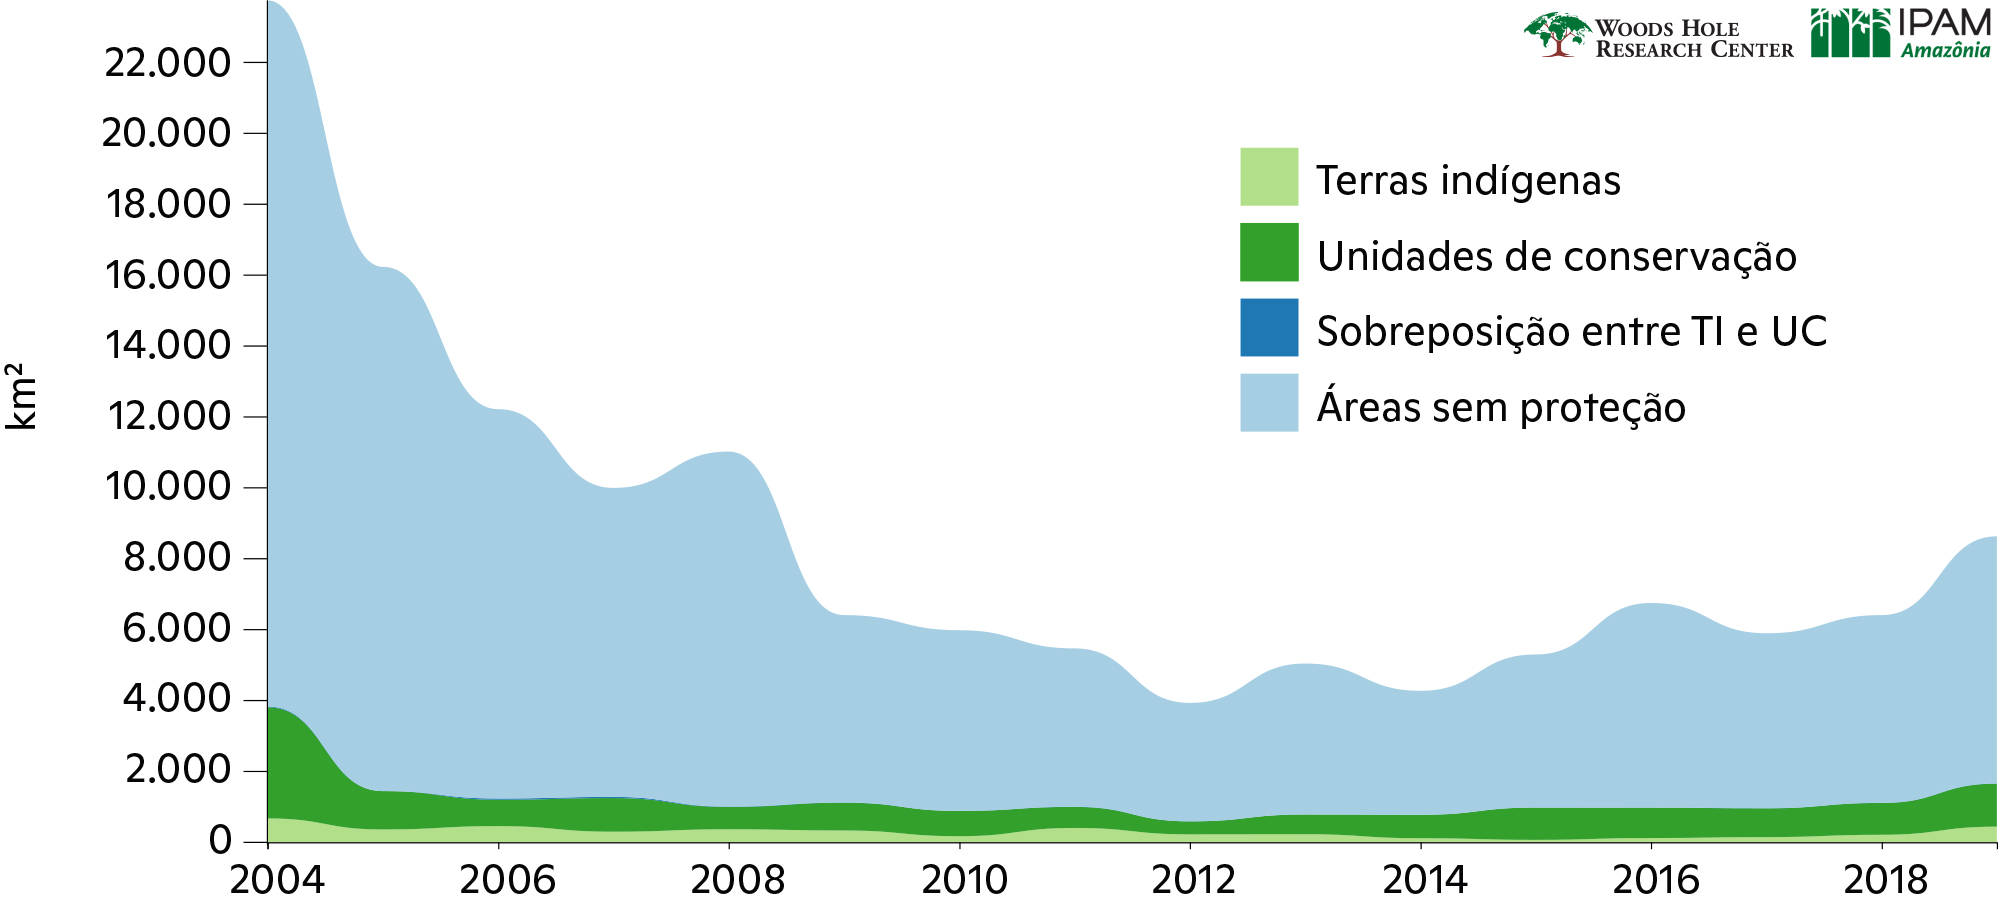
More than 3,300 km2 of forest has been destroyed so far this year. This year, as in previous years, almost all of that deforestation took place on unprotected lands, including private properties and federal lands without a protected status. Protected natural areas and indigenous territories have seen little deforestation. Already 2020 has roughly 20% more deforestation than 2019 at this point and we have to go back to 2008 to find a year with greater deforestation than 2019. Thus, 2020 is shaping up to be the worst year for deforestation in more than a decade.
Learn More
Monthly estimates of deforestation in 2019 and 2020 are taken from the Brazilian national space agency Real-Time System for Detection of Deforestation (DETER). DETER estimates are provided each month, but are based on relatively coarse resolution MODIS satellite products. Therefore, values tend to be an underestimate.
Annual deforestation values from 2004-2019 are provided by the Brazilian national space agency Program to Calculate Deforestation in the Amazon (PRODES). The PRODES product is based on 30-m resolution Landsat imagery and is therefore a more accurate representation of the total deforestation, but it can only be provided on an annual basis.
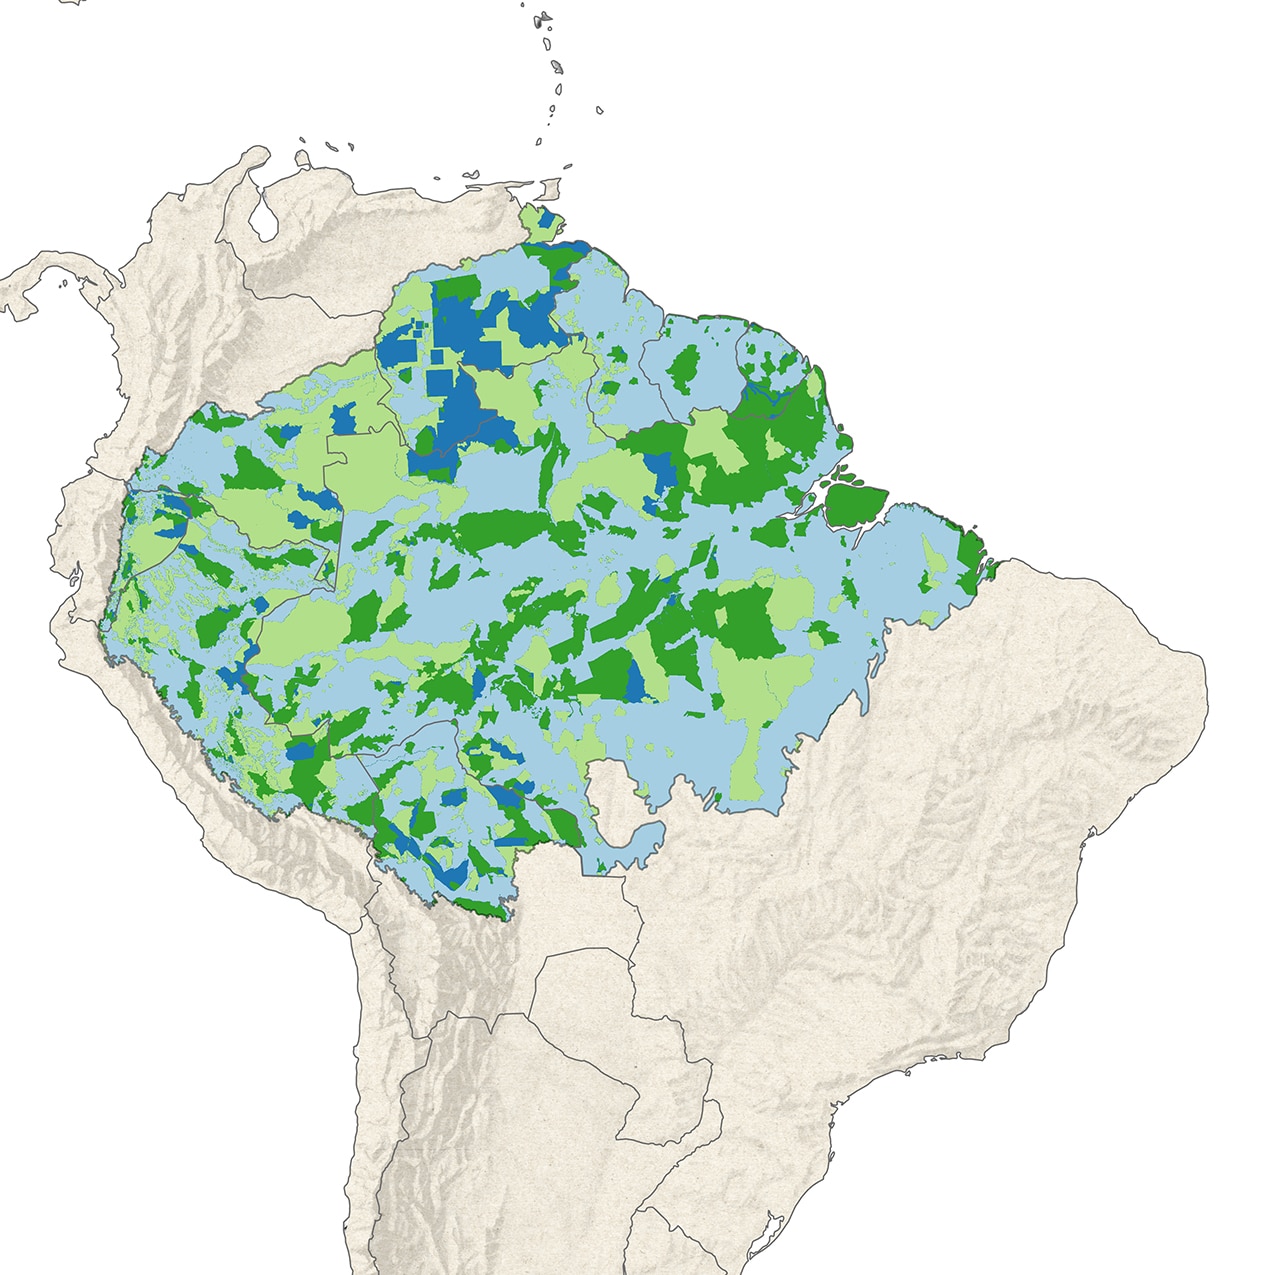
Deforestation by Land Tenure

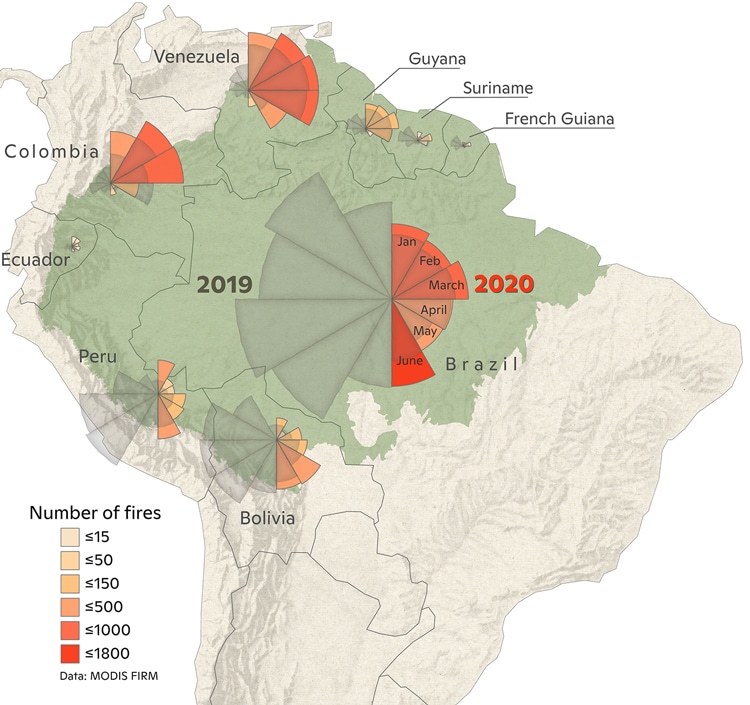
Fires
A modest number of fires have already been detected in Brazil so far this year. The fire season generally starts in earnest in July as the drier weather provides conditions needed to sustain fires. However, almost all Brazilian Amazon states have had more fires during the first six months of 2020 than the same period in 2019.
Learn More
We are using active fires hotspot data based on thermal information acquired from the Modis sensor on board the Aqua satellite with the afternoon daily passage. This is the reference satellite data used by the Brazilian National Space Agency to report fire activity in Brazil. The data is a detection of a fire front of at least 30m width and 1m height. All this information is available at Programa Queimadas Instituto Nacional de Pesquisas Espaciais.
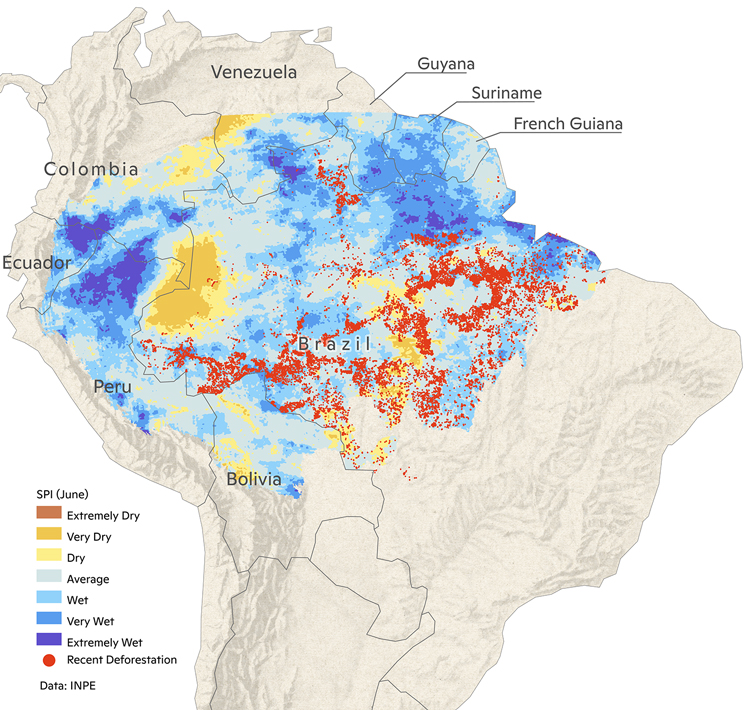
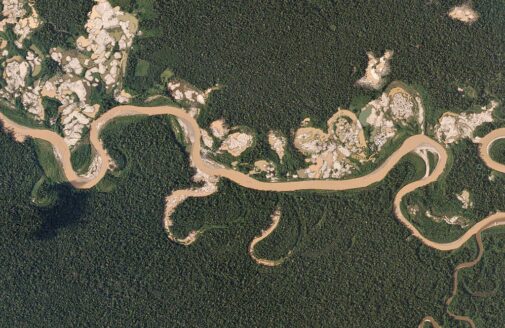
Climate / Drought
When deforestation coincides with dry conditions fires lit to burn felled trees often escape into neighboring forests destroying or degrading them. So far this year, most regions of the Amazon are still relatively wet (blue shades on map). However, one very dry region (yellow brown shades) in the southwestern Amazon is worrisome because it also coincides with recent deforestation (red dots). We will be watching and updating the climate of these regions in the coming months.
The red dots represent locations where deforestation has occurred since October 2019. We chose October as the cutoff because most areas that were deforested in this period will be burned this year.
Learn More
Climate conditions are represented by the Standardized Precipitation Index (SPI), which characterizes the meteorological drought for a period of 3 months, using monthly precipitation data (CHIRPS daily). At this time scale the index is closely related to soil moisture. It quantifies observed precipitation as a standardized departure from a selected probability distribution function that models the raw precipitation data. The SPI values can be interpreted as the number of standard deviations by which the observed anomaly deviates from the long-term mean. For the operational community, the SPI has been recognized as the standard index that should be available worldwide for quantifying and reporting meteorological drought.
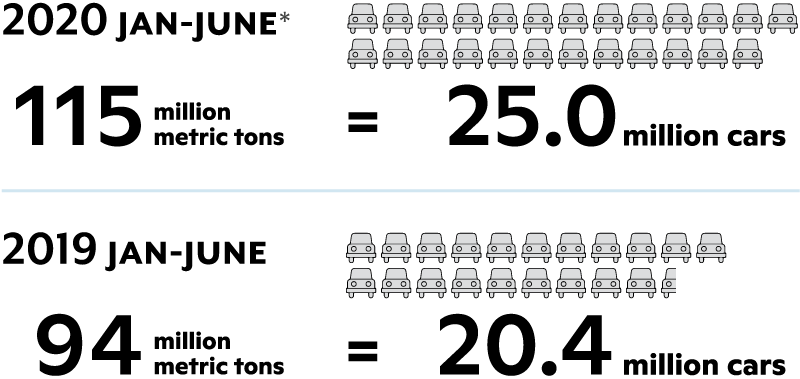
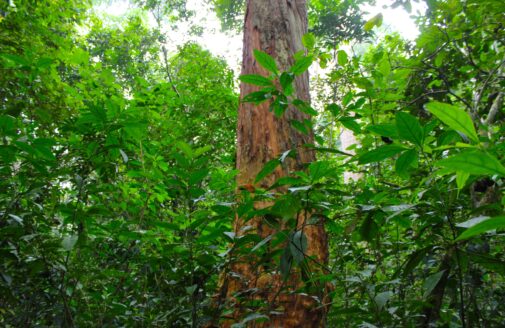
Committed Carbon
The burning of felled trees following deforestation results in the conversion of carbon previously stored in plant biomass (i.e., in leaves, branches, and stems) to carbon dioxide (CO2), contributing further to the rise in atmospheric CO2 that is the primary driver of planetary warming. In January-June 2020*, CO2 emissions committed to the atmosphere as a result of forest clearing and ongoing burning is expected to be roughly 20% higher than the same period in 2019, having increased from approximately 94 million metric tons (MMT) CO2 in 2019 to over 115 MMT CO2 in 2020.
* June includes June 1-25. Data for the remainder of the month is not yet available.
Learn More
Learn more: See Walker et al., 2020, PNAS for details on carbon density calculations.
More Information
Miles Grant, Director of Publications & Media Relations
Woodwell Climate Research Center
mgrant@woodwellclimate.org, 703-864-9599
Cristina Amorim, Head of Communications
IPAM Amazônia
cristina.amorim@ipam.org.br, +55 (61) 9 9127-6994