Five graphics that explain North America’s record heat wave

Above: Seattle, Washington was one state that broke heat records last week.
photo by Travis Wise
Last weekend, North America was hit by a record-breaking heat wave so hot that it has melted power cables and cracked or buckled roads. The Northwest United States and British Columbia have been hit particularly hard, straining emergency systems and causing a spike in sudden deaths.
The increased availability of near real-time data has made it easier than ever to visualize the scope and magnitude of this historic heat wave, as well as the underlying causes. Here is this week’s extreme heat in five graphics:
Daily Temperatures Exceed 100 Degrees Fahrenheit Across U.S.
High temperatures hit the west coast last weekend and continued to rise through the week, shattering many all-time records. British Columbia reached 116 degrees Fahrenheit on Sunday, June 27. By Monday, that record had been broken at 118 degrees, and again at 120 on Tuesday afternoon. Before Sunday, the entire country of Canada had not experienced recorded temperatures above 113 degrees.
The Northeastern U.S. has also been feeling the heat. On Wednesday Boston hit 100 degrees for the first time in over a decade. Statistically this extreme heat is a once-in-a-millennium type of anomaly, which means just a 0.001% chance of occurring. Equally strange is that these temperatures are happening in June. Because heat accumulates in the atmosphere, the hottest month in the Northern hemisphere is typically August.
map by Greg Fiske
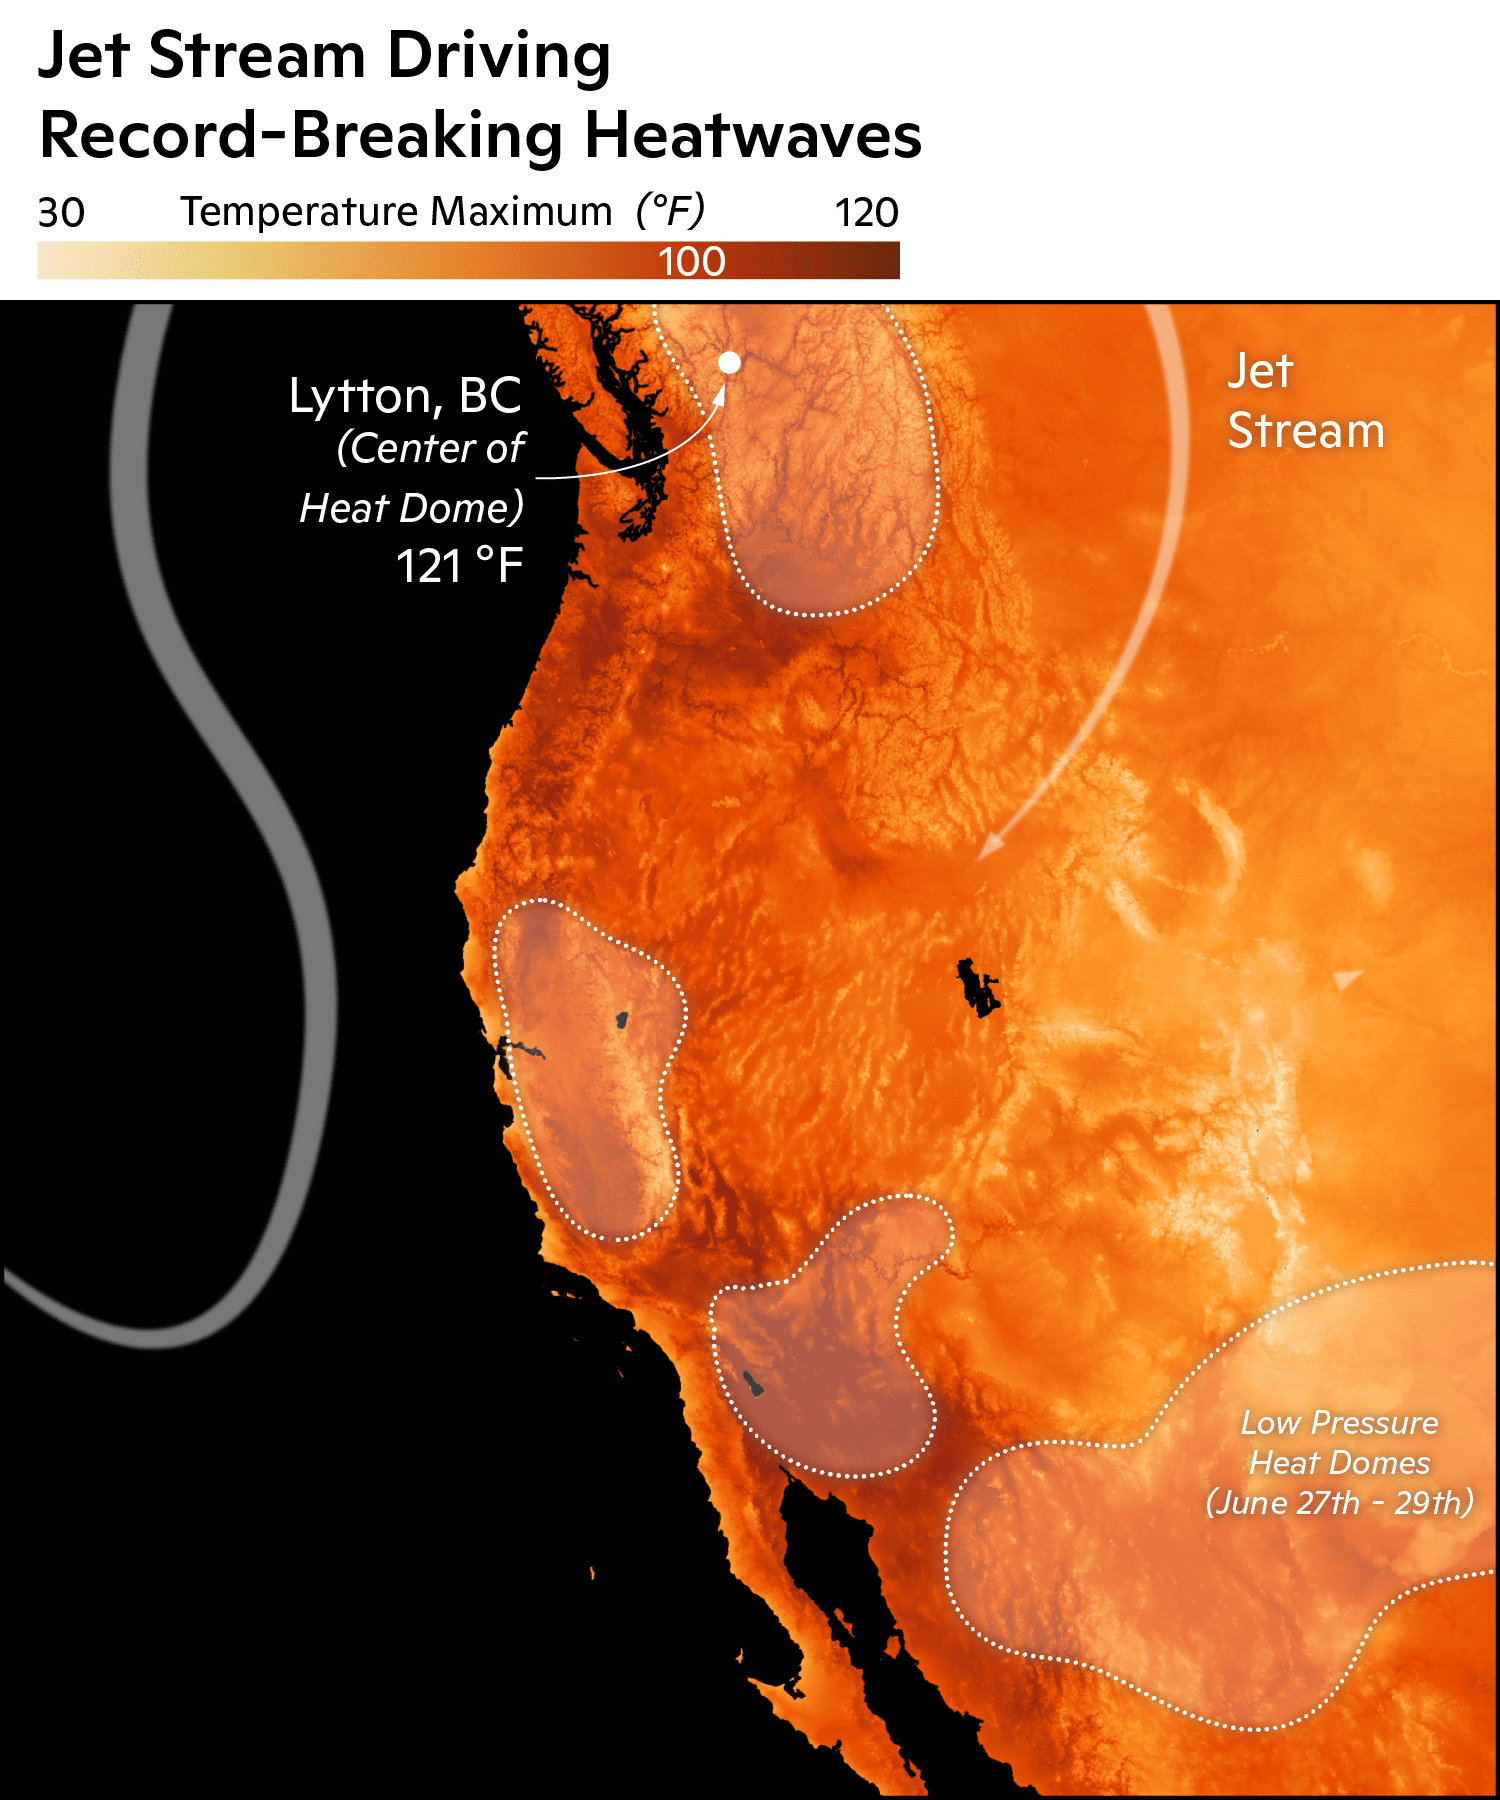
Jetstream’s Convoluted Pattern Causing Weather Extremes
The cause of these extreme temperatures is the contorted configuration of the jetstream winds this past week. Waves in the jetstream’s flow create high and low pressure areas. The large clockwise loop visible on the map–called a “block”– prevents the normal west-to-east movement of weather systems, leading to especially stubborn conditions and extremes. In this case, the strong high pressure system over the Northwest caused a so-called “heat dome. This is exacerbated as prolonged drought in Western states dries out the soil, allowing it to heat up more readily and further strengthen the heat dome.
Blocks during the summer have been more persistent in recent decades, likely a result of climate change. While researchers are still working to understand changes in blocks, likely culprits are the earlier loss of spring snow cover, drier soils, changing patterns of ocean temperatures, and a northward-shifted jetstream.
map by Carl Churchill
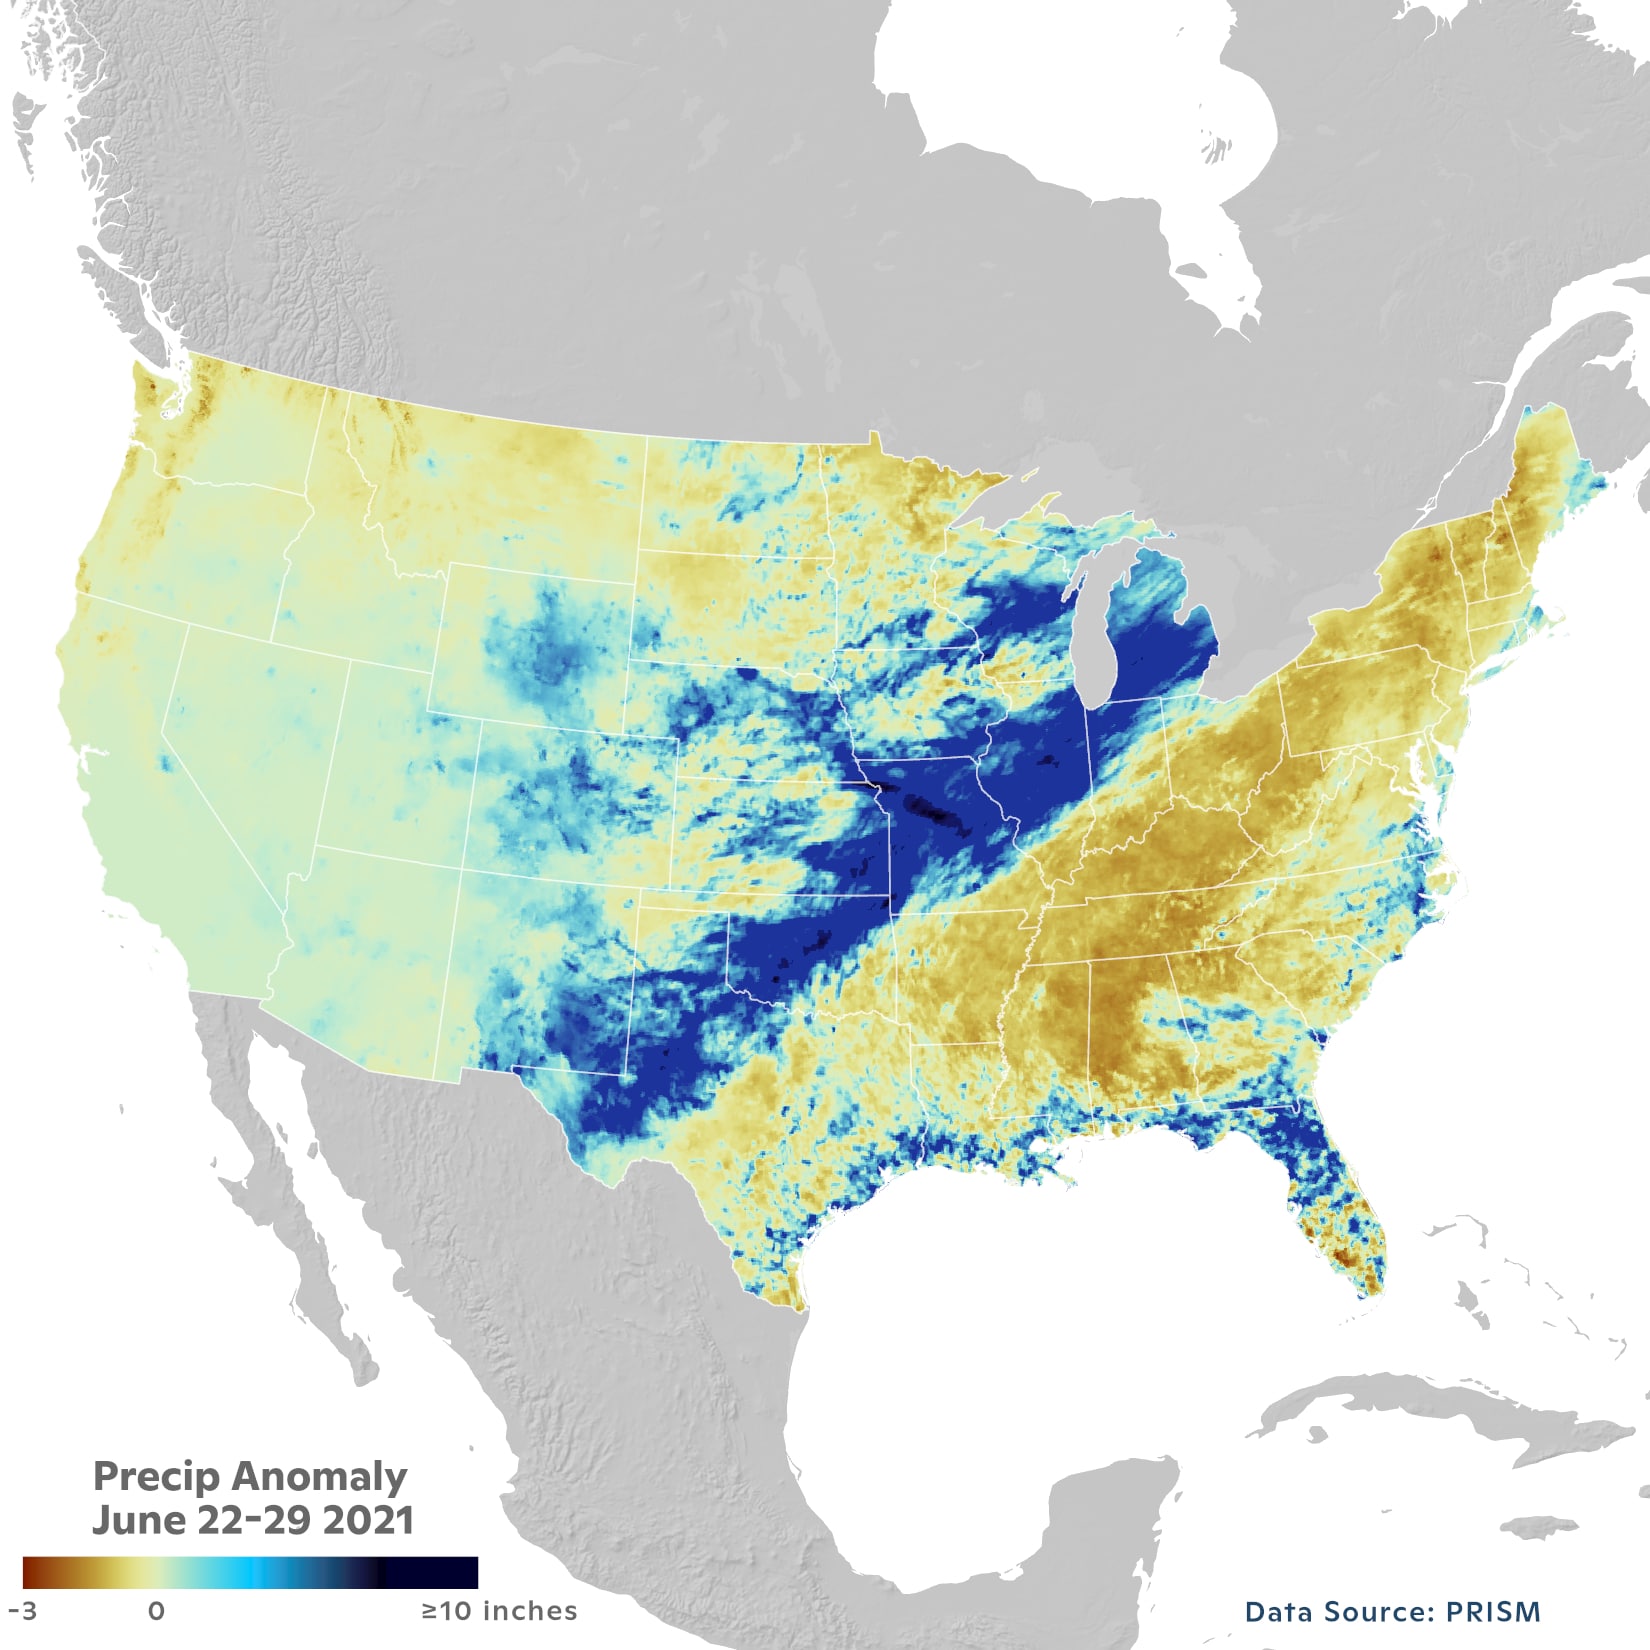
Extreme Heat in Northwest Linked to Storms in Midwest
The same jetstream fluctuations creating the heat dome are also causing unusual conditions in other parts of the country. East of the block, the jetstream dips sharply south, which has brought abnormally cool air to southern-central states and persistent storms over the Midwest. Missouri experienced unprecedented flash flooding last week as a result of heavy rainfall — in some places over 10 inches. Because continental weather systems are tightly linked, extreme weather of one type is almost always accompanied by other types of extremes in adjacent areas.
map by Greg Fiske
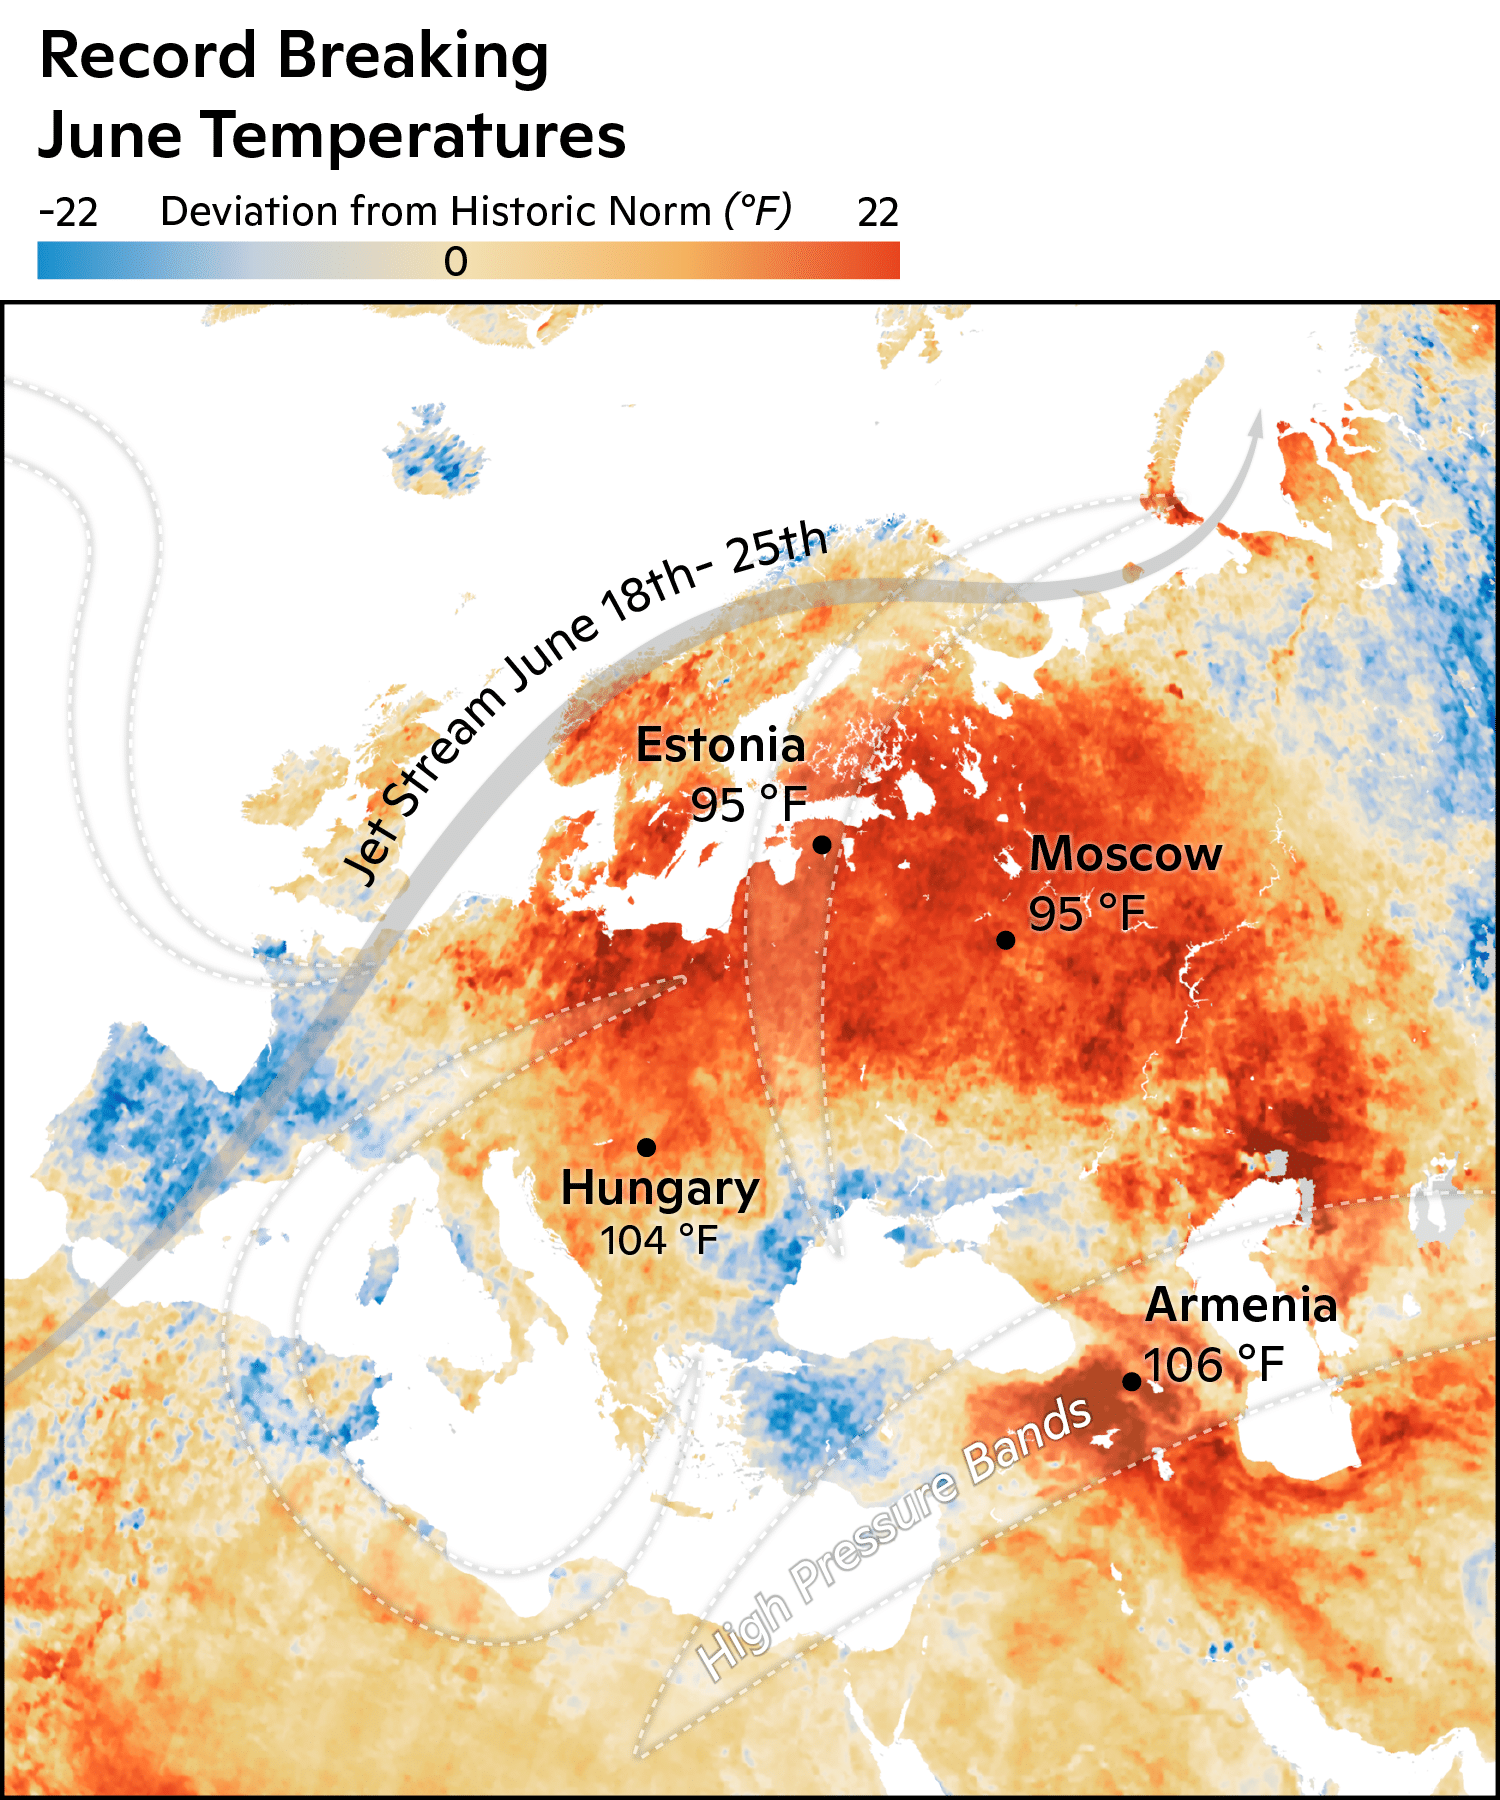
Europe Experienced Similar Heat One Week Prior
These unusual weather conditions are not confined to North America, either. Europe experienced similarly shocking heat in mid-June. Moscow, St. Petersburg, and several Eastern European countries hit their record-highest June temperatures. Germany and Austria also registered several days of highs over 95 degrees Fahrenheit.
map by Carl Churchill
High Humidity Could Increase the Danger of Heat Waves
Extreme heat is a growing and serious repercussion of climate change. Though not as visibly destructive as other natural disasters, it poses a serious threat to human health. Over just 5 days, 486 sudden deaths were reported in British Columbia, a 195% increase over typical rates.
When heat waves like this combine with humidity, the impact can be even more dangerous. While humans can shed excess heat through sweating, high humidity makes a body’s cooling system much less effective. When the dew point (the temperature at which the air becomes completely saturated) is higher than 70 degrees, conditions can change from uncomfortable to dangerous. As the globe warms, evaporation increases leading to more water vapor in the atmosphere. It has already increased by 4% on average. Climate change has not only made these sorts of once-in-a-millenium anomalies more probable, but more deadly.
map by Greg Fiske
Contributions to this article were made by Dr. Jennifer Francis and Dr. Zachary Zobel.