Amazon deforestation and fire update: April 2021
![]()
![]()
April 2021 PDF
December 2020 PDF
November 2020 PDF
October 2020 PDF
September 2020 PDF
(no August Outlook)
July 2020 PDF
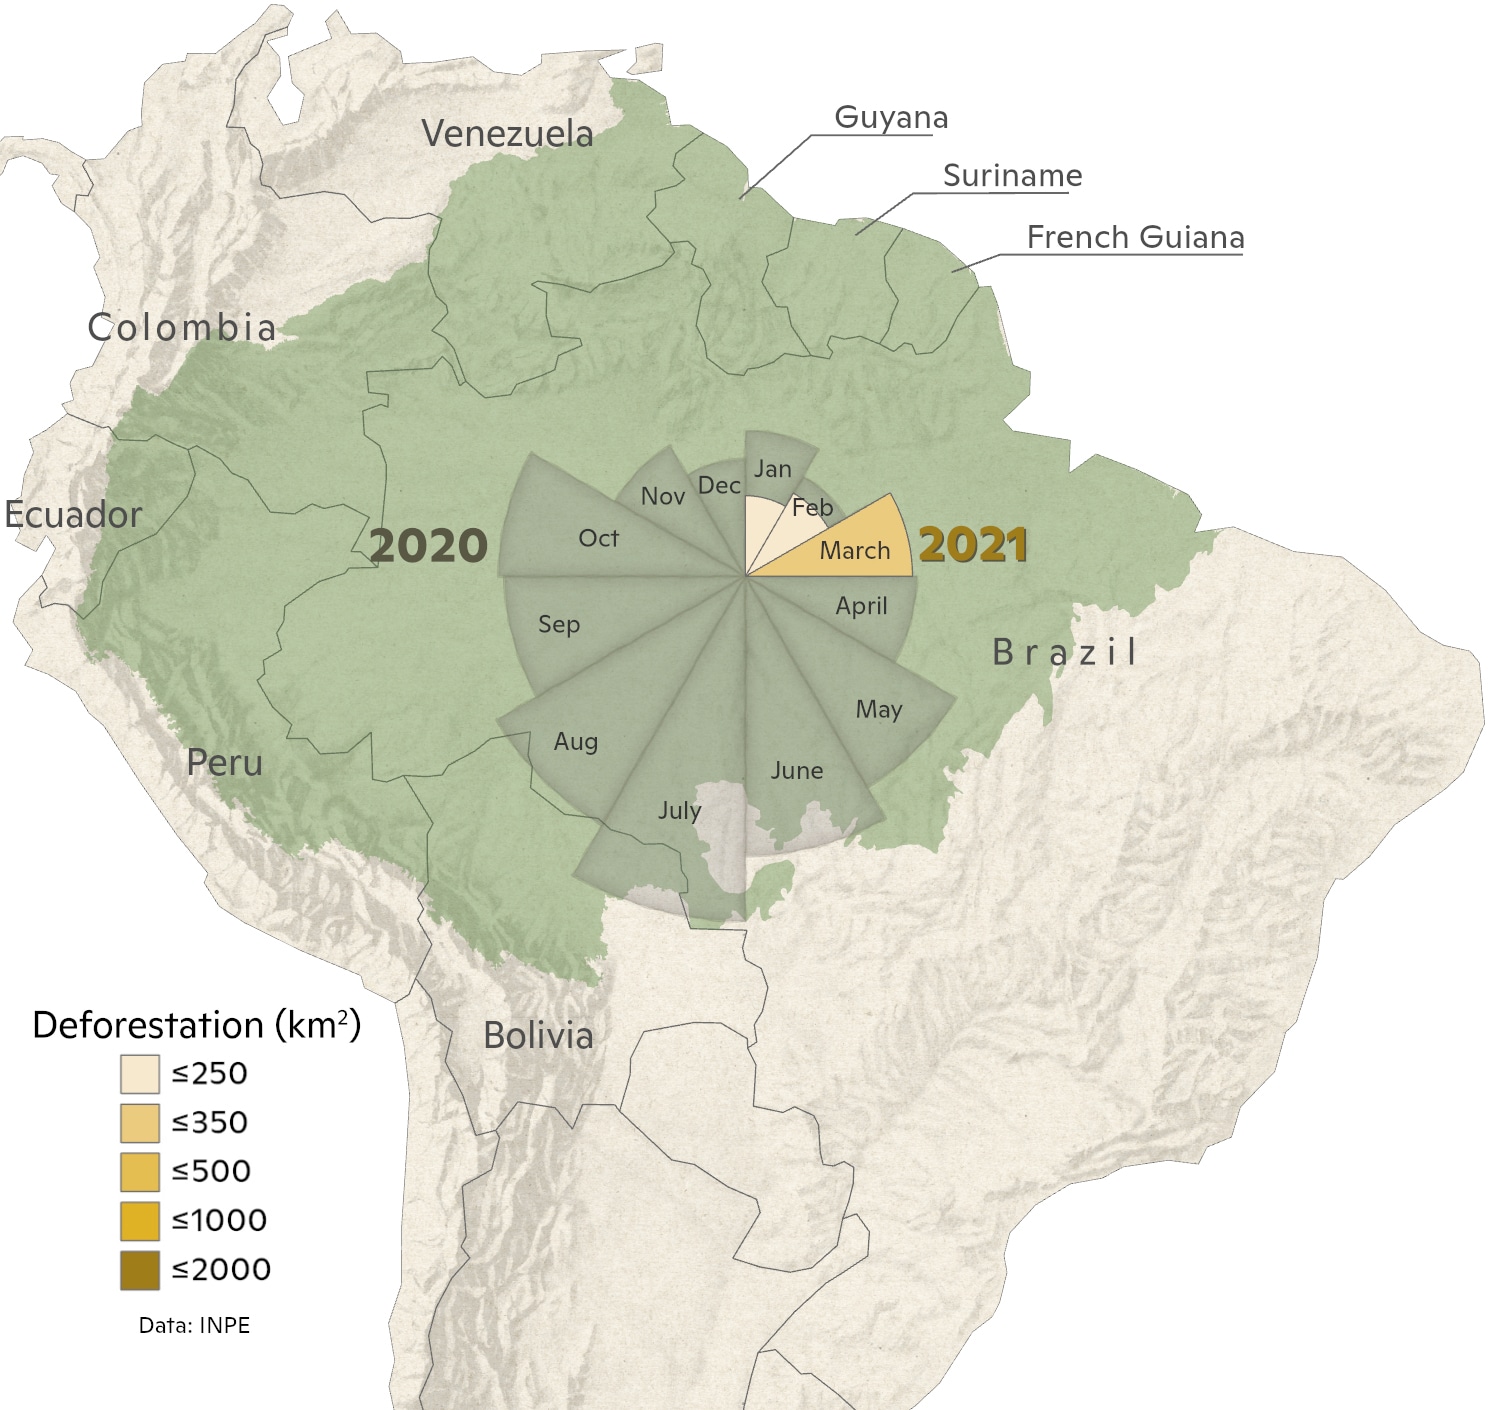
After a very quiet start in January and February, deforestation in March in the Brazilian Amazon jumped to an estimated 368 km2—greater than 2019 or 2020, both of which were very challenging years. The number of fires detected in the first three months of the year is well below the number detected by this point in 2019 and 2020, perhaps much of the Amazon is wetter than normal this year.
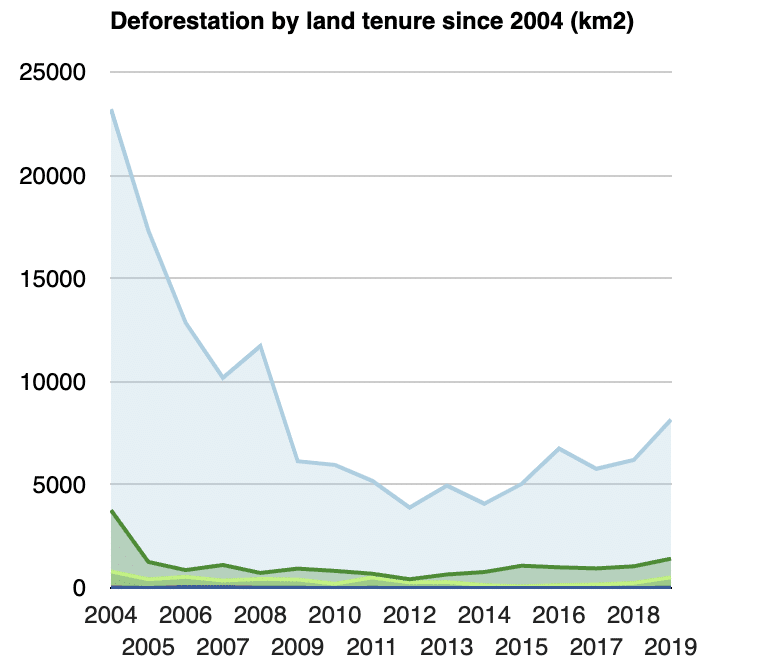
Amazon forests absorb and store roughly a tenth of human carbon dioxide emissions each year, but this critical carbon sink is threatened by deforestation and degradation of forest health. Deforestation in the Brazilian Amazon declined by 70% between 2004 and 2014. In recent years, however, deforestation has increased and fires have followed as people burn the trees they’ve recently cut down.
Building on the deforestation and fire data released regularly by Brazilian government scientists, we present an analysis of the carbon footprint of this year’s deforestation as well as where deforestation is happening and an analysis of the current climate conditions—key information for identifying fire risk hotspots and shaping solutions.
Deforestation
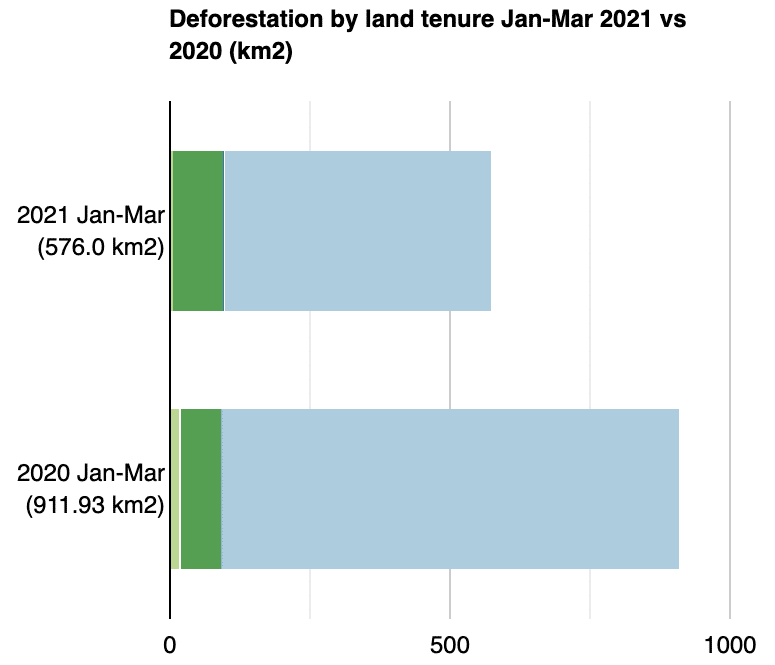
A total of 576 km2 of forest has been destroyed in the first 3 months of the year, which is similar to 2019 levels but considerably less than the 912 km2 deforested by this time in 2020. However, more than half of the deforestation this year occurred in March. This year, as in previous years, most deforestation has taken place on unprotected lands, including private properties and federal lands without a protected status. However, 20% of the deforestation in March took place in protected natural areas suggesting that illegal activities continue at a high rate this year.
Learn More
Monthly estimates of deforestation are taken from the Brazilian national space agency Real-Time System for Detection of Deforestation (DETER). DETER estimates are provided each month, but are based on relatively coarse resolution MODIS satellite products. Therefore, values tend to be an underestimate.
Annual deforestation values from 2004-2020 are provided by the Brazilian national space agency Program to Calculate Deforestation in the Amazon (PRODES). The PRODES product is based on 30m resolution Landsat imagery and is therefore a more accurate representation of the total deforestation, but it can only be provided on an annual basis.
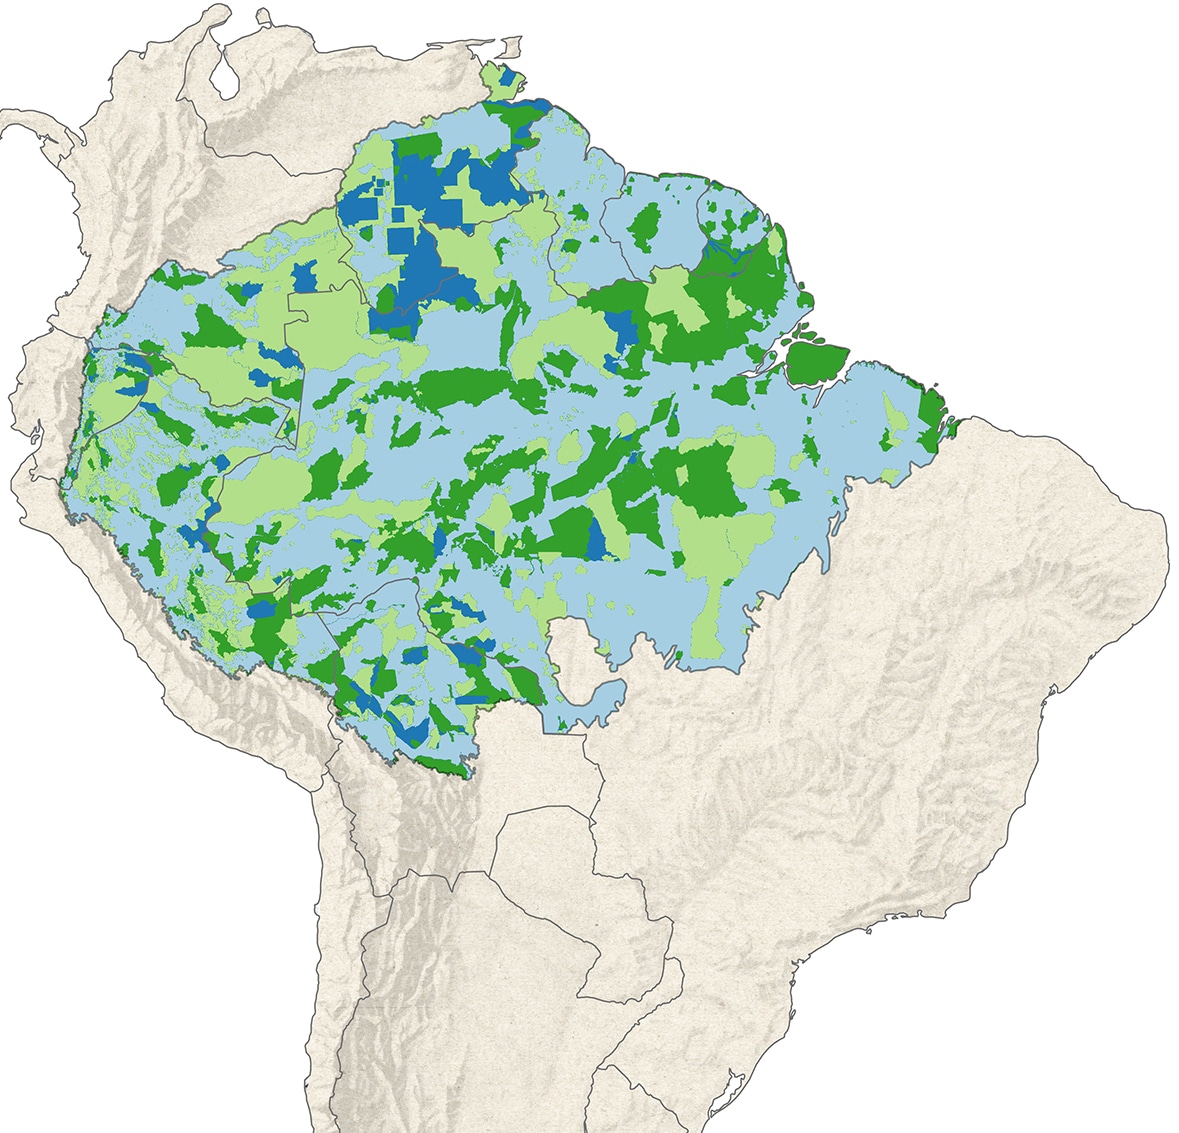
Deforestation by Land Tenure
Indigenous Territories |
Protected Natural Areas |
||
Overlap of Indigenous & Protected |
Unprotected Land |
Fires
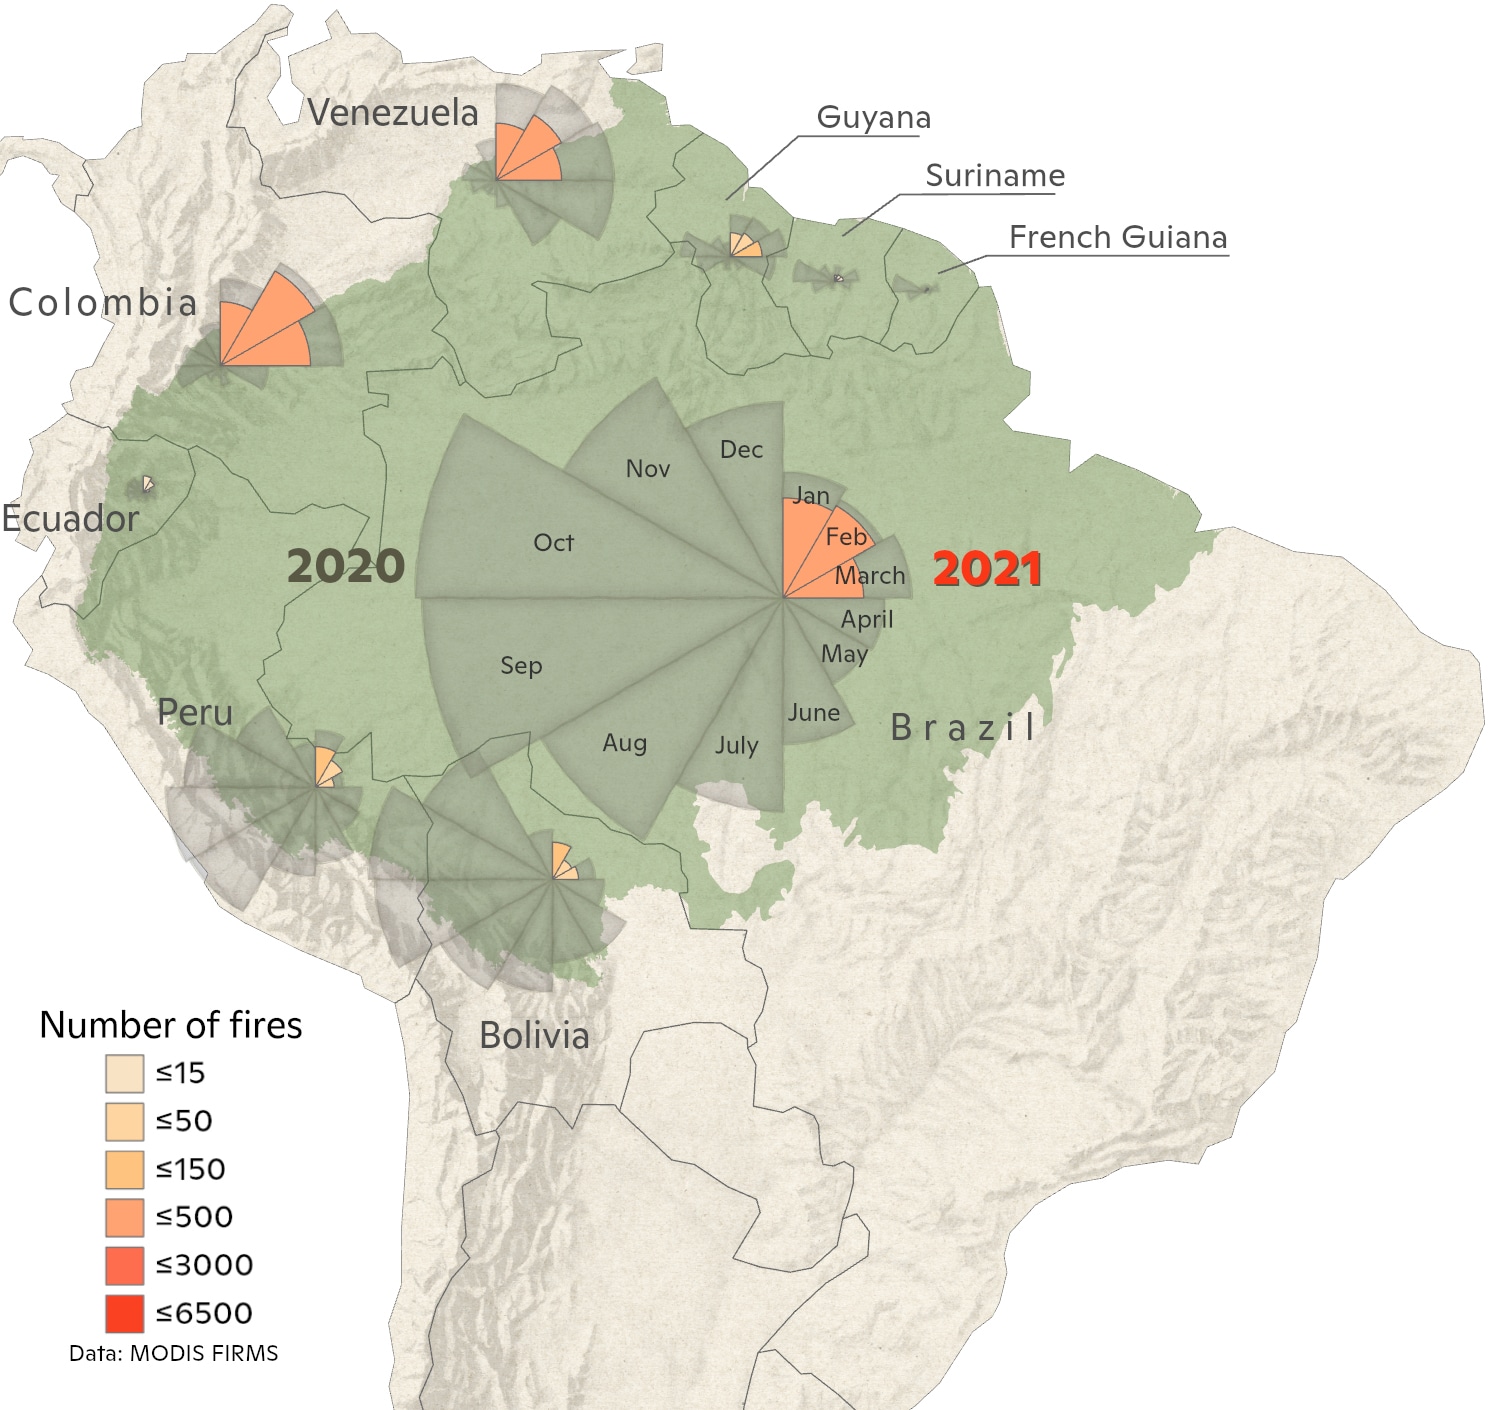
So far, we’ve counted 1445 distinct fires in the Amazon this year, which is considerably less than this time in 2019 or 2020. The low number of fires may be a combination of the relatively wet conditions that have occurred this year and the fact that deforestation didn’t really begin until March this year.
Learn More
We are using active fires hotspot data based on thermal information acquired from the Modis sensor on board the Aqua satellite with the afternoon daily passage. This is the reference satellite data used by the Brazilian National Space Agency to report fire activity in Brazil. The data is a detection of a fire front of at least 30m width and 1m height. All this information is available at Programa Queimadas Instituto Nacional de Pesquisas Espaciais.
Committed Carbon
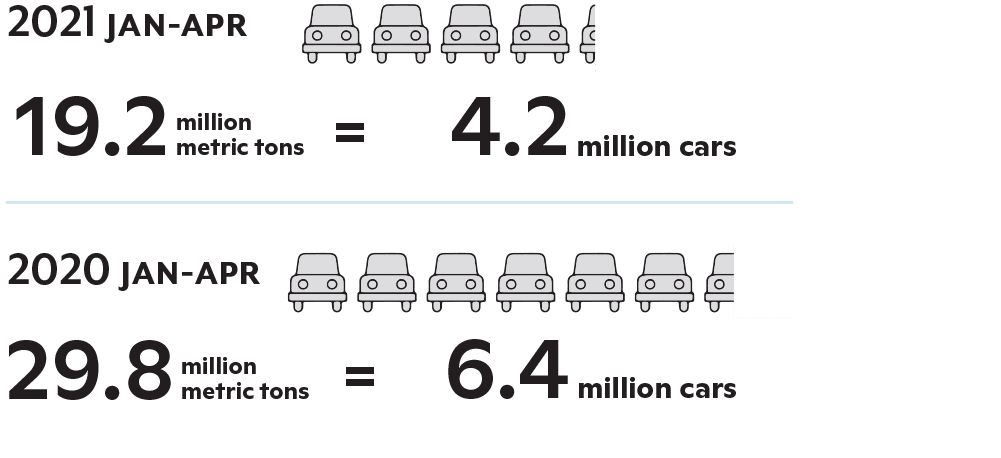
The burning of felled trees following deforestation results in the conversion of carbon previously stored in plant biomass (i.e., in leaves, branches, and stems) to carbon dioxide (CO2), contributing further to the rise in atmospheric CO2 that is the primary driver of planetary warming. In January-March 2021, CO2 emissions committed to the atmosphere as a result of forest clearing are roughly 19.2 million metric tons (MMT). That’s equivalent to the annual CO2 emissions from roughly 4.2 million cars.
Learn More
See Walker et al., 2020, PNAS for details on carbon density calculations.
More Information
Heather Goldstone, Chief Communications Officer
Woodwell Climate Research Center
hgoldstone@woodwellclimate.org, 508-444-1553
Cristina Amorim, Head of Communications
IPAM Amazônia
cristina.amorim@ipam.org.br, +55 (61) 9 9127-6994
Latest in Tropics
- In The News
Twelve women carrying the flame for climate action despite the headwinds
- In The News
What the COP30 climate summit in the Amazon delivered for forests and Indigenous people
- In The News