Climate risk assessment: Lawrence, Massachusetts
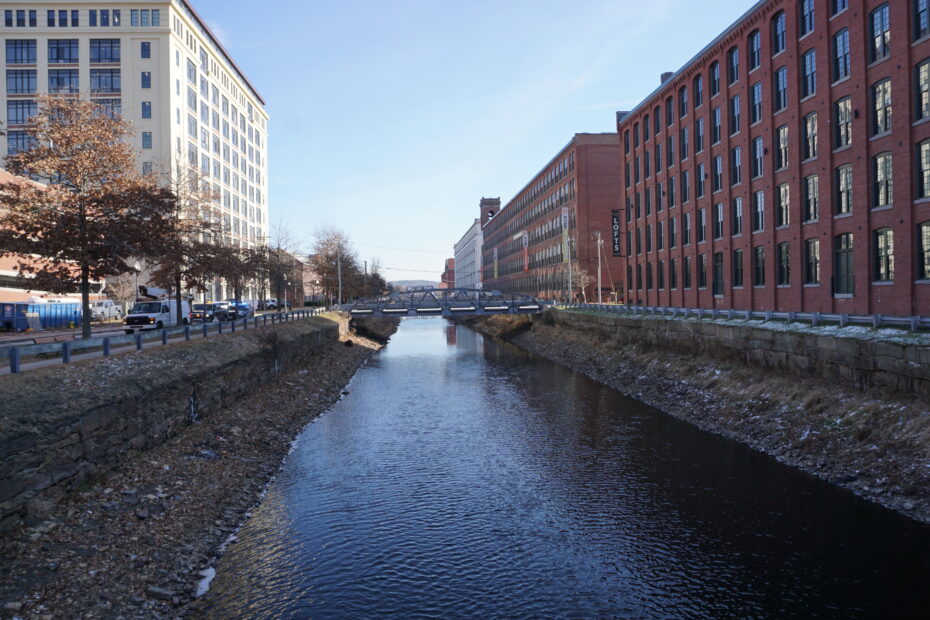
Panoramic photo of North Canal in Lawrence, MA. / photo by Terageorge~commonswiki (CC BY-NC-ND 4.0)
Introduction
The impacts of climate change on the frequency and severity of physical hazards are putting many communities at risk. As the threat of climate change grows, so too does the need for accessible information, tools, and expertise to support climate-resilient decision making for municipalities. Woodwell Climate Research Center (“Woodwell”) believes there is a need to localize and customize climate risk assessments. This information is critical for local government leaders as they make planning decisions, but it is not available to all communities. Woodwell believes that this science should be freely and widely available. To address this gap, Woodwell works with communities across the world, including Lawrence, MA, to provide municipal climate assessments, free of charge.
Results summary
As a result of climate change, temperatures are projected to increase in Lawrence, Massachusetts. The probability of the 100-year rainfall event, a useful indicator of flood risk, will likely triple by the mid 21st century and more than quadruple by the end of the century. In addition to periods of extreme rainfall, the city can expect the frequency of drought to increase. Negative impacts associated with these climate hazards will be disproportionately felt by elderly, poor, and minority populations. Groundwork Lawrence has been actively engaged with the community in efforts to address these imbalances. Here we present our findings on extreme precipitation, flooding, drought, and heat to help Lawrence in its plans to create a more resilient future for all residents.
Extreme precipitation and flooding
The trend of intensification of extreme precipitation in the Northeast US is expected to continue under future warming. Intensification here speaks to both more frequency and more severe rainfall events. Here we use localized future precipitation data from a regional climate model1 to calculate the change in probability of extreme rainfall events. In Figures 1 and 2 we show the changes in the return period of the historical (2000–2020) 100-year rainfall event for 2040–2060 and 2070–2090, respectively. By 2040–2060, the historical 100-year event will occur with a return period between 1-in-20 and 1-in-50 in the Merrimack River valley and approximately 1-in-30 in Lawrence, MA. By 2070–2090, the 100-year event will become a 1-in-15 year event for the region.
According to the National Atlas 14 published by the National Oceanic and Atmospheric Administration, the 100-year rainfall amount in Lawrence, MA is 7.85 inches. By 2040-2060, the 100-year amount increases to 10.97 inches and by 2070-2090 this further rises to 13.3 inches. The increase in rainfall translates to larger streamflows and increased flood extents as shown in Figure 3. The historical floodplain2, based on 20th and early 21st century rainfall and streamflow data, covers large portions of downtown Lawrence, especially on the southern bank of the Merrimack river because the location is the point of confluence with the Shawsheen river. The commercial and municipal district, including the courthouse and Lawrence General Hospital on the north bank of the Merrimack river, are also susceptible to flood impacts due to the convergence of the Spicket and Merrimack rivers at the eastern edge of the Lawrence city limits. The historical floodplain impacts 1,952 structures within the Lawrence city limits. By 2040–2060, the number of structures increases to 2,688 and by 2070-2090 the figure further increases to 3,093. The stormwater system was not included in the flood modeling effort because data was not available from the City of Lawrence; however, it is highly likely that the efficacy of the stormwater system would be compromised during periods of extreme water levels on the Merrimack, Spicket, and Shawsheen rivers as outfalls may be temporarily submerged. Additionally, according to the City of Lawrence Stormwater Management Program Plan3 dated June 2021, there is no stormwater infrastructure located in southern Lawrence between MA-28 and Andover Street which becomes heavily inundated during the 100-year rainfall event.
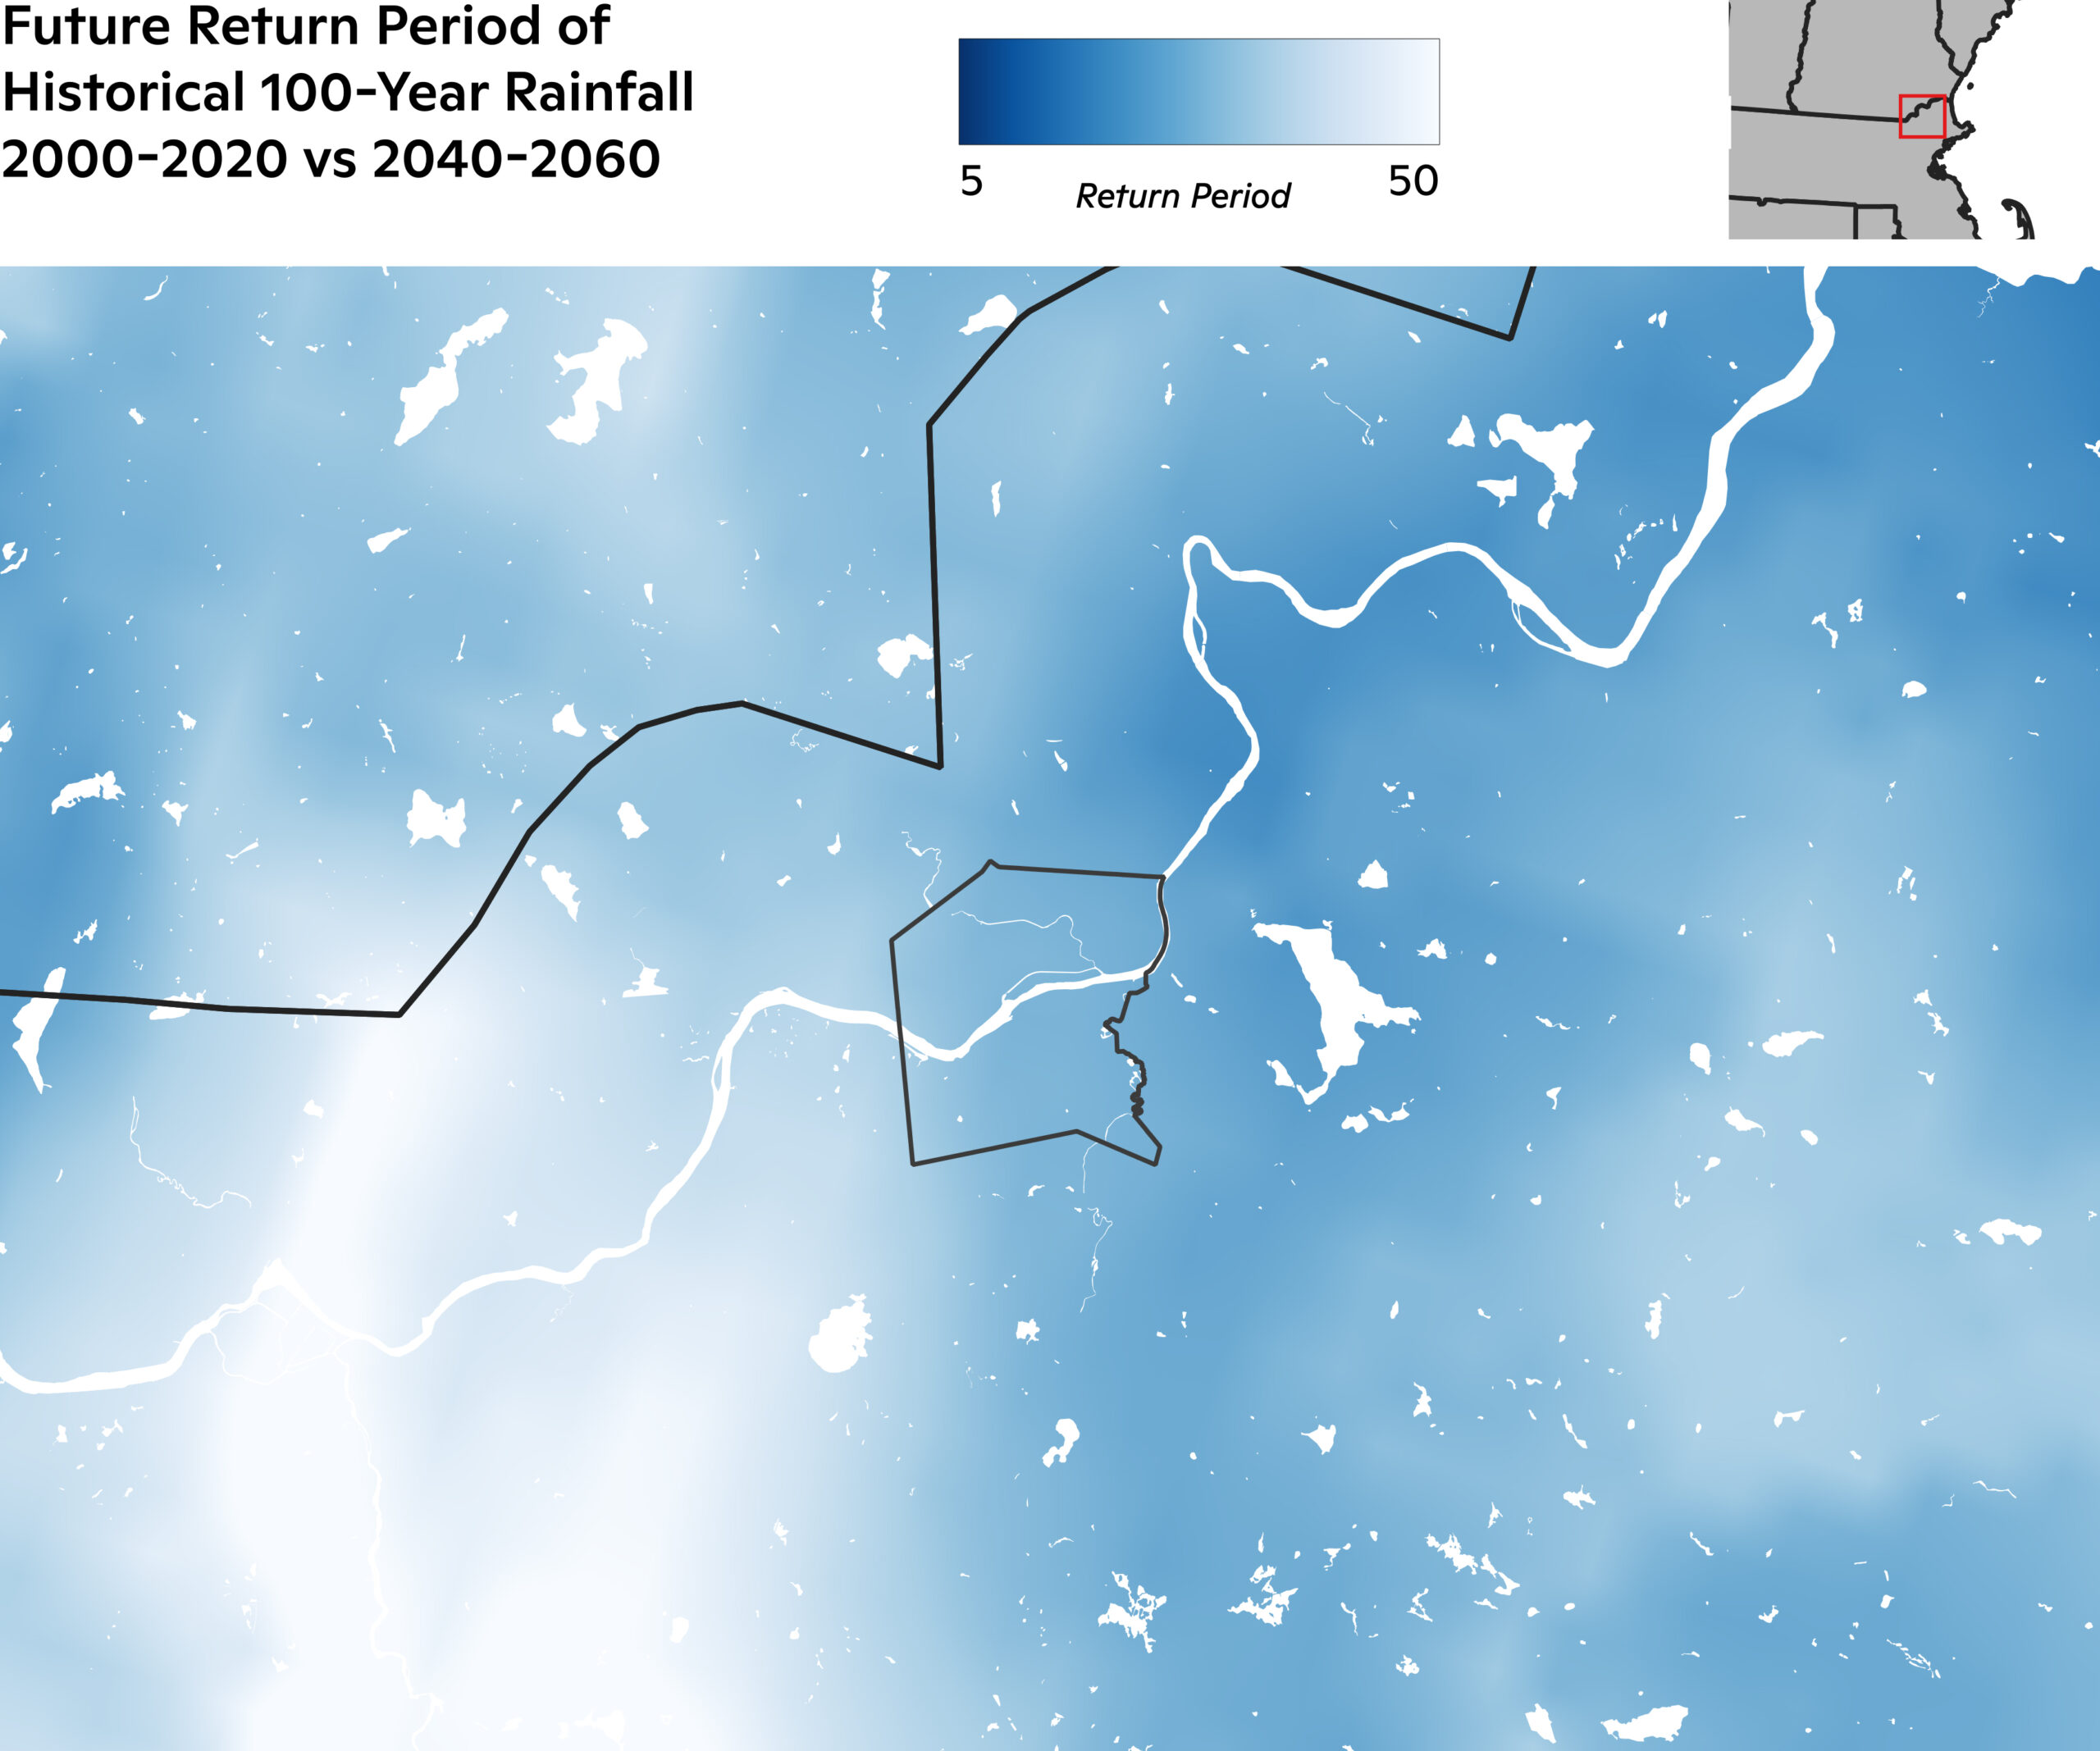
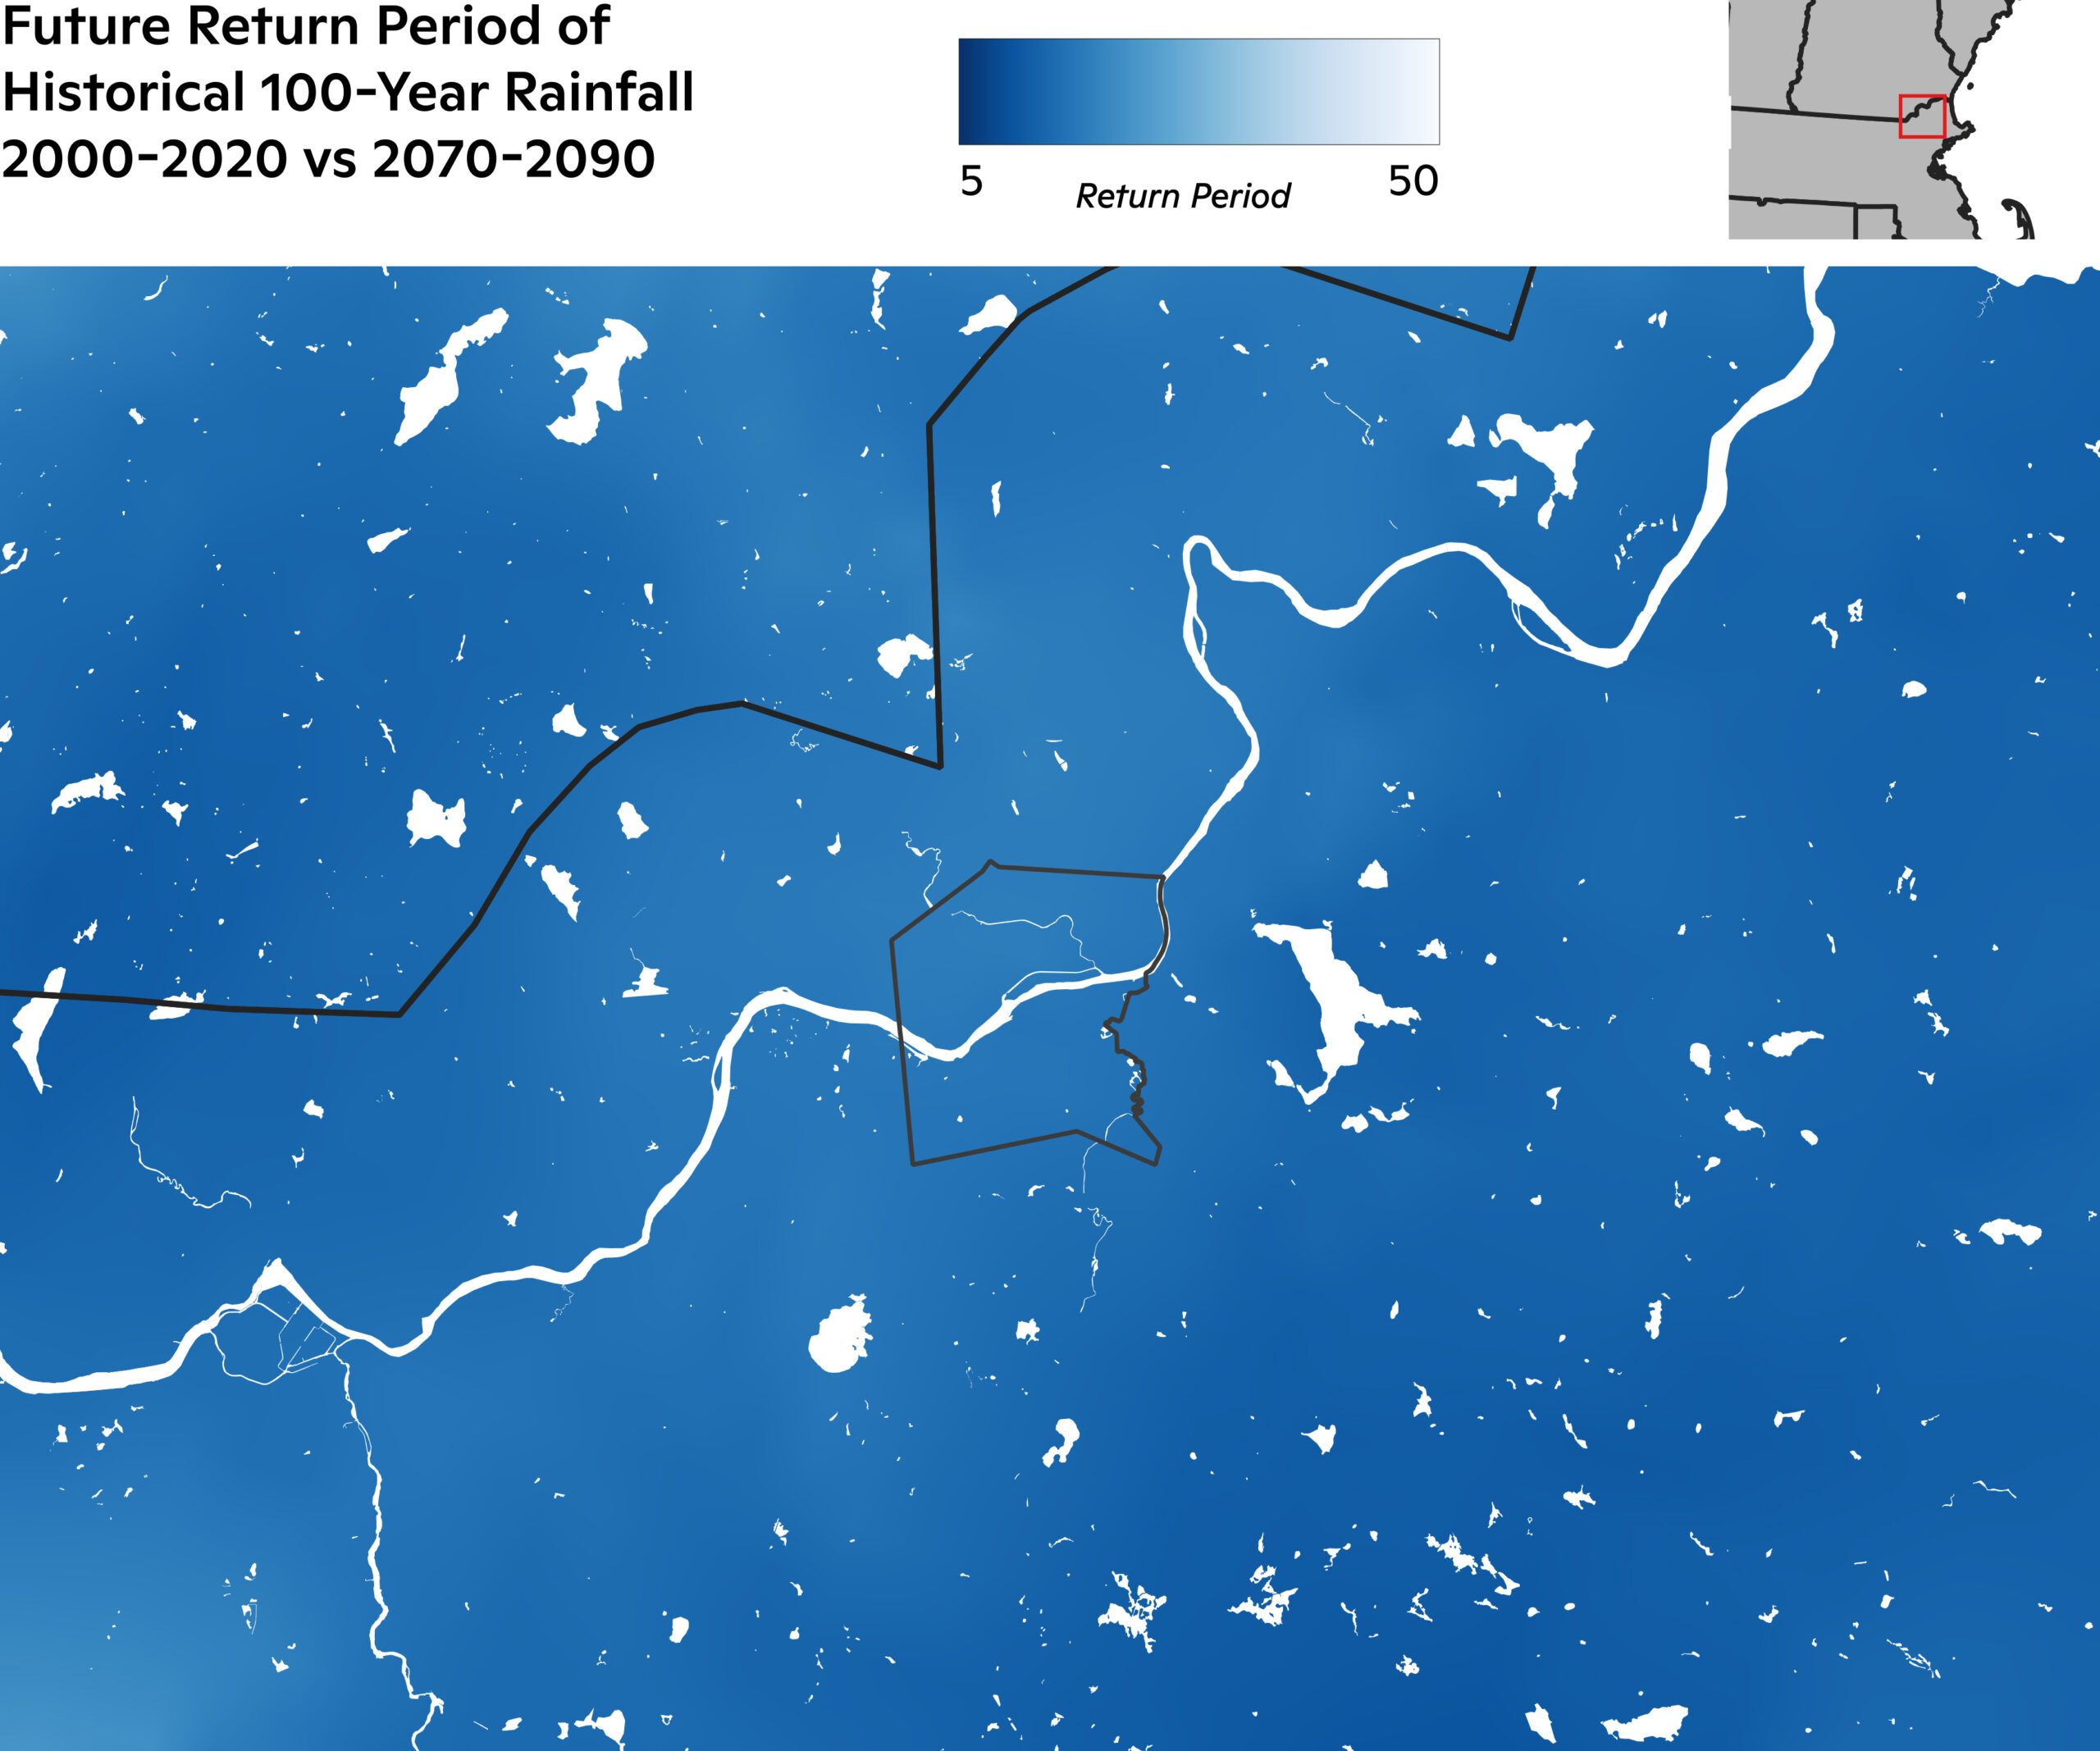
Figure 3: 2070-2090 100-Year Flood Depths. This animation shows the depth of floodwaters for the 1-day 100-year flood in 2070-2090 over a 48-hour period. The darker the orange, the deeper the flood water.
Severe drought and extreme heat
In addition to periods of extreme rainfall, Lawrence can expect the frequency of severe drought to increase in the future. Drought stress is based on the Palmer Drought Severity Index (PDSI), a metric used by the U.S. Drought Monitor. In the past two decades (2000–2020), Lawrence experienced severe, or worse, drought around 6% of the time. This number is projected to increase to around 10% for 2040–2060, meaning severe drought will be about 1.7x as likely to occur. For 2070–2090, severe drought frequency increases to 16%, meaning it will be 2.7x as likely to occur. The City of Lawrence relies on the Merrimack River as a drinking water source and low flow in the river has an impact on the availability of potable water for residents and businesses within the city. Projections of future streamflow for 2030–2059 and 2070–2099 show that the Merrimack River will not meaningfully change in flow during the spring, summer, and fall (less than 8% increase or decrease) compared to the 1977–2006 baseline as shown in Figure 44. During winter, streamflow is expected to increase by 40% for the 2030–2059 time period and 62% for the 2070–2099 time period. This large increase is likely due to winter snowfall occurring as rainfall as the climate warms. The 10-year minimum weekly flow5 is expected to decrease by 1.3% and 7.5% by 2030–2059 and 2070–2099, respectively. Based on these projections, surface water availability will likely not be an issue for Lawrence through the 21st century.
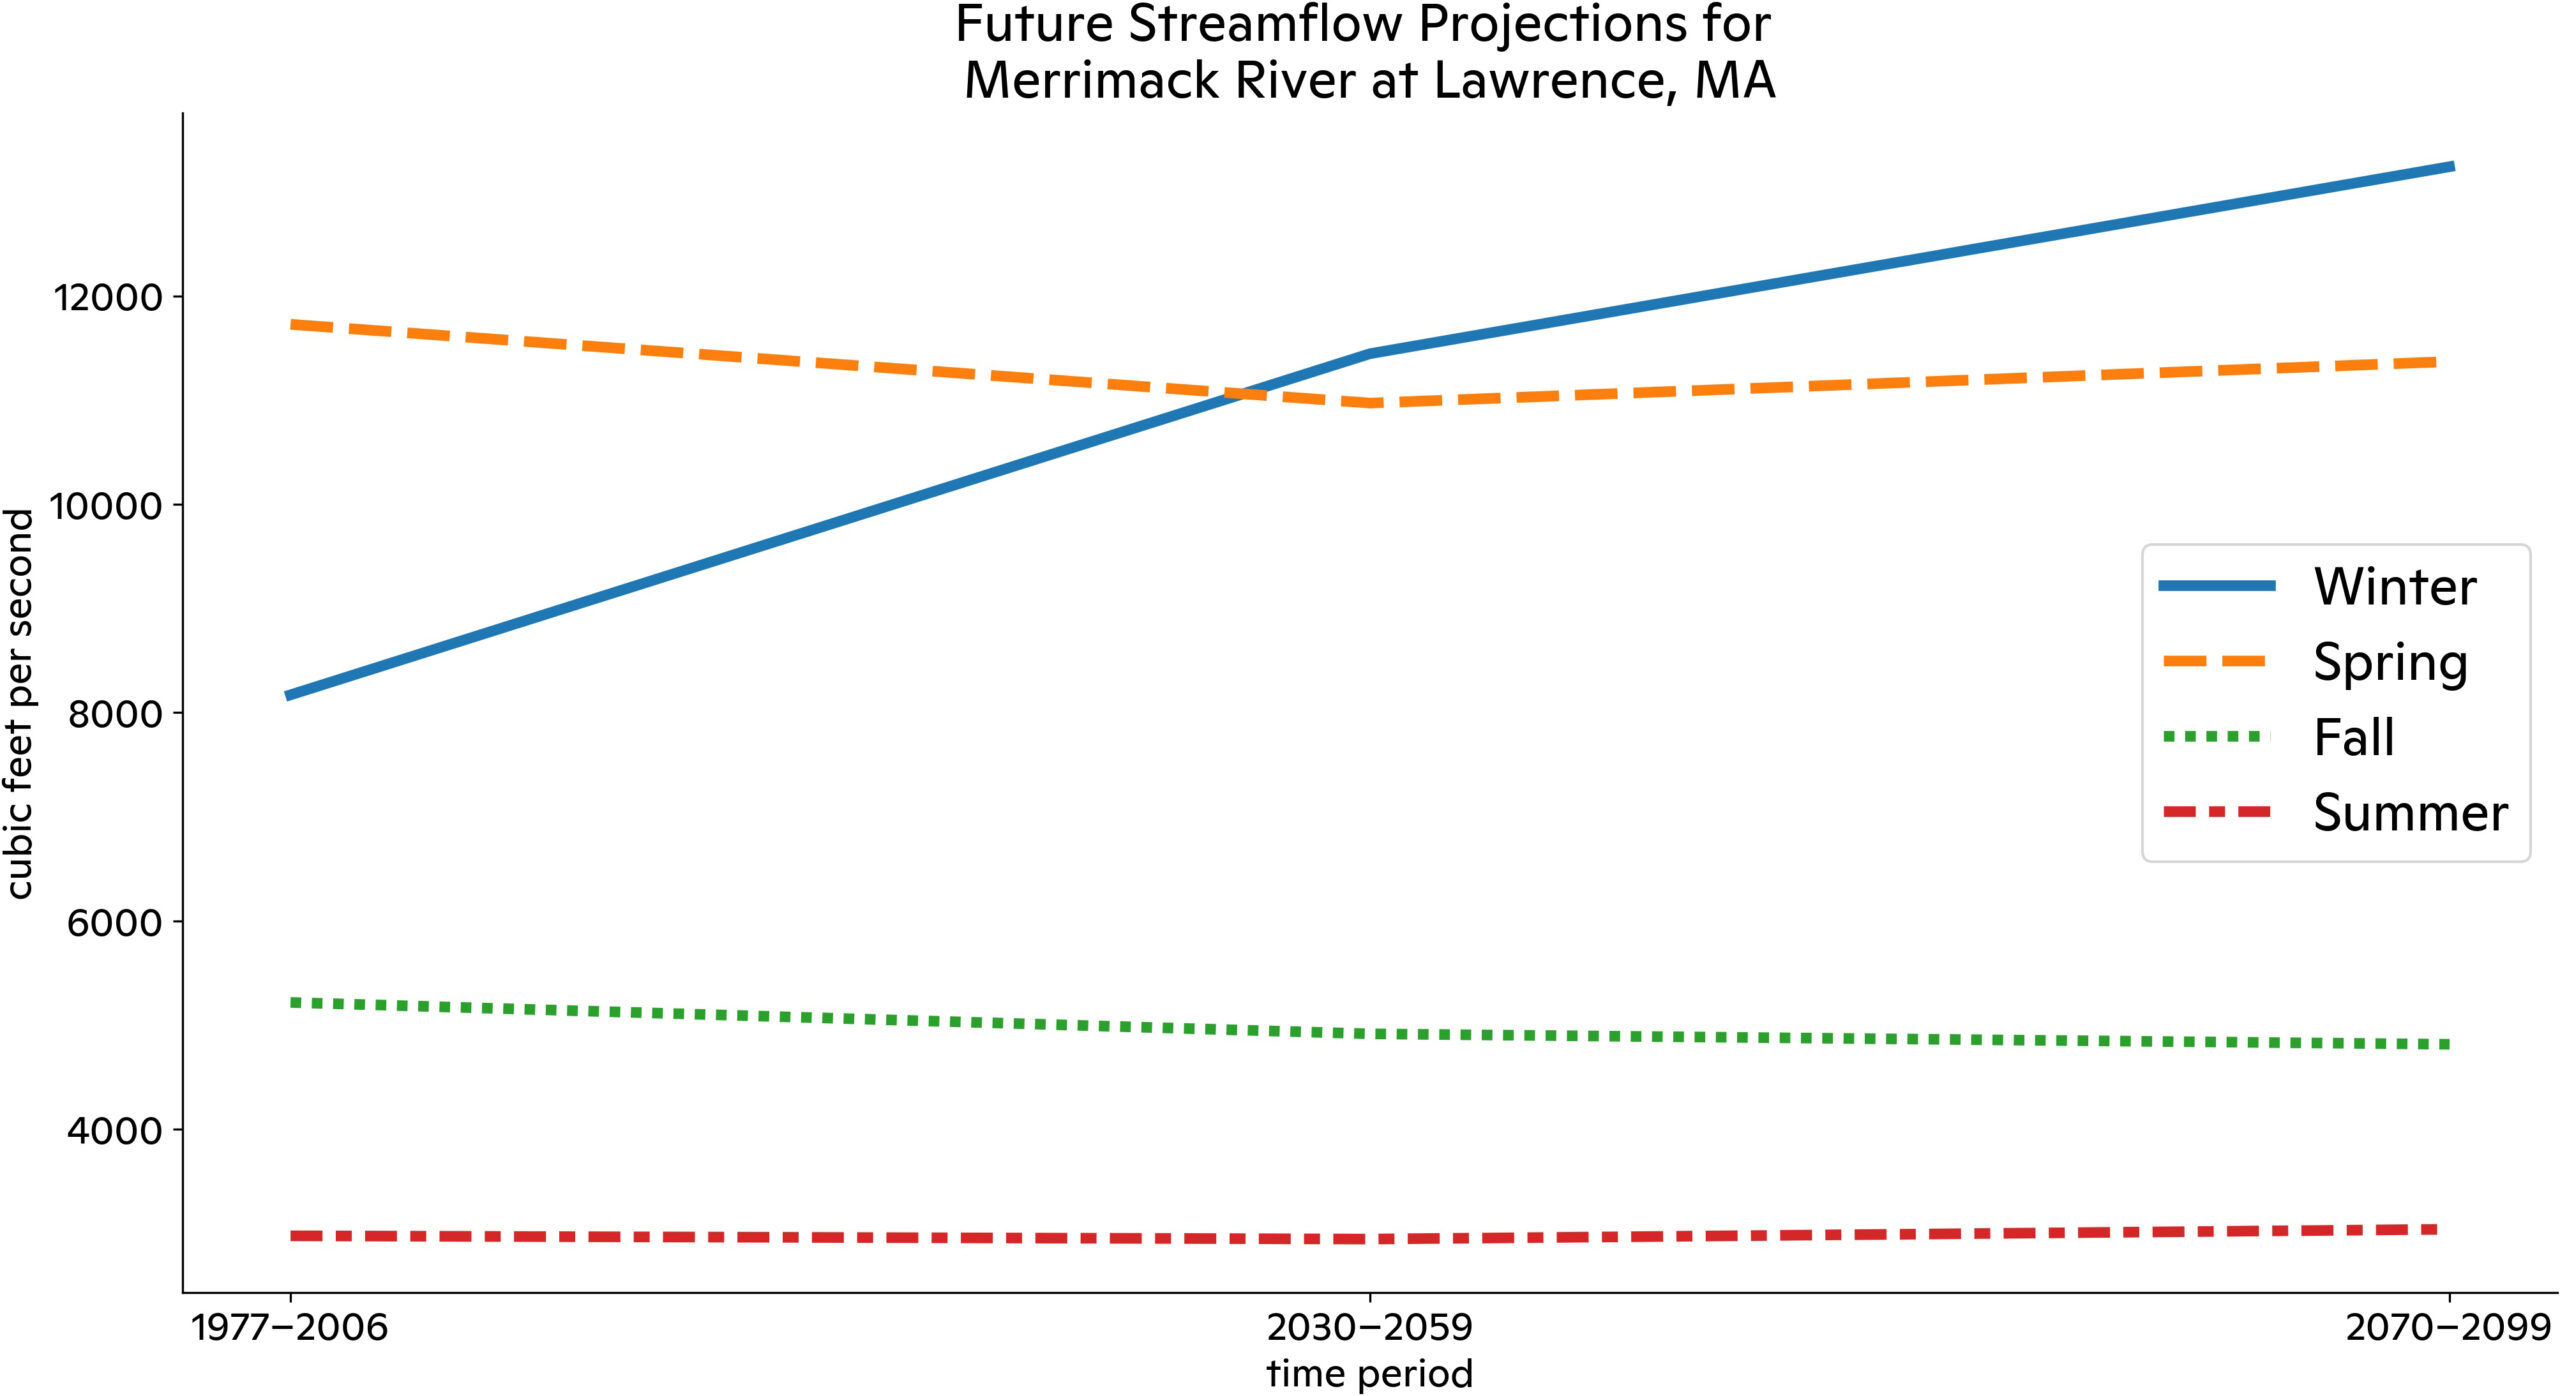
Figure 4: Future Projected Streamflow for the Merrimack River. Spring, summer, and fall streamflow is not expected to change through the 21st century while winter streamflow is expected to dramatically increase.
Extreme daily maximum temperatures, those that occur on average every 1-in-20 days, or the hottest 5% of the year, were ≥ 84°F in Lawrence in the past two decades (2000–2020) according to 1-km gridded data6. In 2040–2060, the city can expect an annual average additional 21 days above this threshold, for a total of around 39 days ≥ 84°F per year. In 2070–2090, the city can expect an annual average additional 51 days above this threshold, for a total of around 69 days ≥ 84°F per year. This means that maximum temperatures experienced during the recent hottest 5% of the year will be met or exceeded roughly 10% of the year in mid-century and 20% by late-century.
Heat danger days, defined as days when combined temperature and humidity result in a “feels like” temperature of 103°F or higher, represent a level of heat stress where heat exhaustion is likely, and heat stroke is possible for anyone engaging in physical activity outdoors. The frequency of such days is also set to increase in Lawrence as the climate warms. In 2000–2020, the city and surrounding area experienced, on average, less than one heat danger day per year. In 2040–2060, this region can expect around five heat danger days per year, and in 2070–2090, an annual average of 20 heat danger days (Fig. 4). Actual temperatures will vary across the city depending on tree canopy and concentration of buildings, concrete, and asphalt. Green spaces and air conditioning are crucial ways to combat the heat, but access to these amenities in low-income and historically redlined communities can often be limited.

Figure 5: Future heat danger days. (a) 2040–2060. (b) 2070–2090. In 2000–2020, Lawrence and the surrounding area had less than one annual average heat danger day (indicating a “feels like” temperature ≥ 103°F). The number of heat danger days will increase in the future, with ~5 days per year in 2040–2060 and ~20 days (around three weeks) per year in 2070–2090.
Groundwork Lawrence has already made extensive progress on identifying and planning solutions to fortify the city against the impacts of climate change, and helping rectify environmental injustices7. Maps created by the organization clearly show a dearth of tree canopy and an abundance of impervious surfaces within Lawrence city limits, leading to increased surface temperatures and flood risk compared to the surrounding suburbs. Individuals living within city limits are therefore more vulnerable to rising temperatures and extreme precipitation compared to the surrounding population, and poorer, elderly, and minority communities will be disproportionately impacted. Groundwork Lawrence, in partnership with the City of Lawrence, has been actively engaged with local residents for at least the past two decades to understand the specific wants and needs of the community, and has turned multiple brownfields into parks and planted over 1,000 trees. Future plans include planting 2,800 additional trees in vulnerable neighborhoods—those that are already experiencing the negative effects of climate change and have little resources for mitigation and adaptation. These trees will afford much-needed shade and flood mitigation, serving as a great example of how community-level involvement and action can make a difference in improving the lives of residents and securing a more equitable and sustainable future for everyone.