Climate risk assessment: Martha’s Vineyard, Massachusetts
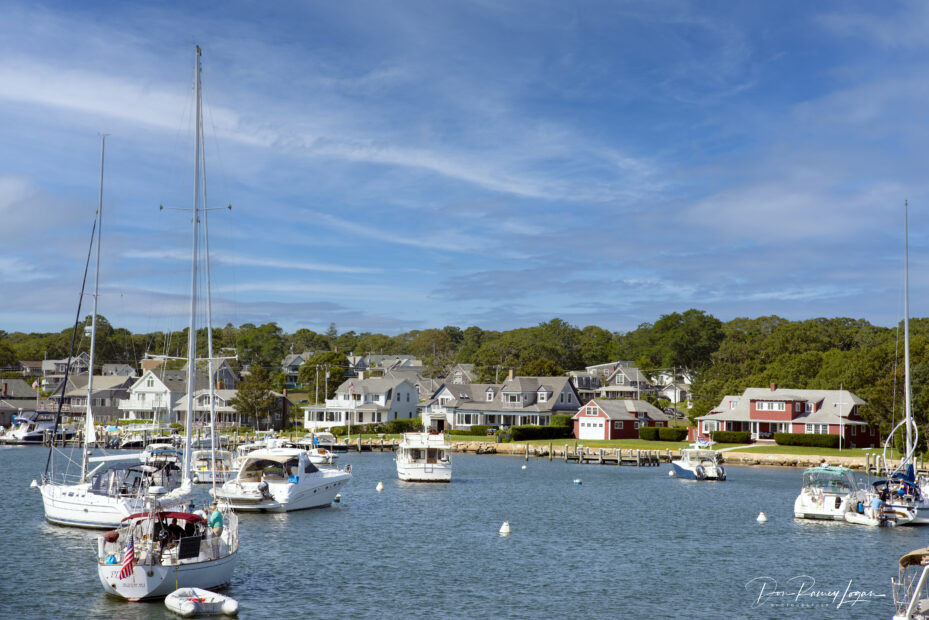
Martha’s Vineyard, Oak Bluffs, MA
photo by Don Ramey Logan from Wikimedia Commons (CC-BY-SA 4.0)
Introduction
The impacts of climate change on the frequency and severity of physical hazards are putting many communities at risk. As the threat of climate change grows, so too does the need for accessible information, tools, and expertise to support climate-resilient decision making for communities to countries. Woodwell Climate Research Center (“Woodwell Climate”) believes there is a need to localize and customize climate risk assessments. This information is critical for local government leaders as they make planning decisions, but it is not available to all communities. Woodwell believes that this science should be freely and widely available. To address this gap, Woodwell works with communities across the world, including Martha’s Vineyard, MA, to provide community climate risk assessments, free of charge.
Results summary
As a result of climate change, the probability of the historical 100-year rainfall event, a useful indicator of flood risk, is expected to increase slightly by mid-century and be about five times more likely by late-century. The likelihood of extreme drought events will also increase, from an 8.5% annual likelihood in today’s climate to 13% and 26% by mid- and late-century, respectively. Linked to this increase in drought stress, the annual average number of high-danger wildfire days is expected to increase 44% by mid-century and 94% by late-century. Regional studies have shown an increase in the number of extratropical storms impacting the northeast as well as minimal increases in storm surge. Here we present our findings on extreme precipitation, drought, wildfire, and storm risk to help Martha’s Vineyard in its plans to create a more resilient future for all residents.
Extreme precipitation
The Fourth National Climate Assessment shows that the U.S. Northeast region has already seen a 55% increase in annual precipitation occurring from the heaviest 1% of events (Reidmiller et al., 2018). Future warming is expected to continue this trend of intensification meaning more frequent and severe rainfall events. Here we use localized future precipitation data from a downscaled global climate model to calculate the change in probability of extreme rainfall events. A detailed explanation of the precipitation data processing can be found in the accompanying methodology document. In Figure 1, we show the changes in the return period of the historical (2000–2020) 100-year rainfall event for 2040–2060 and 2070–2090. By 2040–2060, the historical 100-year event will occur with a return period of 1-in-60 for cities such as Oak Bluffs and Tisbury and 1-in-80 for cities such as West Tisbury and Edgartown. By 2070–2090, the historical 100-year event will become a roughly 1-in-20 year event for all of Martha’s Vineyard.
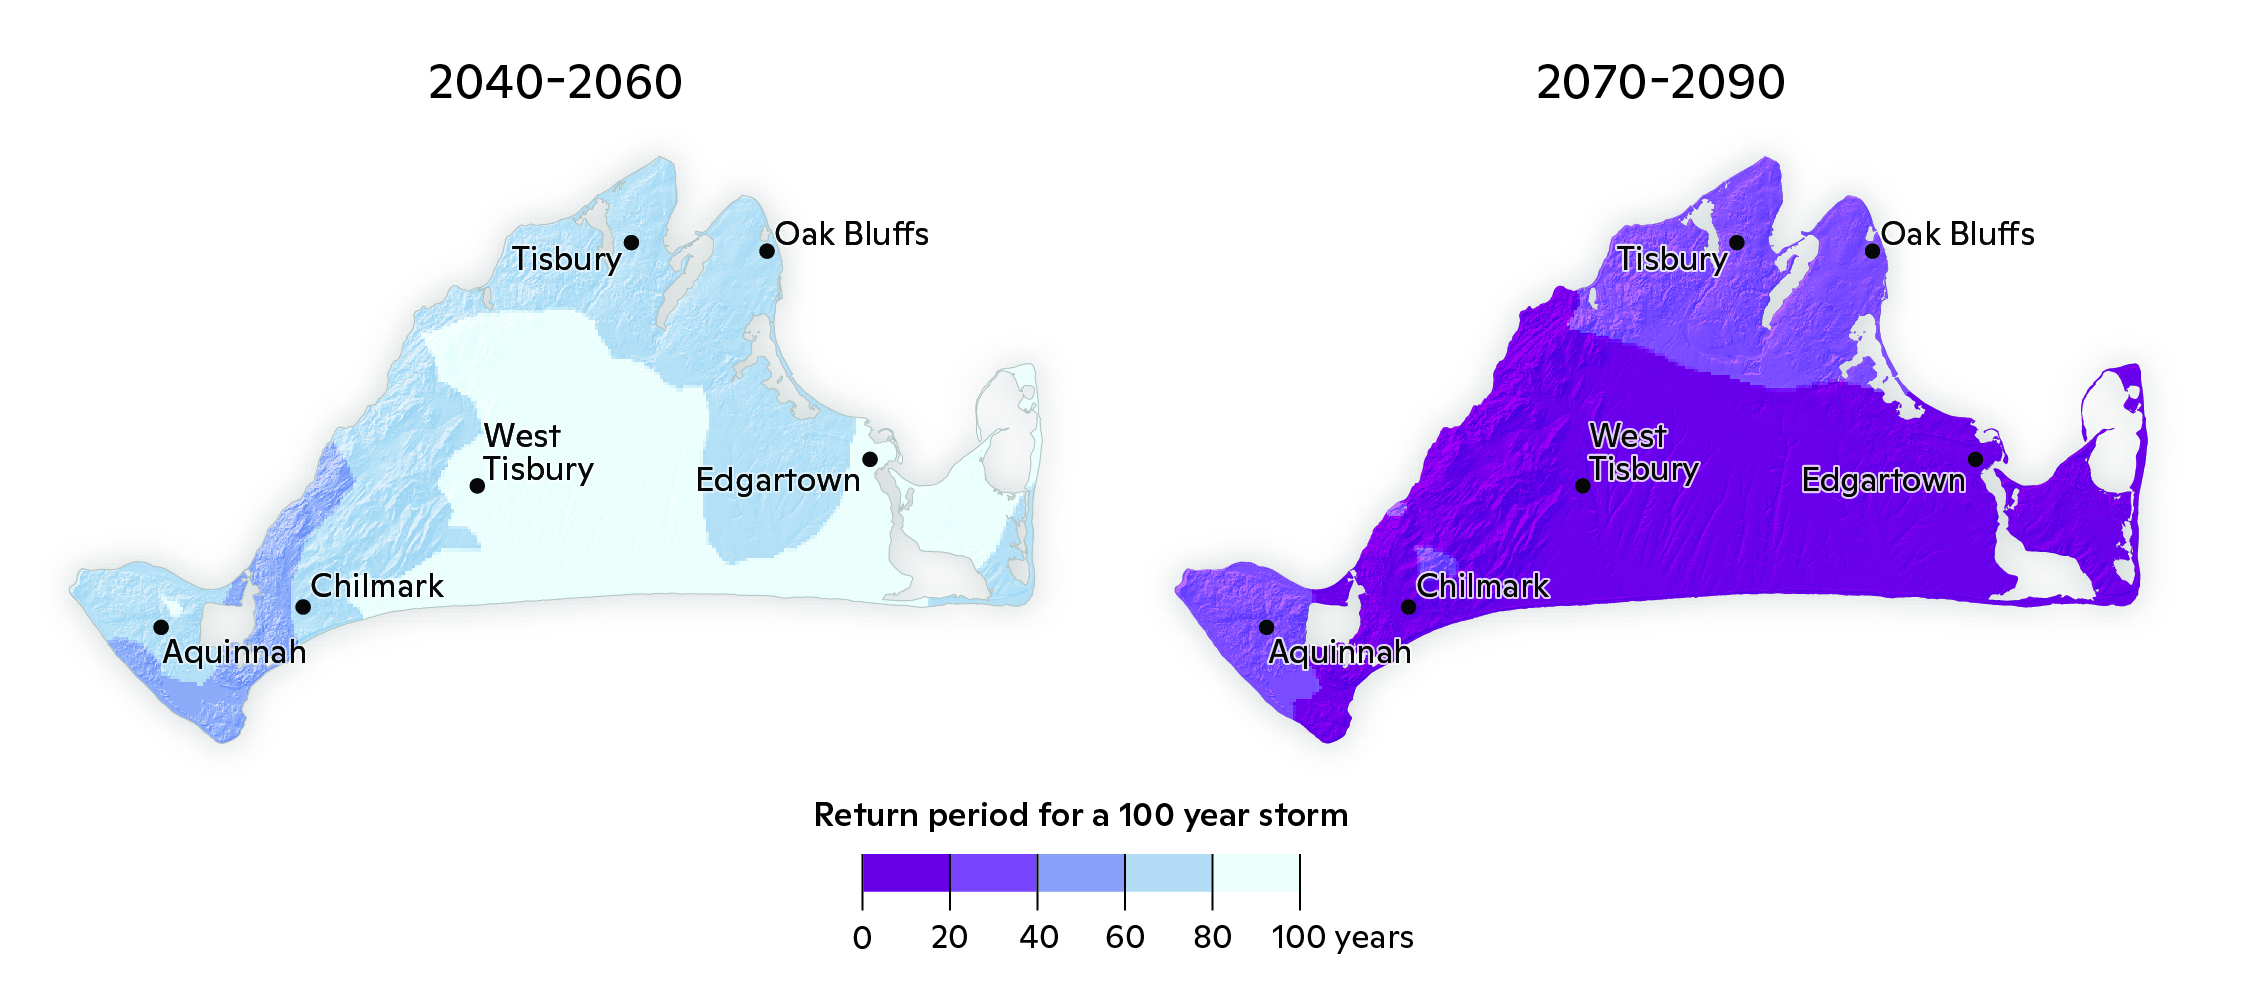
Figure 1: Mid and Late 21st Century Change in Historical 100-Year Return Period. The future return period of the 2000–2020 100-year rainfall event in 2040–2060 (left) and 2070–2090 (right) with the darker the color, the smaller the return period (greater frequency of occurrence). By the mid 21st century and the late 21st century, the historical 100-year rainfall event is expected to become a 1-in-60 to 1-in-80 year and 1-in-20 to 1-in-25, respectively, for Martha’s Vineyard.
According to the National Atlas 14 published by the National Oceanic and Atmospheric Administration (NOAA), the island-average historical 100-year rainfall amount on Martha’s Vineyard is 7.34 inches (186 mm). By 2040–2060, Martha’s Vineyard average 100-year rainfall amount increases to 7.82 inches (199 mm), and by 2070–2090 this increases to 10.06 inches (256 mm) (Figure 2).
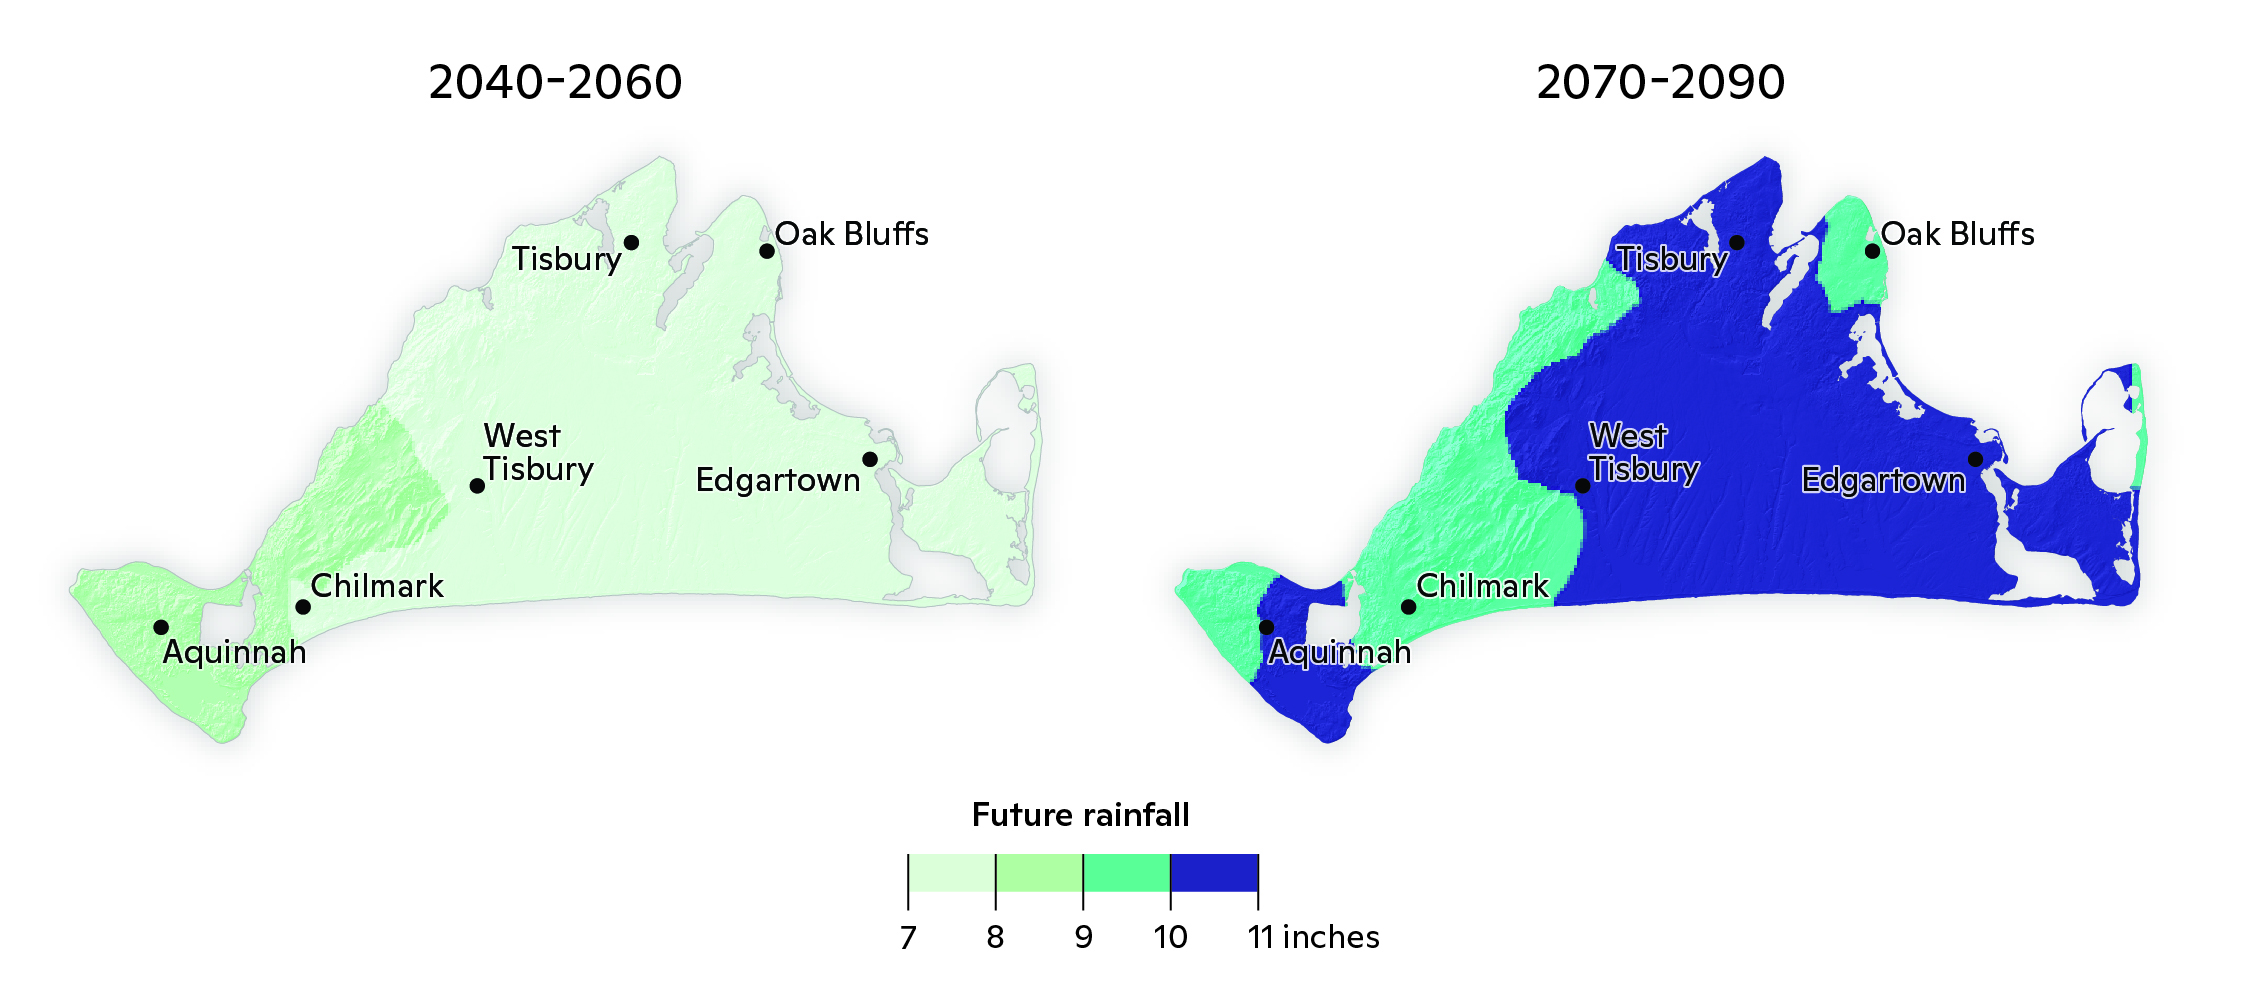
Figure 2: Mid and Late 21st Century Change in Historical 100-Year Rainfall. The future rainfall amounts in inches of the 2040–2060 (left) and 2070–2090 (right) 100-year rainfall event with the darker the hue, the greater the rainfall amount. By the mid 21st century and the late 21st century, the 100-year rainfall event is expected to drop 7.82 inches (199 mm) and 10.06 inches (256 mm), respectively.
Extreme drought
Drought occurrence was analyzed using a water balance model based on precipitation and atmospheric evaporative demand. Data came from downscaled global climate model output.1 We specifically analyzed the occurrence of extreme drought, defined as a moisture deficit event that occurred ~5% of the time under late 20th Century conditions (1970–2000).
Over the last 20 years (2001–2020), we find that Martha’s Vineyard has experienced extreme drought between 8.5% and 9.2% of the time (Fig. 3). This represents a relative increase of approximately 75%. While overall spatial variability is very low, there is a slight southwest-northeast gradient of extreme drought probabilities.
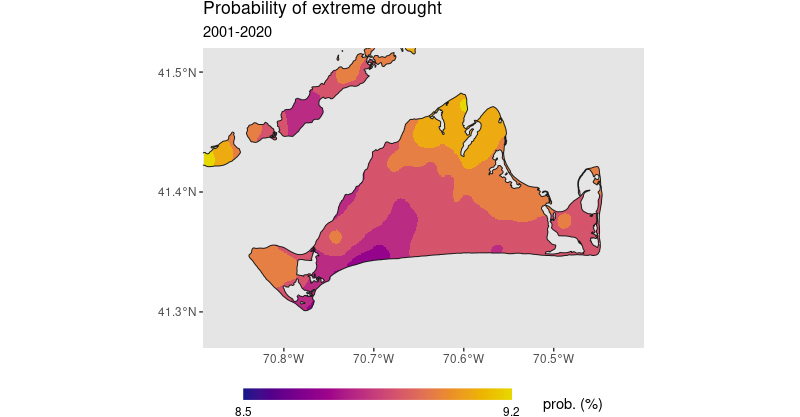
Figure 3: Historical probability of extreme drought. This figure shows the probabilities of extreme drought occurrence from 2001–2020 across the island. Purple colors indicate a relatively lower probability, while bright yellow indicates a relatively higher probability.
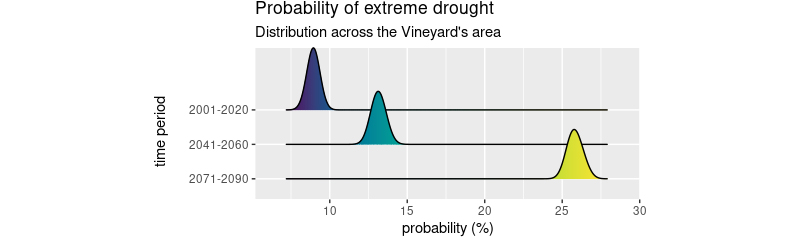
Extreme drought occurrences will become more common in the future. Our results suggest that, by 2041–2060, such an event will happen around 13% of the time, an increase of 5% relative to 2001–2020 (Fig. 4). A more drastic uptick is anticipated toward the end of the century (2071–2090), where the probability of annual occurrence will be around 26%, an increase of 17% relative to 2001–2020.
Wildfire
Dukes County, which includes Martha’s Vineyard, has compiled a comprehensive Community Wildfire Protection Plan (DCCWPP) that serves as a guide for quantifying current wildfire risk and mitigating associated deaths and property loss. To help Martha’s Vineyard prepare for future changes in wildfire danger, we analyzed Fire Weather Index (FWI)2 data. FWI is a daily, unitless measurement of wildfire danger, derived from temperature, relative humidity, wind speed, and precipitation. This metric was developed by the Canadian Forest Service and is used globally, including in the United States, to quantify fire risk.
The change in wildfire danger days was calculated by determining the additional number of days per year in the future that are predicted to have an FWI value greater than the historical (2000–2020) extreme (1-in-20-day occurrence) FWI value. This threshold indicates a high-danger wildfire day, where fires have the potential to quickly grow out of control in the event of natural or human-caused ignition. By mid-century (2040–2060), Martha’s Vineyard can expect an average additional eight wildfire danger days per year, representing a 44% increase over the historical annual average of 18 days. By late-century (2070–2090), the island can expect to experience an average additional 17 wildfire danger days per year compared to 2000–2020, a 94% increase over the historical annual average. Future projected increases in wildfire danger for Martha’s Vineyard will further stretch firefighting resources that are already stressed. By incorporating this future risk into the DCCWPP, the community can better hone its efforts in educating residents and allocating limited resources.
Future storm risk
While extratropical cyclones can impact precipitation, storm surge, and inland flooding, there is no consensus regarding future changes in storm dynamics for the New England region. Information on future storm behavior varies according to intensity definition and region of interest; with higher resolution models better able to resolve extratropical cyclones (Willison et al., 2015). On a global scale, there is some evidence supporting fewer winter extratropical cyclones by the end of the 21st century (e.g. Eichler et al., 2013; Zappa et al., 2013). However, on a regional scale, studies show an increase in the number of extratropical cyclones in the Northeast of the U.S. (Zappa et al., 2013; Colle et al., 2013). Studies also find more rapid deepening rates of pressure leading to more intense storms (Zhang and Colle, 2017) during the winter months, which would correspond to the naming convention of a Nor’easter.
Storm tides and storm surge are also affected by Nor’easter storms which can, in turn, lead to more flooding. However, future increases in storm tides due to changes in storm tracks in the New England region are less certain (Pringle et al., 2021). This is due to the overall area having a larger tidal range, and the timing of the storms impacting the eastern seaboard of the U.S. In nearby Woods Hole, MA, a slight increase in storm surge for the 10-year (4% increase) and 50-year (2% increase) surge return period induced by extratropical cyclones is projected by 2054–2079 (Lin et al., 2019).
1 CMIP6 climate model data bilinearly interpolated to 1-km and bias-adjusted using Daymet 1-km observation data (Thornton et al. 2022) and Inter-Sectoral Impact Model Intercomparison Project (ISIMIP) methodology (Lange 2019, Lange 2021).
2 FWI quantifies ecosystem vulnerability to wildfire and wildfire potential, addressing fuel availability, drought, and fire behavior using seven indices: Buildup Index, Daily Severity Rating, Drought Code, Duff Moisture Code, Fine Fuel Moisture Code, Fire Weather Index, and Initial Spread Index (Quilcaille et al. 2023). FWI was calculated using REMO2015, a CMIP5-era monthly, high-resolution (0.2° or ~22 km) regional climate model, an RCP8.5 emission scenario, and a baseline time period of 1971–2000. Input variables include daily air temperature, relative humidity, wind speed, precipitation, snowfall, month of the year, and latitude. FWI values were then bias-adjusted to ensure the climate simulation data matches historical observations, using Phase 3 of the Inter-Sectoral Impact Model Intercomparison Project (ISIMIP) v2.5.0 methodology (Lange 2019, Lange 2021) and ERA5 reanalysis data from 1991–2020 as the calibration dataset (Vitolo et al. 2020).