Climate risk assessment: New Orleans, Louisiana
Introduction
The impacts of climate change on the frequency and severity of physical hazards will put many communities at risk. As the threat of climate change grows, so too does the need for accessible information, tools, and expertise to support climate-resilient decision-making for municipalities. In the report Recognizing risk—raising climate ambition, Woodwell Climate Research Center (“Woodwell”) highlights the need to localize and customize climate risk assessments. However, given that the private sector is meeting the majority of the need for climate data and analyses, communities without sufficient financial resources often do not have access to this information. To address this gap, Woodwell works with communities across the world, including New Orleans, LA, to provide granular climate services, free of charge.
Extreme heat
Extreme daily maximum temperatures, those that occur on average every 1-in-20 days, or the hottest 5% of the year, were ≥ 94°F in New Orleans in the recent past (2000–2020) according to 1-km gridded data. In 2040–2060, the city can expect an annual average additional 35 days above this threshold, for a total of around 53 days ≥ 94°F per year. In 2070–2090, the city can expect an annual average additional 80 days above this threshold, for a total of around 98 days ≥ 94°F per year. Heat danger days, defined as days when combined temperature and humidity result in a “feels like” temperature of 103°F or higher, represent a level of heat stress with heat exhaustion likely, and heat stroke possible, for anyone engaging in physical activity outdoors. Such days are also set to increase as the climate warms. In 2000–2020, New Orleans experienced around 39 heat danger days per year. In 2040–2060, the city can expect an annual average of 89 heat danger days, and in 2070–2090, an average of 128 heat danger days. This means the level of heat stress in New Orleans will roughly triple by mid-century and increase by a factor of four by late-century.
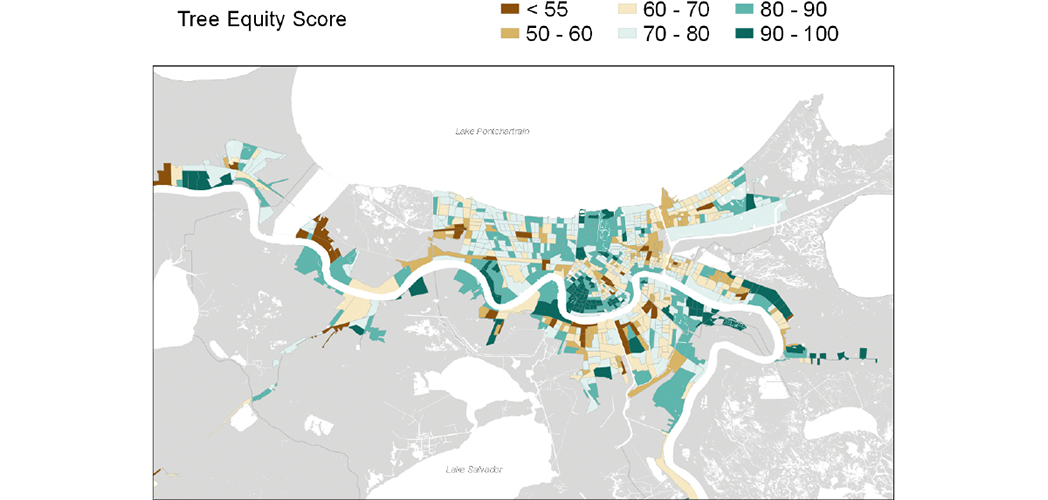
Actual temperatures will vary across the city depending on tree canopy and concentration of buildings, concrete, and asphalt. Green spaces and air conditioning are crucial ways to combat the heat, but access to these amenities is tied to various factors such as income and race. The Tree Equity Score (TES) is one metric that can be used to identify neighborhoods that are more vulnerable to extreme heat (Fig. 1). Through a combination of tree canopy cover (2020 US Tree Map), climate (USGS Earth Explorer), demographic, and socioeconomic data (U.S. Census Bureau American Community Survey 2014–2018; Center for Disease Control), relative TESs are determined on the most-recent census-block level and then aggregated to the municipality level. The average TES for all parishes that make up New Orleans is 74, so neighborhoods with TESs below this value are more vulnerable compared to the citywide average.
Figure 1: Tree Equity Score
Vulnerability to extreme heat in New Orleans. The average TES for New Orleans is 74. Pale green regions indicate TESs near the citywide average, while brown shades indicate below average TESs (darker green = above). TESs allow cities to assess the equality of tree canopy cover for all residents. The score is a combination of tree canopy cover need and priority for trees in urban neighborhoods, derived from tree canopy cover, climate, demographic, and socioeconomic data. Scores are calculated at the census-block level and then aggregated to the municipality level. (Data source: Tree Equity Score).
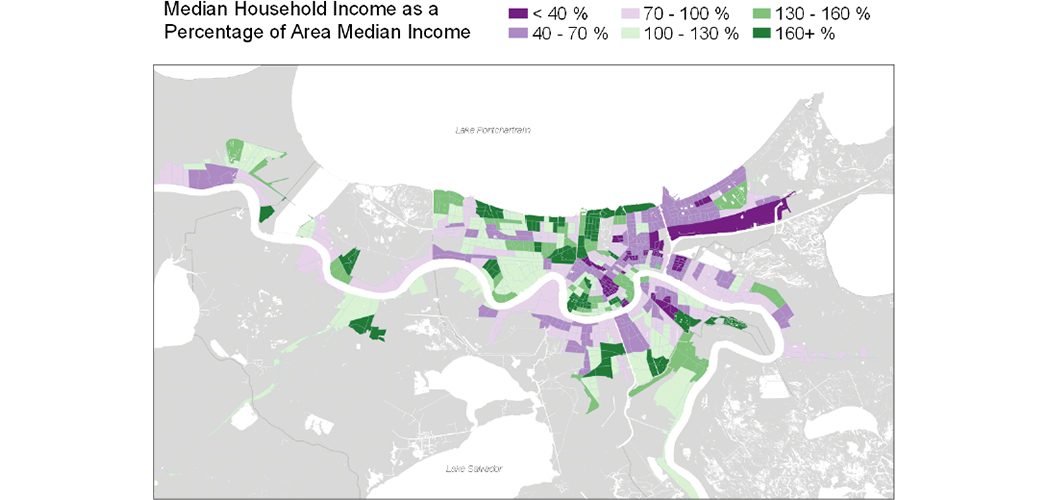
Analysis of the correlation between census-block-level TESs and other socioeconomic data, such as income and race, provides insight into inequities occurring throughout the city that should be addressed to ensure the entire population of New Orleans is equitably equipped to combat rising temperatures. Correlation coefficients range from -1 (negative relationship) to +1 (positive relationship), summarizing the relationship between two variables with a single value. The correlation coefficient for relative median income (Fig. 2) and TES (Fig. 1) for New Orleans is 0.51, indicating a strong positive correlation between the two variables. Therefore, as income increases the TES typically does as well.
Figure 2: Median household income as a percentage of area median income
Distribution of income across New Orleans. Green hues indicate regions with a median income above the area median income (purple = below). (Data source: Climate and Economic Justice Screening Tool).
The correlation coefficient for the percent of people of color (POC) (Fig. 3) and TES (Fig. 1) is -0.50, indicating a negative correlation between the two. Therefore, TES typically decreases as neighborhood percent POC increases.
Figure 3: Percentage people of color
Distribution of people of color across New Orleans. Lighter hues depict Census Block Groups that are majority white (darker = non-white). (Data source: Tree Equity Score).
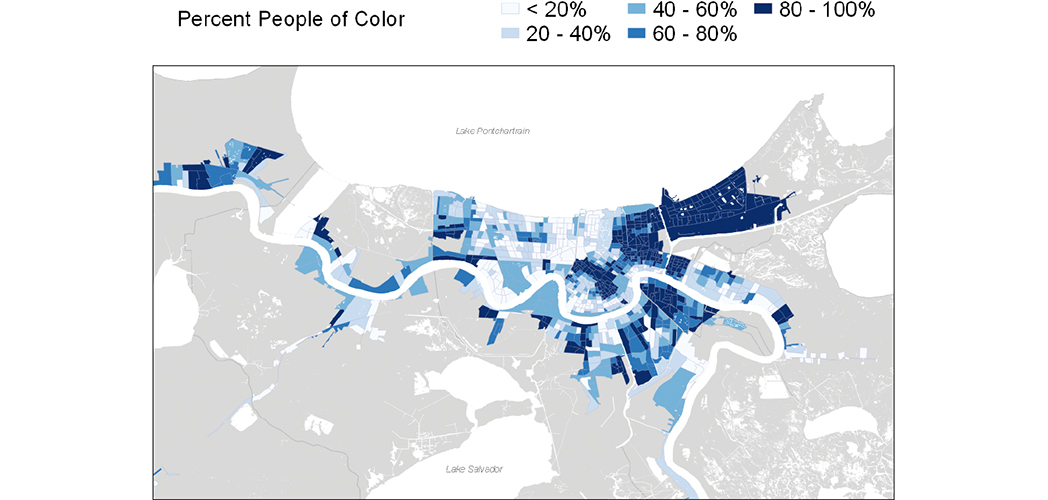
Correlations among TES and income and race reveal discrepancies in New Orleans, necessitating the need for a plan of action to ensure the entire population is best equipped to deal with the climate crisis. The census-block-level TES, relative median income, and POC maps highlight neighborhoods that are most vulnerable, for example the Desire Area and Fischer Development Neighborhood, providing a starting point in this crucial endeavor. These maps reveal that the Garden District has a TES ≥ 90, median income ≥ 160% of the area average, and POC < 20%. Higher tree canopy and income mean this neighborhood will be more resilient to extreme heat than the citywide average. Comparatively B. W. Cooper, located just one mile to the north, has a TES < 50, median income < 40% of the area average, and POC = 100%. Increasing tree canopy, access to air conditioning, and monetary resources in B. W. Cooper and other similar communities, is an important step towards ensuring climate equity in New Orleans.
Extreme rainfall
The 1-in-100-year extreme rainfall event for 2001–2020 will occur more frequently in New Orleans in a warming world. For 2041–2060, much of New Orleans falls in the 40- to 60-year return period category, and in 2071–2090, the city falls in the 20- to 40-year return period category (Fig. 4). This means the annual probability of the historical 1-in-100-year rainfall event will roughly double throughout 2041–2060, and triple throughout 2071–2090.
Figure 4: Future return period of the (2001-2020) 1-in-100 rainfall event
Changes in extreme rainfall frequency across southern Louisiana. In 2041–2060 the 1-in-100-year event will become a 1-in-40- to 60-year event. In 2071–2090, the 1-in-100-year event will become a 1-in-20- to 40-year event. This means the annual probability of a 1-in-100-year extreme rainfall event will roughly double in 2041–2060, and triple in 2071–2090. (Data source: REMO)
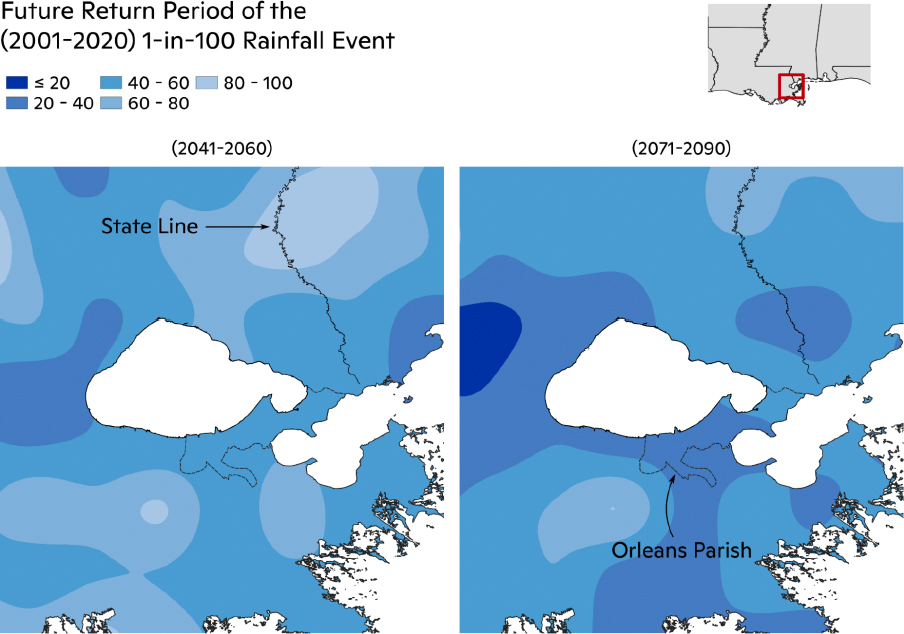
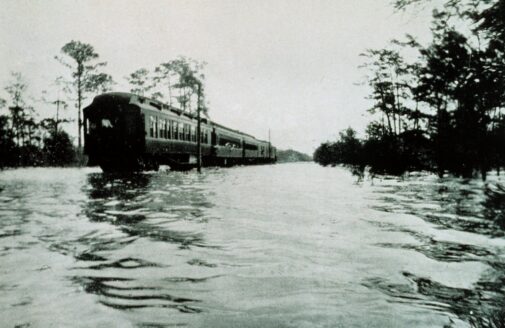
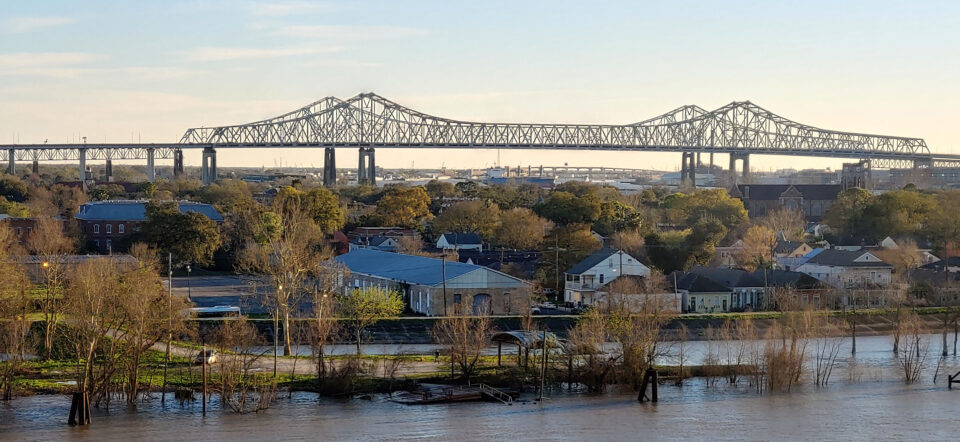
More frequent extreme rainfall events means increased flood risk across the city. New Orleans is already prone to flooding, with much of the city situated below sea level. Increased flooding events will further strain elderly and poorer populations who lack mobility and financial resources to rebound afterwards. Continued improvements in flood protection measures, such as levees, pumps, and permeable greenspace, as well as advanced warning and evacuation measures will help alleviate some of these burdens for the more vulnerable populations of New Orleans.
Results Summary
As a result of climate change, temperatures are set to increase in New Orleans. Extreme rainfall events will also become more frequent and sea levels will continue to rise, increasing future flood risk. The impacts associated with this increasing heat and precipitation will be felt differently across the city. Factors such as income, race, age, and availability of nearby greenspaces impact one’s capacity for resiliency during extreme heat and flooding events. Here we present findings on expected changes in maximum temperature, heat danger days, and extreme precipitation events paired with citywide income, race, and tree canopy data to help New Orleans create a more resilient future.