Climate risk assessment: Summit County, Utah
Along the Weber River near Oakley, Utah / photo by Tom Kelly (CC BY-NC-ND 2.0)
Background
The impacts of climate change on the frequency and severity of physical hazards are putting many communities at risk. As the threat of climate change grows, so too does the need for accessible information, tools, and expertise to support climate-resilient decision making for municipalities. Woodwell Climate Research Center (“Woodwell”) believes there is a need to localize and customize climate risk assessments. This information is critical for local government leaders as they make planning decisions, but it is not available to all communities. Woodwell believes that the science should be freely and widely available. To address this gap, Woodwell works with communities across the world, including Summit County, UT, to provide municipal climate assessments, free of charge.
Introduction
As a result of climate change, drought is expected to become more frequent and extreme in Summit County, UT. Coupled with population growth, more extreme droughts will increase water scarcity in the region. These dry conditions will also lengthen the wildfire season. Factors such as income, profession, and proximity to wildlands will affect residents’ capacity for resilience during drought and wildfire events. Here we present our findings on severe drought, water scarcity, and wildfire danger days paired with wildland-urban interface and income data to help Summit County create a more resilient future.
Drought
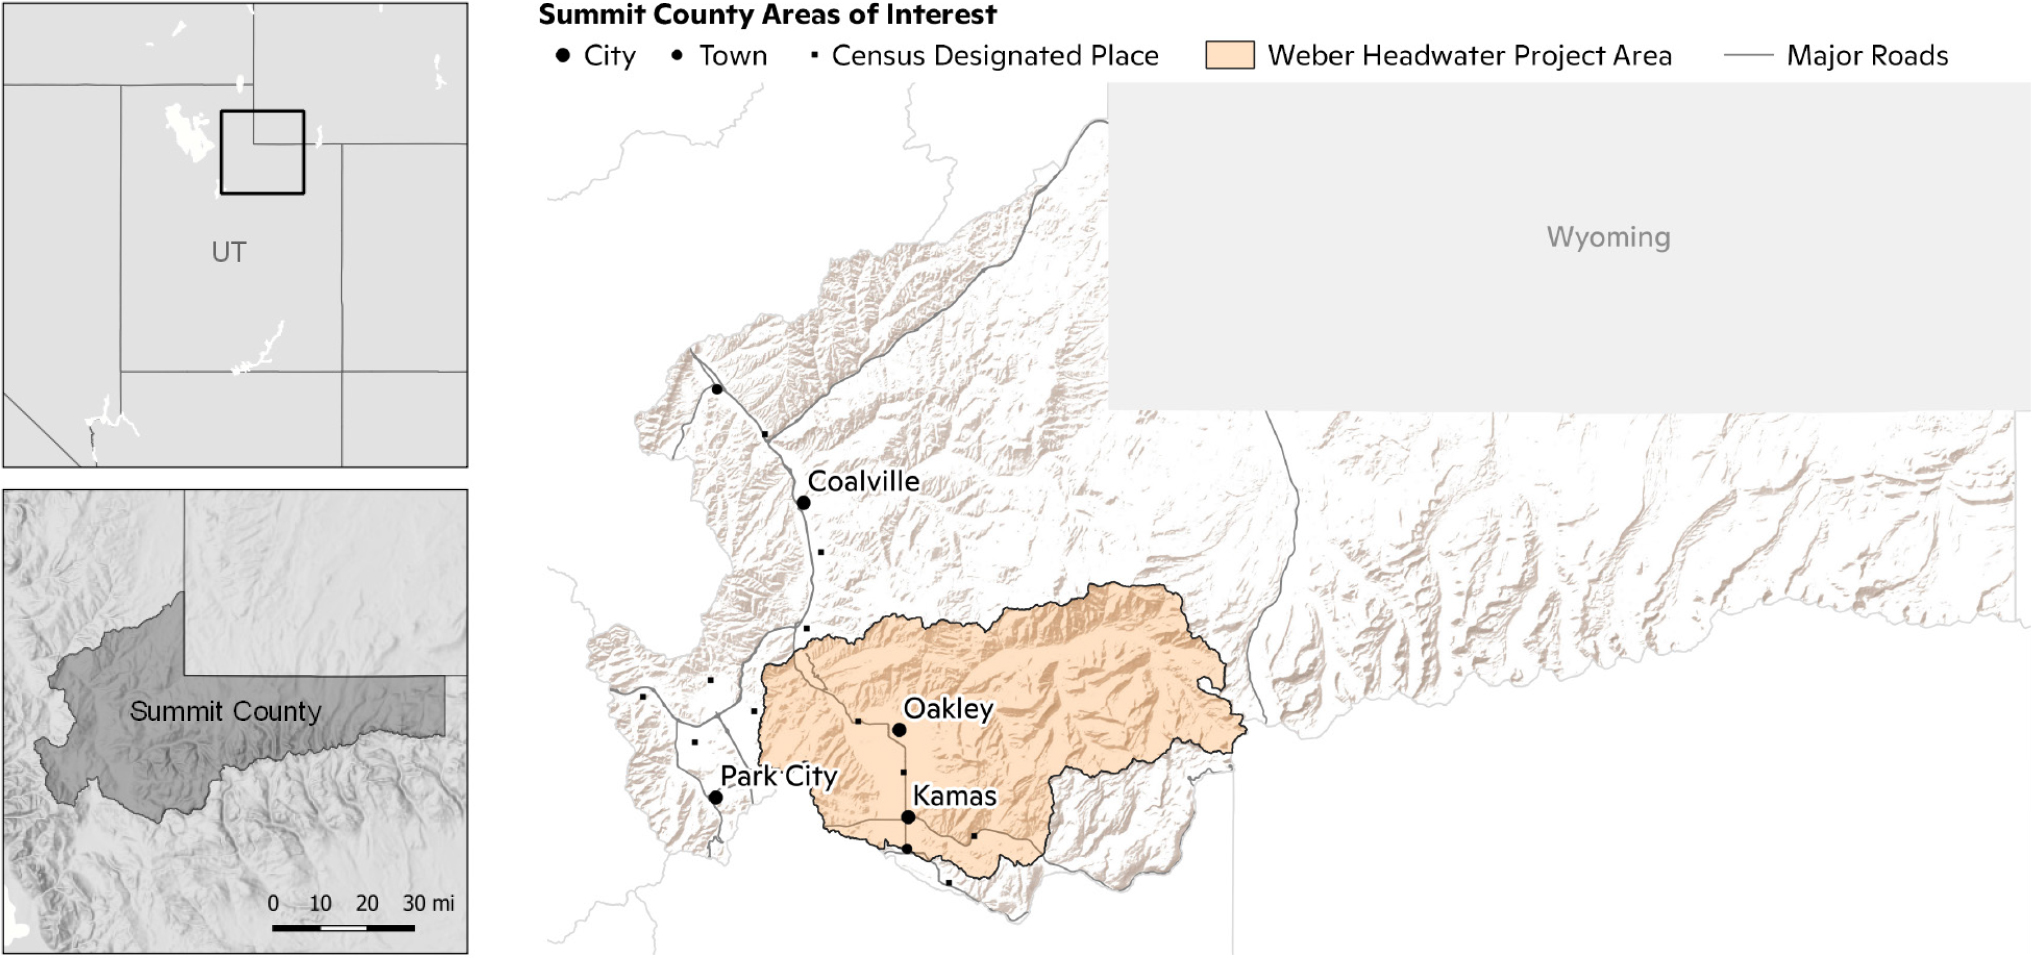
The frequency of severe drought is expected to increase in the future for Summit County. Drought stress is based on the Palmer Drought Severity Index (PDSI), a metric used by the U.S. Drought Monitor. In the past two decades (2000–2020), central Summit County experienced severe, or worse, drought ≤ 20% of the time (Fig. 1a). By mid-century (2040–2060) and late-century (2071–2090), severe drought stress will increase to ≤ 30% of the time for this region (Fig. 1b and c).
In 2000–2020, the northern and easternmost regions of Summit County experienced severe drought conditions around 40% of the time. These conditions are expected to increase to around 50% of the time by mid- to late-century.
Park City1 experienced severe drought conditions ≤ 20% of the time in 2000–2020, and this is expected to increase to around 36% of the time by mid-century and 41% by late-century.
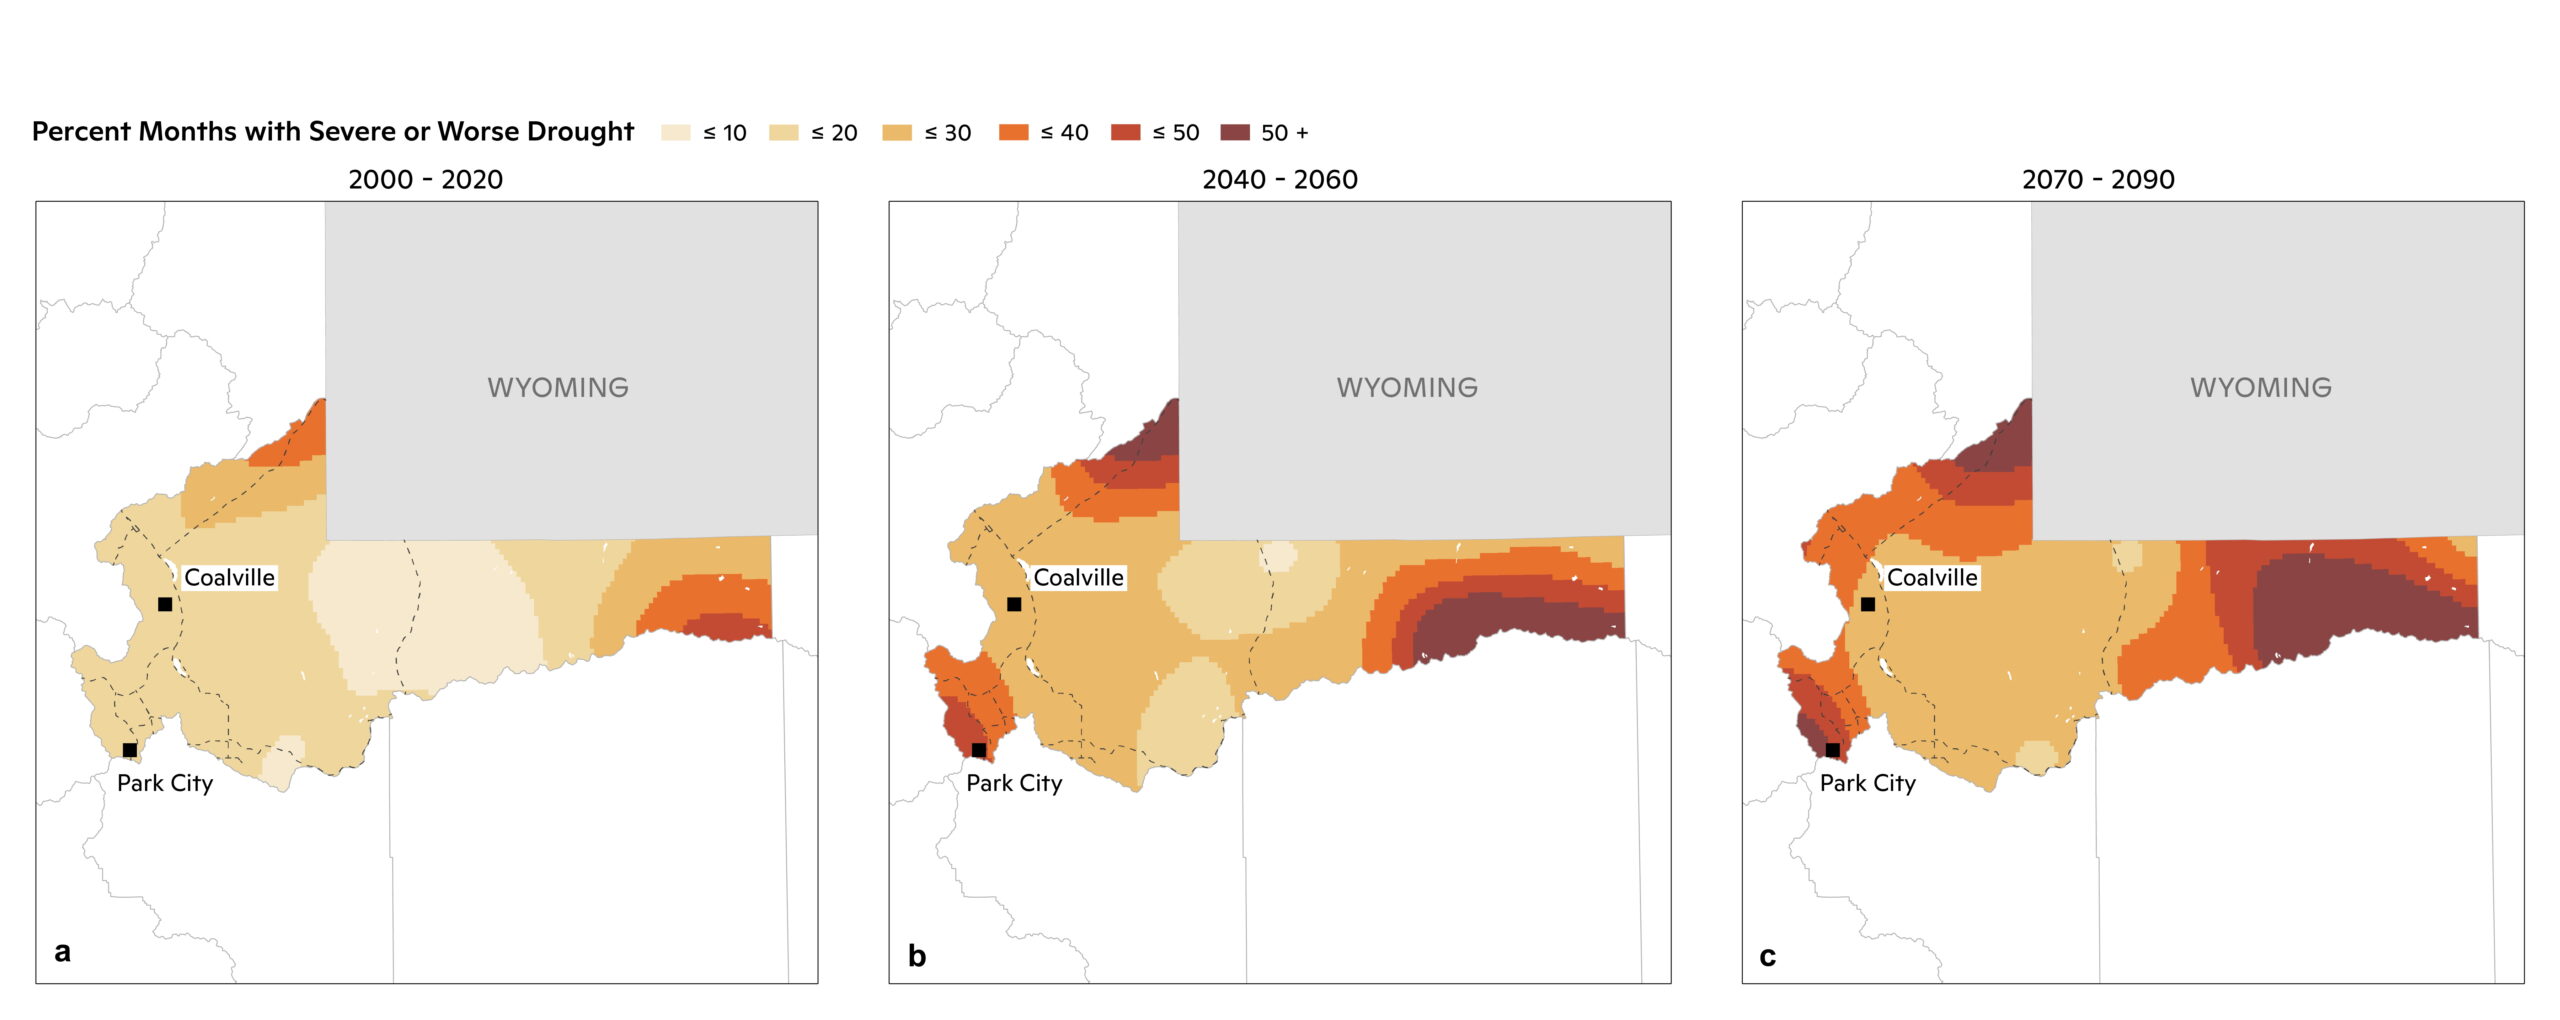
Figure 1: Percent of time with severe or worse drought stress. (a) 2000–2020. (b) 2040–2060. (c) 2070–2090. The length of time spent in severe, or worse, drought will increase across Summit County in the future. Central parts of the county experienced severe drought ≤ 20% of the time in 2000–2020, and this value is expected to increase to ≤ 30% by late-century. Northern, western, and easternmost edges of the county will experience a larger increase in the duration of drought stress, with some areas experiencing severe drought more than 50% of the time by mid- to late-century.
Water Scarcity
Whether used for drinking water, agriculture, or recreation, water underpins the health and economy of Summit County. Unfortunately, residents have already faced the hardships associated with water scarcity. Residents who rely on well water have experienced lower water quality as wells dry due to drought. In October 2021, a prolonged drought brought Echo Reservoir and Rockport Reservoir down to 11% and 26% of their total capacity. Towns responded by taking dramatic action in order to meet residents’ water needs. For example, Echo had water shipped in via fire truck. Both Oakley and Hennifer halted new construction that connected to city water. Farmers and ranchers have had to make hard decisions on how to irrigate crops and feed livestock. Small operators are especially at risk. As the climate changes, water will continue to be a crucial resource to preserve and protect.
We utilize a Water Scarcity Index (WSI) to determine the level of water scarcity in Summit County. The WSI is a relative global percentile ranking system based on ten hydrological variables using historical observations and future model projections.2 The Index indicates that 43,017 people living in Summit County face high water scarcity. This is equivalent to 97% of the county’s population. We use gridded 2020 population data from WorldPop3 to determine the population at risk. In the west where most of the county’s population resides in the major cities of Coalville, Park City, Oakley, and Kamas, the WSI score is in the 80th percentile compared to all other locations in the world, which we consider as high water scarcity (Fig. 2, left).
One factor driving high water scarcity is groundwater risk in the east. In the WSI, groundwater risk is measured by the time when groundwater pumping starts to impact environmental streamflow, a point known as the environmental flow limit, due to unsustainable rates of groundwater abstraction and low levels of groundwater recharge. Negative impacts of reaching the environmental flow limit include discharge from groundwater to streams to decline, reverse in direction, or stop altogether. In rural regions, groundwater is the primary and often only water source. As surface water resources become more strained, the reliance on groundwater will likely increase but will be limited by availability and quality. In the far eastern region of Summit County, the environmental flow limit was already reached as early as 2012 (Fig. 2, center). Roughly 5% of the population, or 2,136 people, live in an area where the limit was already exceeded. In the central Summit County and the Snyderville Basin, the environmental flow limit is not expected to be reached in this century. Park City may have additional exposure as they import water from the Jordanelle Reservoir, which surpassed its environmental flow limit in 1982.
The second main driving factor is high projected water stress throughout the county. Water stress is defined as the ratio of water withdrawals to available renewable water. In 2030 (midpoint of 2021–2040), the major cities in Summit County are projected to have a water stress ratio of 189% (Fig. 2, right). That means water demand is expected to be almost twice as much as available water supply. For reference, a high water stress ratio is considered to be 40%.4 The 2030 projected water stress in Coalville, Park City, Oakley, and Kamas is nearly 5x that amount. In the southern area of the Weber River watershed, the water stress level is projected to be as high as 250%. Generally, across the county, water stress increases 1.4x compared to 1986–2005 levels. High projected water stress in Summit County is driven by an increase in water demand as well as a decrease in water supply.
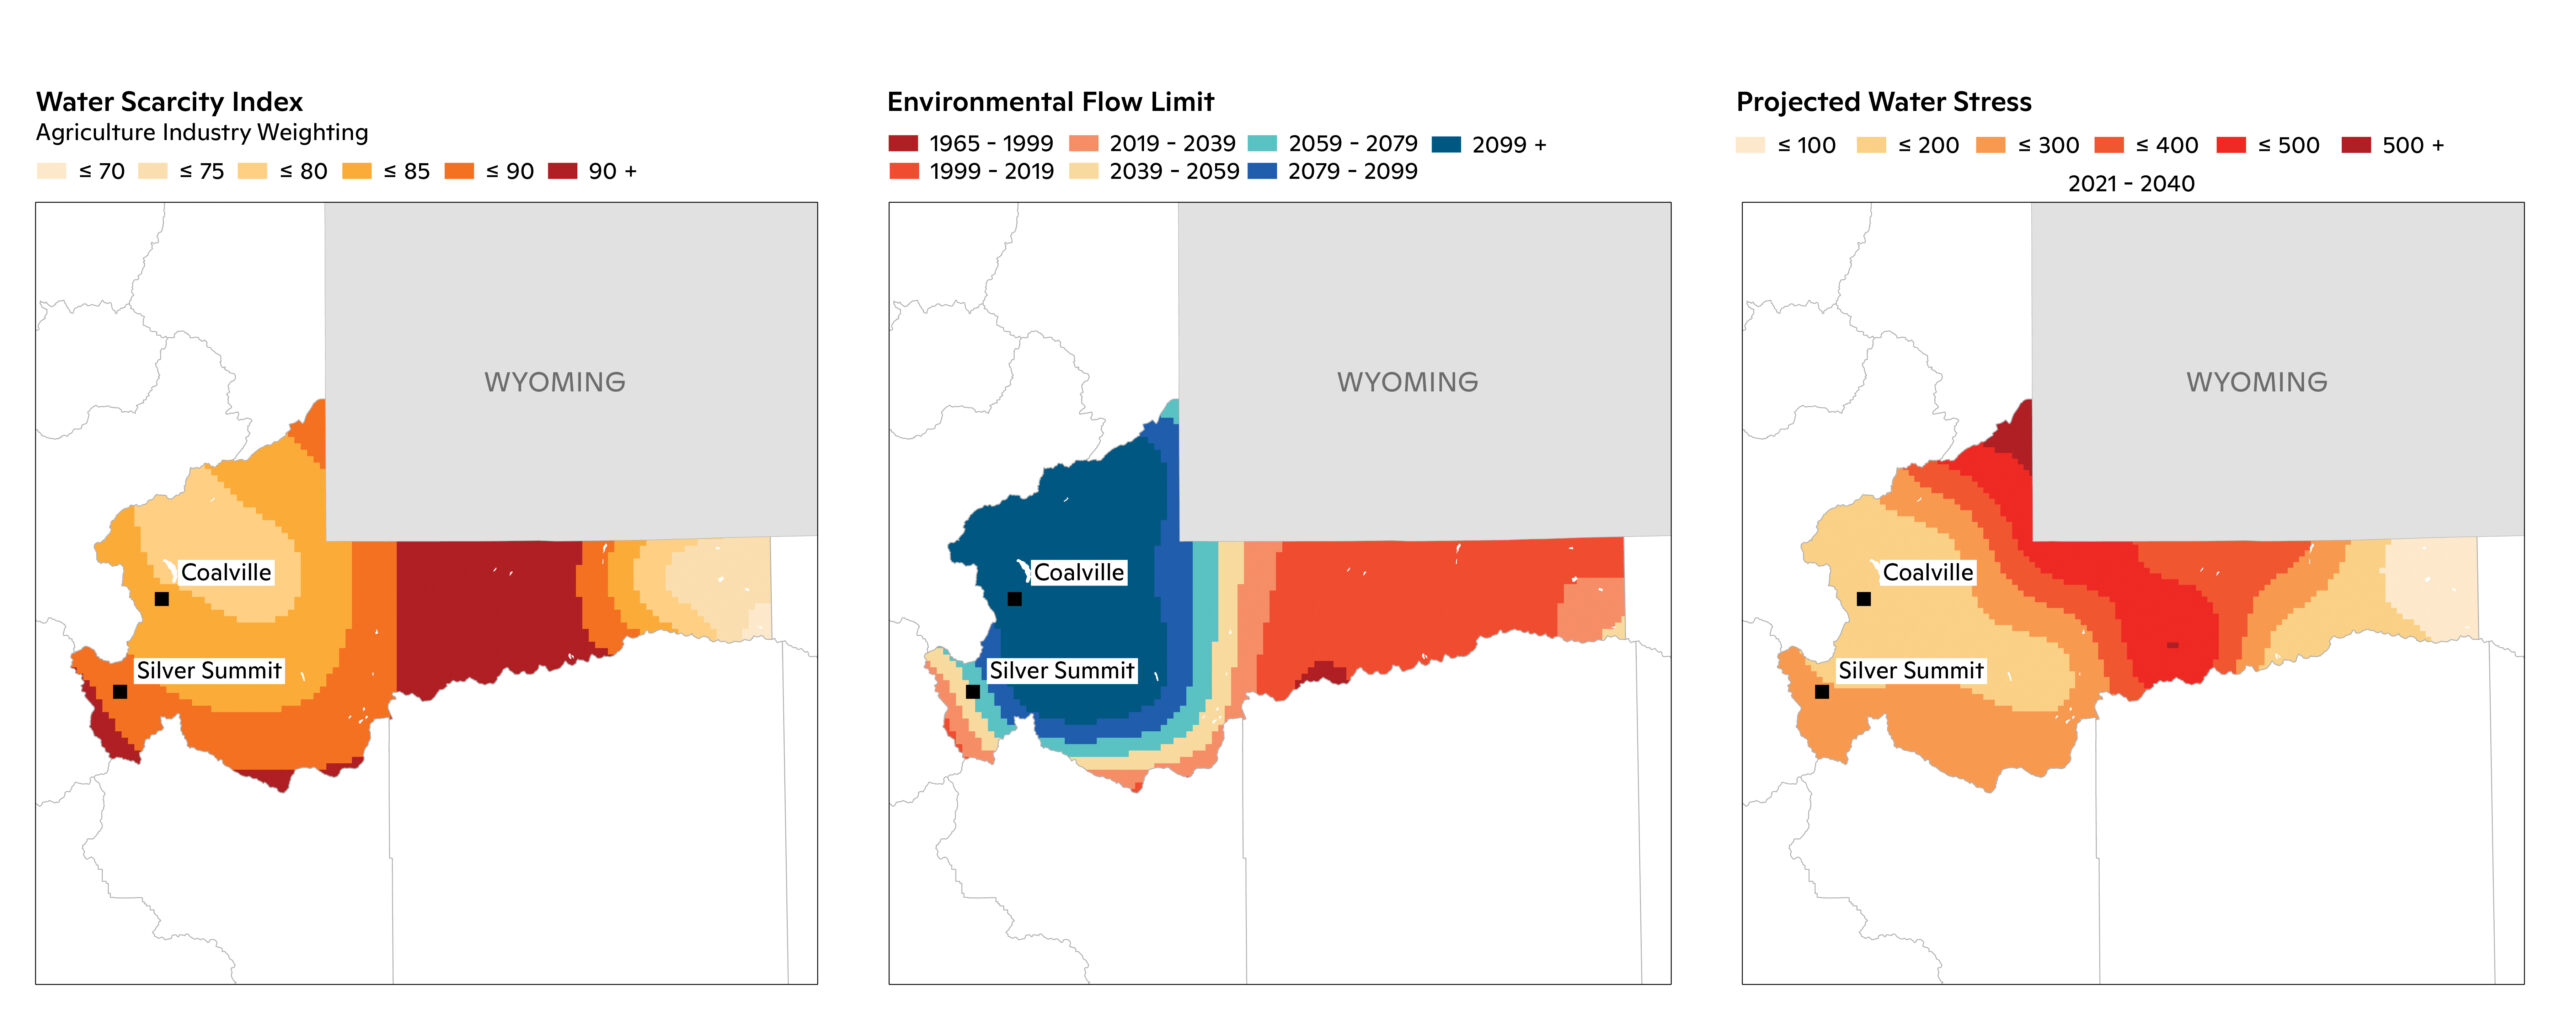
Figure 2: Water Scarcity Index (WSI) (left), year when environmental flow limits are reached (center) and projected water stress in 2021–2040 (right) in Summit County under climate scenario RCP8.5. High water scarcity in the WSI is defined as being at least in the 80th percentile, which corresponds to the literature-reviewed high water stress threshold of 40%. Data resolution is approximately 10 km but has been interpolated using a cubic method. Data was retrieved and adapted from Aqueduct Water Risk Atlas5 and de Graaf et al., 2019.6
Wildfire
To assess future change in wildfire danger for Summit County, we analyzed Fire Weather Index (FWI) data. FWI is a daily, unitless measurement of wildfire danger, derived from temperature, relative humidity, wind speed, and precipitation. This metric was developed by the Canadian Forest Service and is used globally, including in the United States, to quantify fire risk.
The change in wildfire danger days (Fig. 3) was calculated by determining the additional number of days per year in the future that are predicted to have a FWI value greater than the historical (2000–2020) extreme (1-in-20-day occurrence) FWI value. This threshold indicates a high-danger wildfire day, where fires have the potential to quickly grow out of control in the event of natural or human-caused ignition. By mid-century (2040–2060), much of Summit County can expect up to an additional six wildfire danger days per year (Fig. 3a). By late-century (2070–2090), central Summit County could experience up to an additional eight wildfire danger days per year compared to 2000–2020 (Fig. 3b). Easternmost and northwestern regions can expect an annual average additional 11 wildfire danger days by late-century, signifying a yearly increase of 60%.
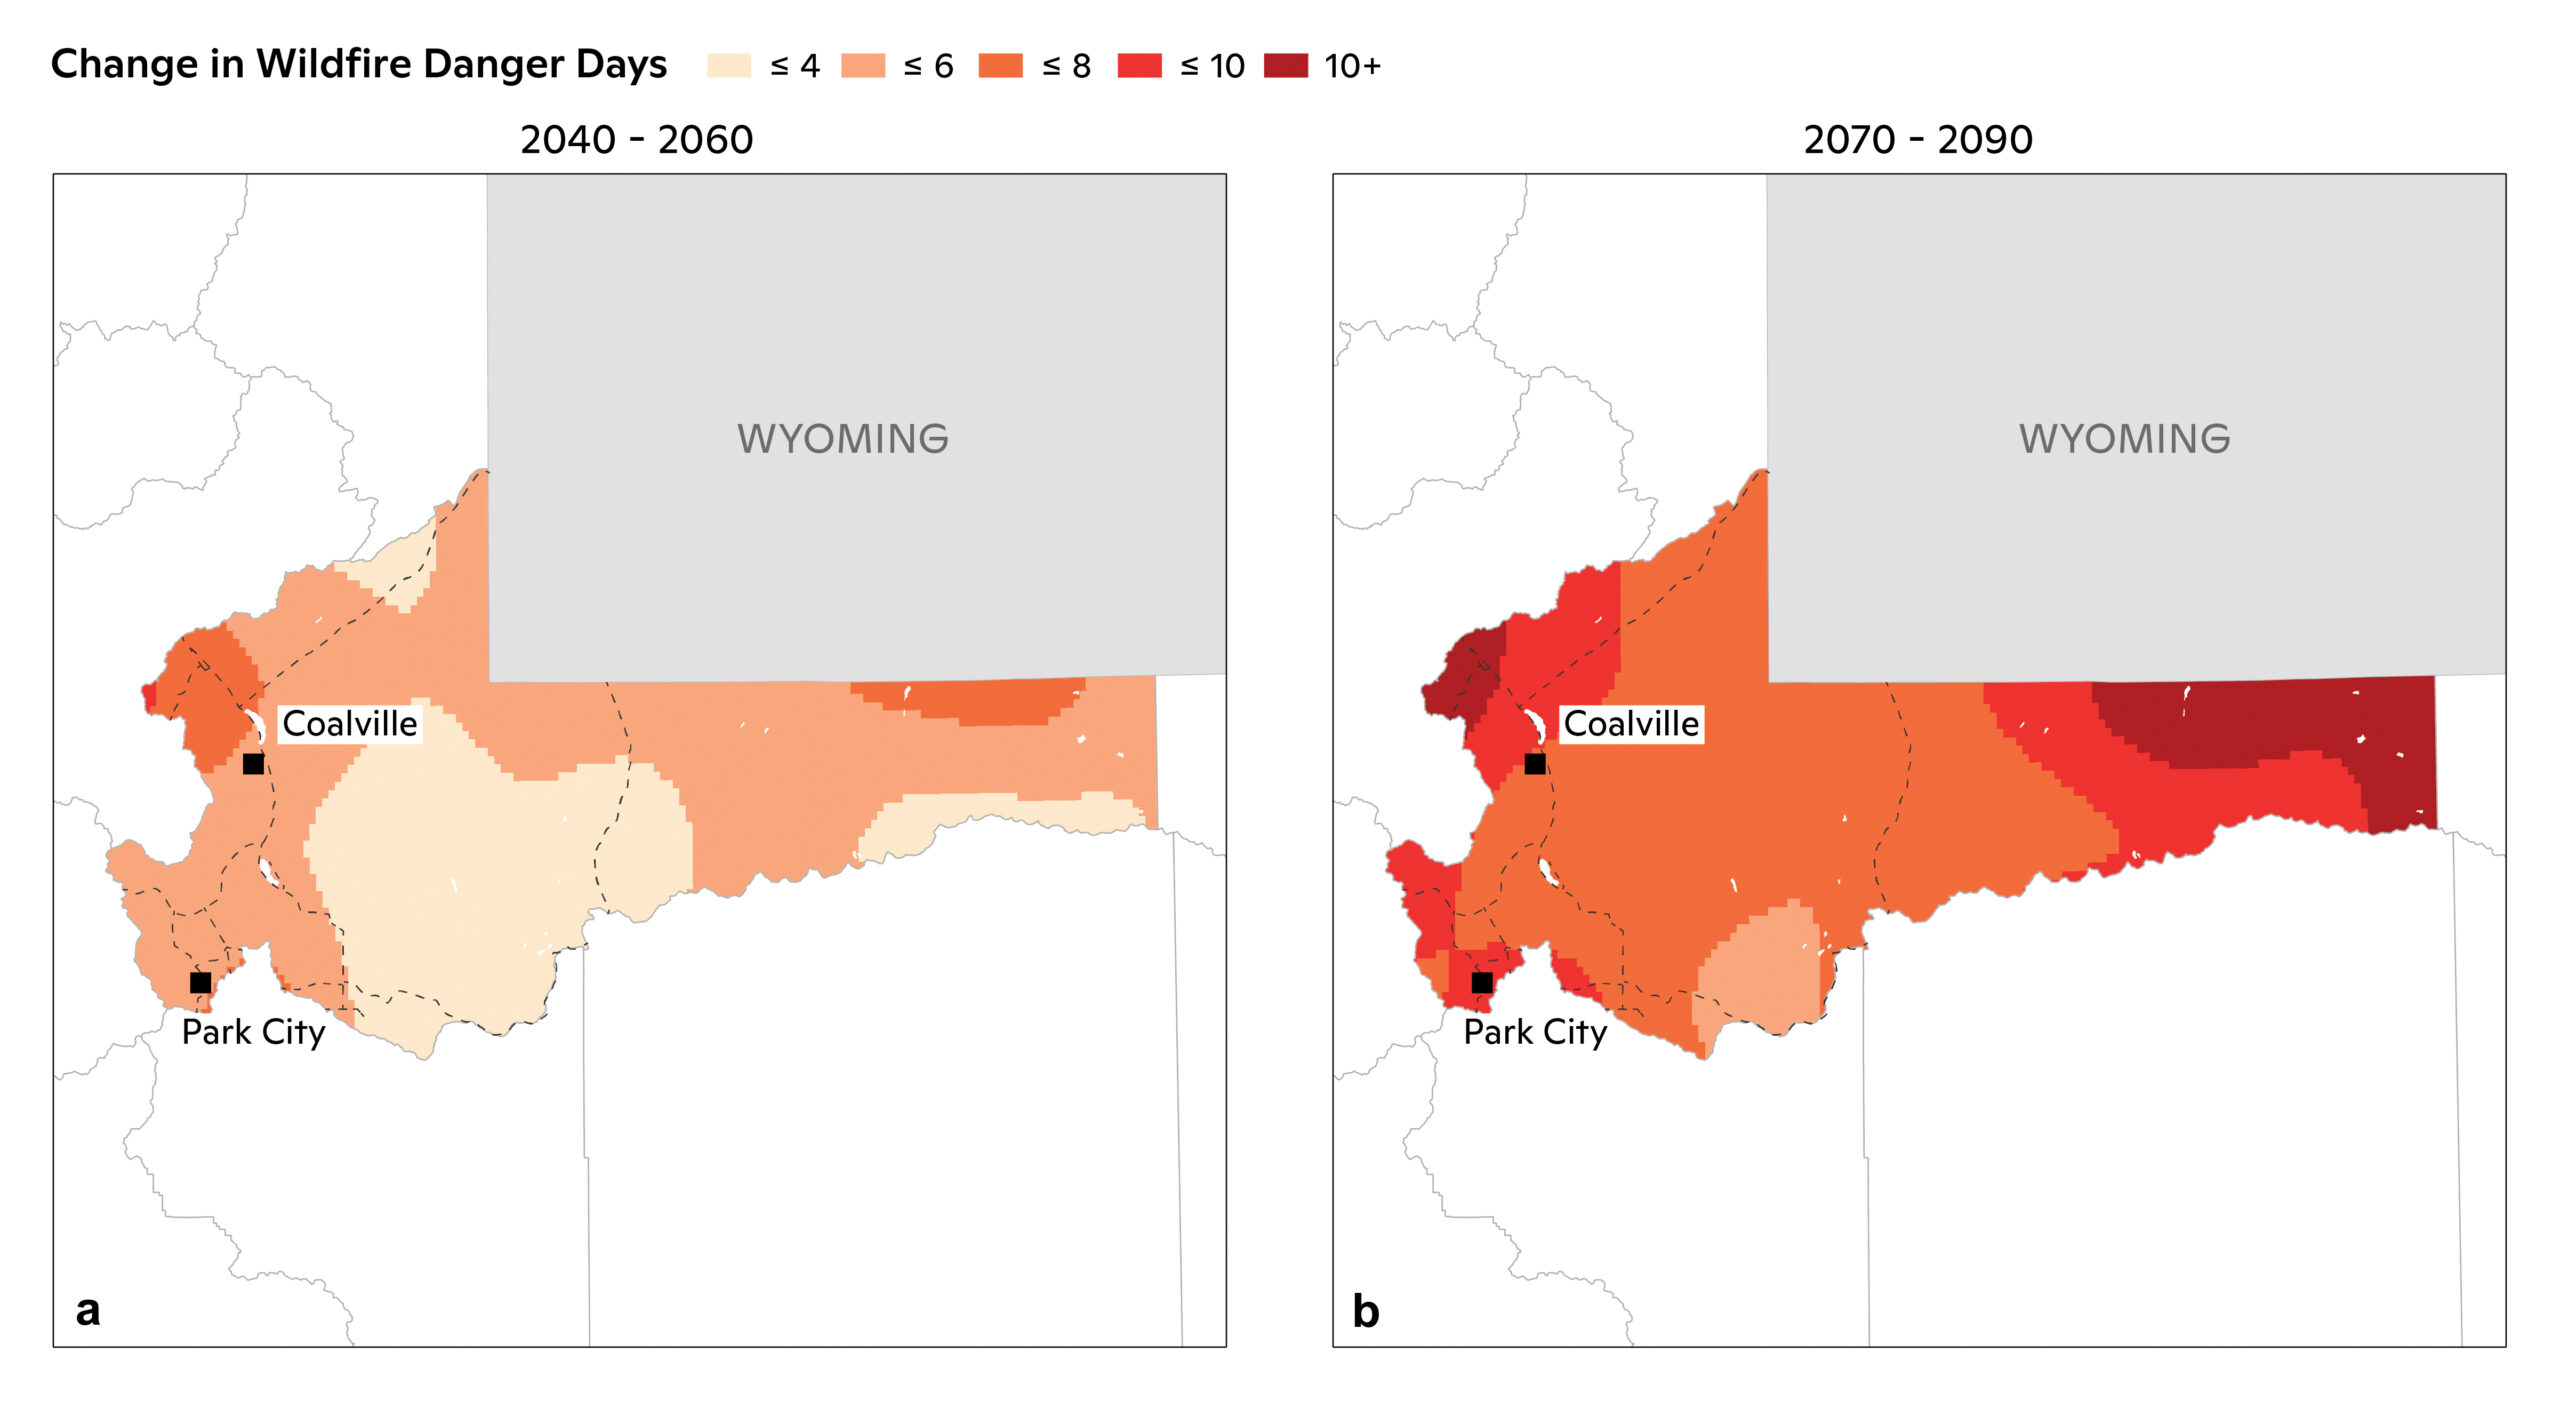
Figure 3: Change in wildfire danger days. (a) 2040–2060. (b) 2070–2090. Most of Summit County can expect up to an additional six wildfire danger days per year for 2040–2060. Central Summit County can expect around a week’s worth of additional wildfire danger days per year for 2070–2090, while easternmost and northwestern regions could see an additional 11 days, a yearly increase of 60%.
Like many communities, Summit County has limited funds and resources available for wildfire prevention and suppression. The county can better prepare for the future by focusing on regions where wildfires have the greatest potential to cause damage to life and property. Figure 4 overlays human footprint data7 (indicating populated areas, housing, roads, etc) with biomass8 (trees and other vegetation) from 2018 to identify wildland-urban interfaces—potential hotspots for costly wildfires. The western side of Park City stands out as a region with a high human footprint and large amount of burnable vegetation. This area is also projected to see an increase in wildfire danger days (Fig. 3) and should be a main focus for wildfire mitigation. Building up defensible space around properties on the edge of town and conducting low-intensity prescribed burns that clear underbrush are two actions that can help reduce wildfire risk and severity for the city and surrounding areas and cultivate a healthy, diverse forest.
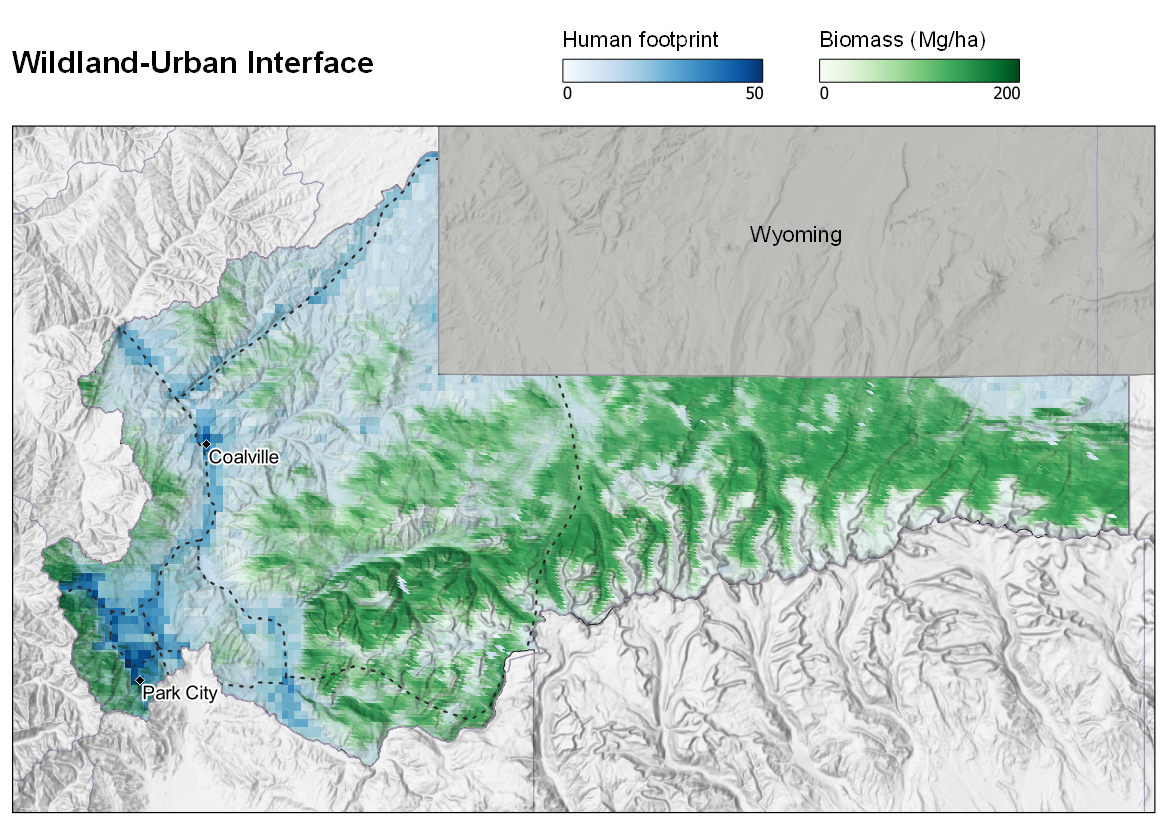
Figure 4: Wildland-urban interface. Human footprint data (unitless; derived from eight human pressure variables, including population density, nighttime light, roads, and built environment) overlaid with biomass (Megagrams per hectare; density of live woody vegetation). Areas with a high human footprint immediately adjacent to dense biomass indicate a transition zone between burnable vegetation and human development. Southwestern Summit County, near Park City, is the most prominent area where these two layers meet, indicating a priority region for allocation of wildfire funds and resources.
Past wildfire boundaries9 within Summit County from 1980–2019 are presented in Figure 5. The human footprint layer is once again overlaid to show where these historical fires occurred relative to human development. The county has experienced multiple wildfires along I-80 in the past three decades, including the 2013 Rockport Fire that burned over 2,000 acres near Atkinson and just a few miles northeast of Park City.
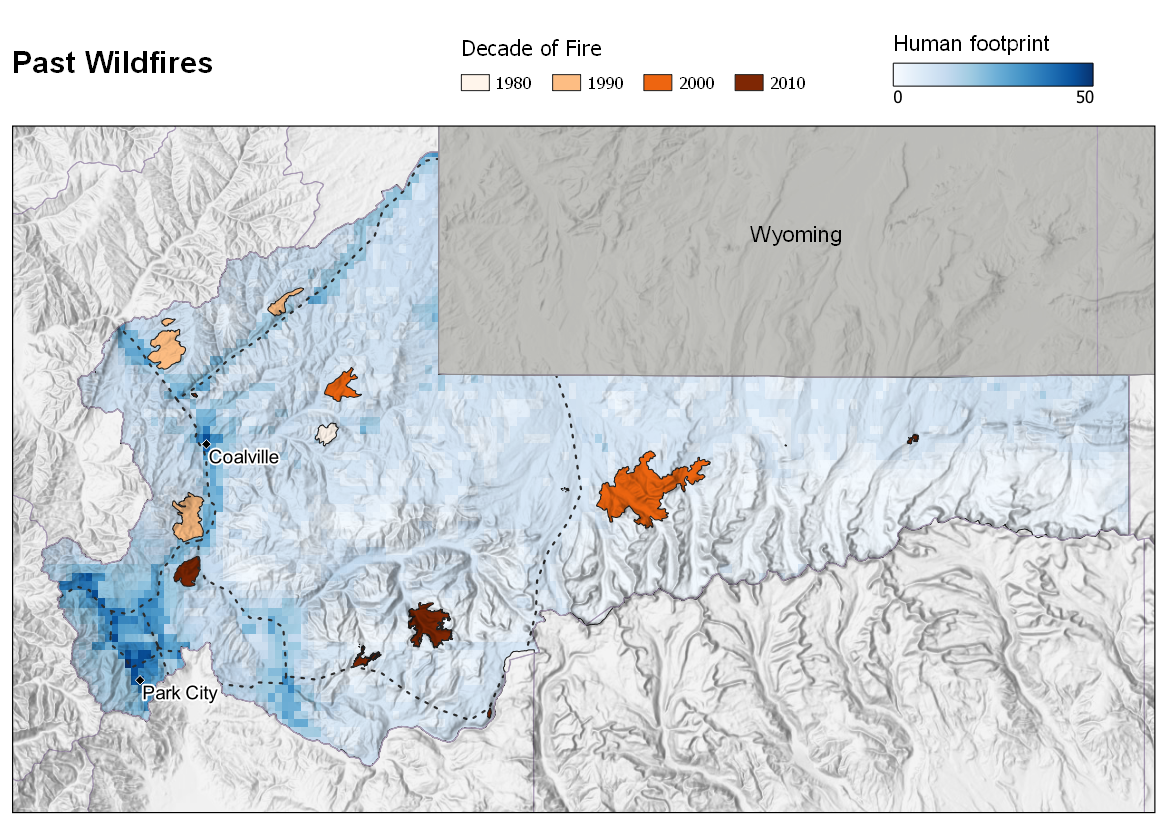
Figure 5: Past wildfires and human footprint. There have been multiple wildfires along the I-80 corridor in Summit County over the past three decades, including the 2013 Rockport Fire a few miles northeast of Park City.
Not all residents of Summit County will be impacted equally in the event of a wildfire. Those with limited income will be disproportionately affected, as they often lack the resources to clear areas around their homes and recover economically in the event of a fire. The percent of individuals living below the 200% Federal Poverty Level (FPL)10 in Summit County are displayed in Figure 6 to highlight census blocks with vulnerable individuals. More than 25% of the population in northwestern Summit County is below the 200% FPL, and multiple wildfires have occurred in this census block in recent decades. Multiple census blocks in populous southwestern Summit County, including parts of Park City, have between 20–25% of individuals below the 200% FPL. Allocating resources to help limited-income residents develop and maintain defensible spaces around their homes is one preventative measure Summit County can take to aid in the reduction of wildfire risk in vulnerable communities. Provision of additional support for limited-income individuals after a wildfire event is also crucial in helping disproportionately impacted residents in their recovery.
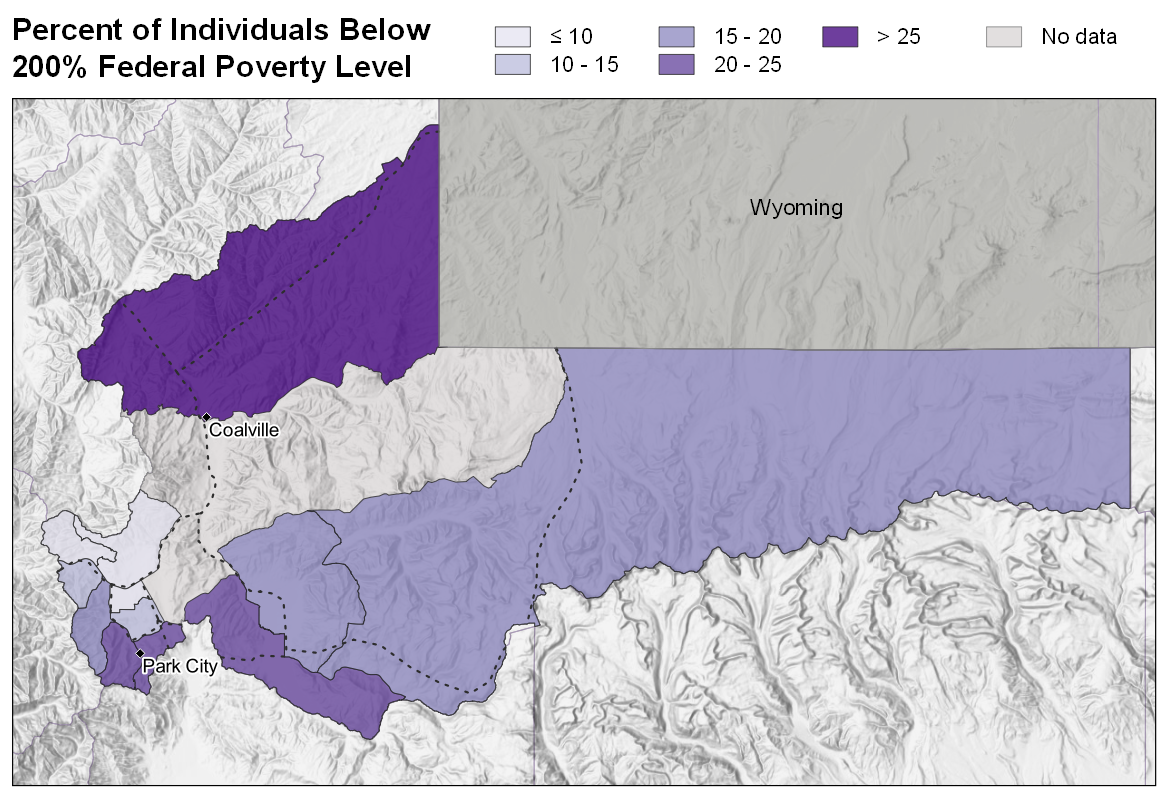
Figure 6: Percent poverty. Percent of individuals living below the 200% Federal Poverty Level (FPL) by census-block. Parts of southwestern Summit County, near Park City, have 20–25% of the population living below the 200% FPL, and these individuals will be disproportionately impacted by wildfires should they occur. This percent increases to > 25% for northwestern Summit County.