Heat Analysis of Kerala, India
This analysis and the associated data aim to inform the ongoing revision of the state’s Heat Action Plan, to better understand and prepare for future heat extremes.

In 2023, Kerala experienced its deadliest heatwave during one of the warmest years in the past century. This analysis and the associated data (already shared with Kerala State Disaster Management Authority (KSDMA)) aim to inform the ongoing revision of the State’s Heat Action Plan, to better understand and prepare for future heat extremes. In partnership with KSDMA, GeoHazards International (GHI), and GeoHazards Society (GHS), a team from Woodwell Climate Research Center conducted an analysis combining daily station temperature data with downscaled model output to examine increasing heat trends in Kerala, India.
The analysis was presented at a hybrid consultation workshop organized by KSDMA last month. Drs. Abby Lute and Alex Naegele from the Climate Risk Program spoke to the audience of key stakeholders—including local meteorologists, hazard analysts, and other technical experts—about Kerala’s heat projections and the methodology behind them. The workshop included further discussions on the integration of Woodwell’s projections into the State’s Heat Action Plan and the impacts of heat on health, urban planning, agriculture, and social equity.
Historically, temperatures are warmest in inland, lowland regions, and the coolest temperatures occur at high elevations. March is often the hottest month of the year for many locations throughout Kerala, and the modeled historical maximum near-surface air temperature (Tas,max) is shown in Figure 1.
Figure 2 shows the seasonal cycle of the monthly averaged daily Tas,max from observations 1 and modeled projections adjusted to observations using the delta method2 under a range of scenarios and time periods for Kerala’s capital city, Trivandrum. Observations from 1990 to 2020 are shown by the solid black line. The yellow lines represent the 2030 (2020–2040) time period, and the red lines represent the mid-century (2050, 2040–2060) time period. Similarly, the dashed lines show the SSP2-4.5 scenario (representing a middle-of-the road pathway), and the solid lines show the SSP5-8.5 scenario (representing a fossil fuel-dependent pathway). It should be noted that the model output underestimated historical temperature observations (Appendix, Figures A10–A18), and therefore our analysis focuses primarily on the change between historical and future time periods (Figures 2 and 3), rather than on the absolute values themselves (Figure 1).
Throughout the state, temperatures are highest in the spring, peaking in March or April. Temperatures drop during the summer monsoon season, from June through August. By mid-century, all stations can expect an annual average increase of at least ~1°C above recently observed (1990–2020) temperatures, reaching up to ~1.4°C under the SSP5-8.5 scenario.
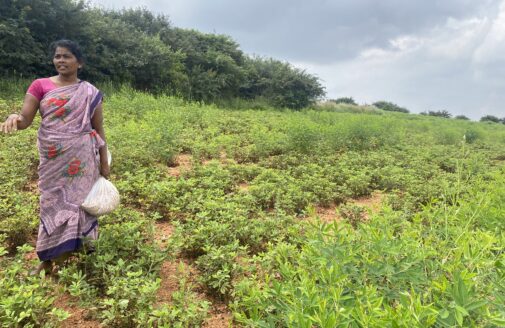
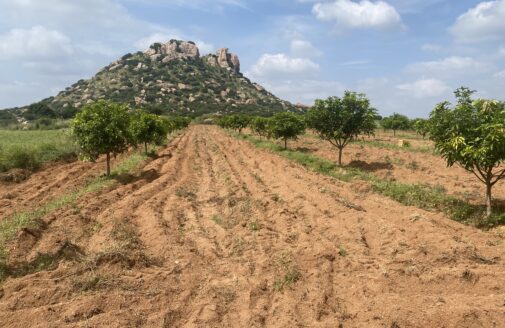
Research area
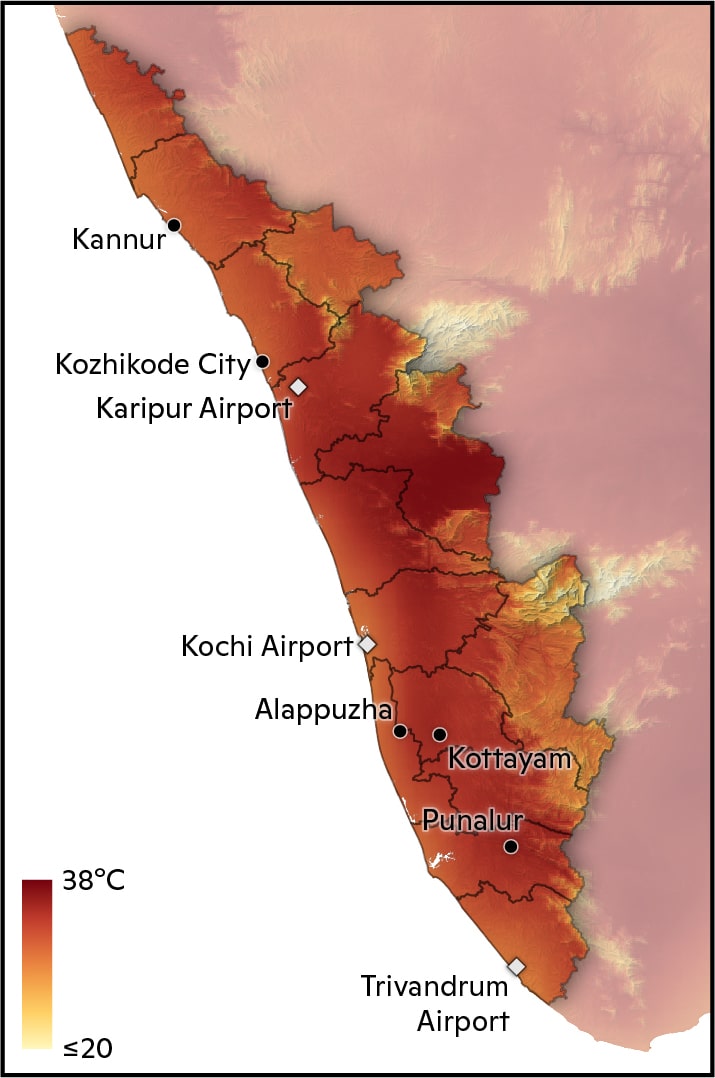
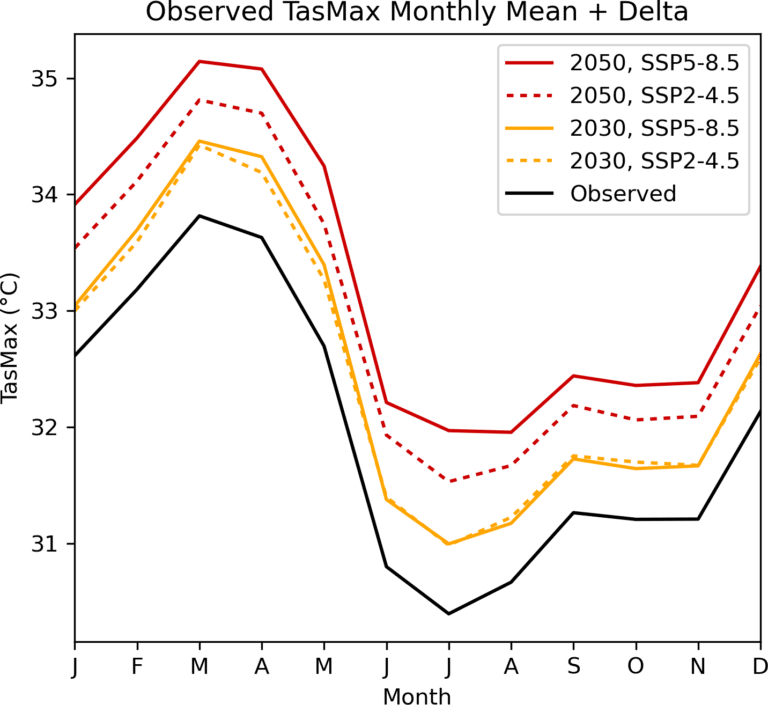
Figure 1. (left) The historical (1990–2020) March average Tas,max from CHELSA-downscaled model output.
Figure 2. (right) Trivandrum City Temperature (°C)
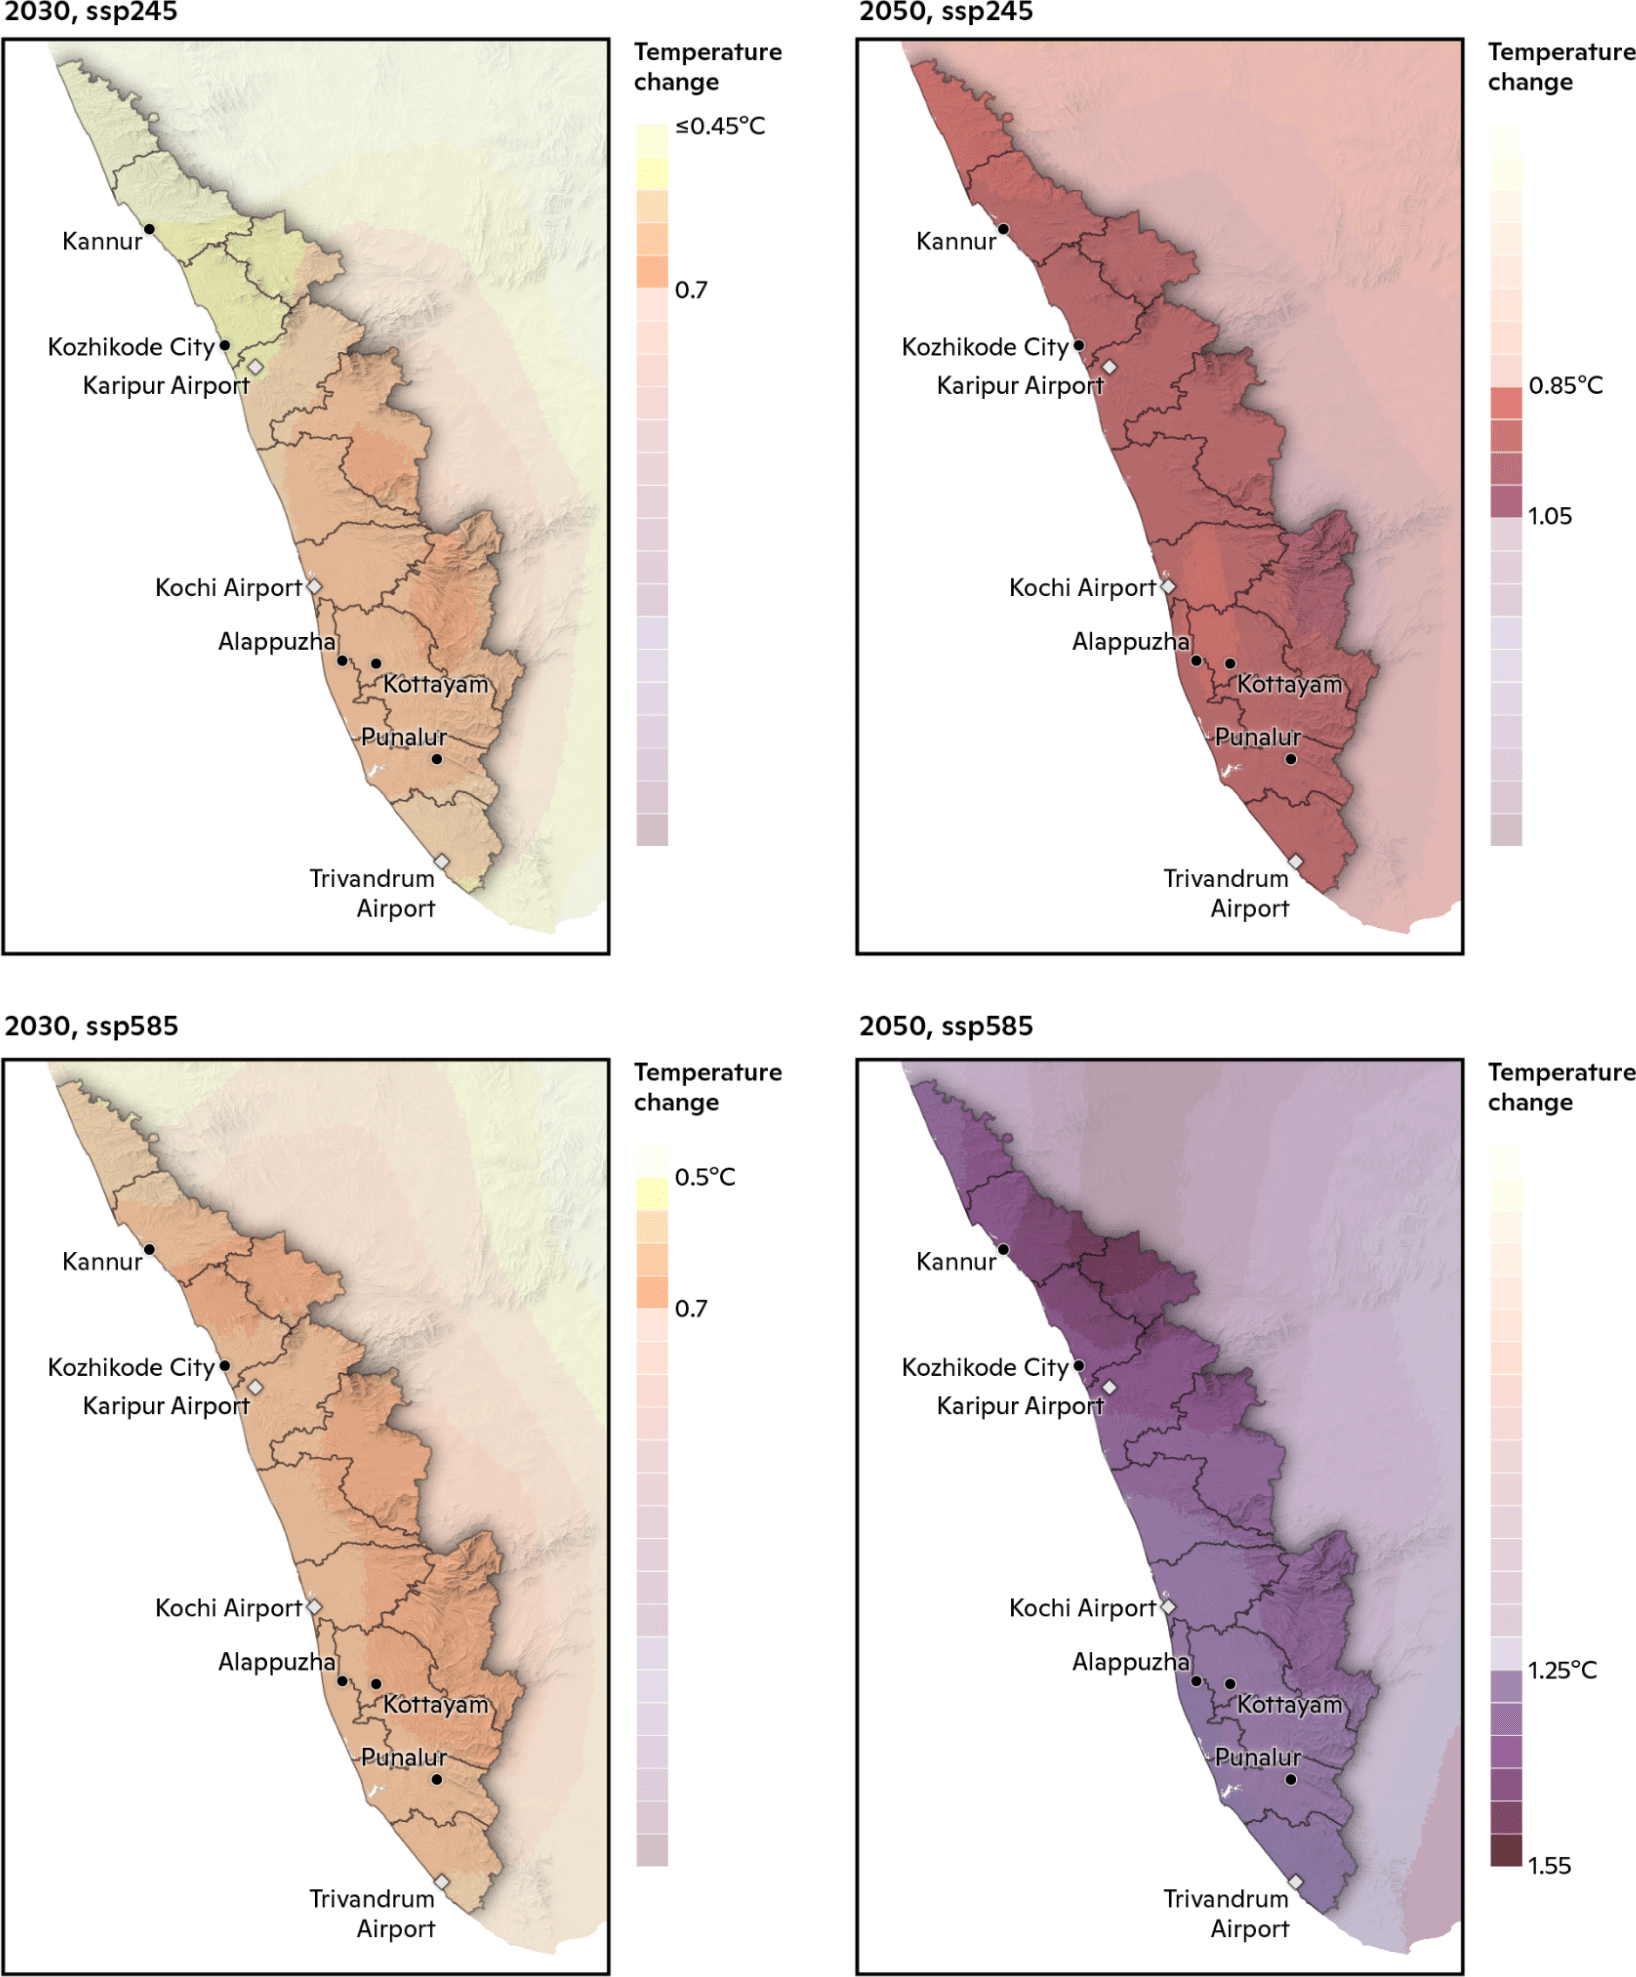
Figure 3. The projected increase in March Tas,max under two time periods: 2030 (2020–2040) (left) and 2050 (2040–2060) (right), and two scenarios: SSP2-4.5 (top) and SSP5-8.5 (bottom). The colorbar range is consistent across subplots.
In the near-future (2030), March temperatures are projected to increase between 0.45 and 0.7°C under both scenarios. By mid-century (2050), the two scenarios diverge, with an increase of ~1°C under SSP2-4.5, and an increase of 1.25–1.55°C under SSP5-8.5.
In Kerala, summer has been arriving earlier and lasting longer. Considering the expanding summer season (February–May), we show that extreme temperatures3 will rise even more than the monthly averages. Under the SSP2-4.5 scenario, the 95th percentile temperature is expected to increase by at least 1°C by mid-century (Figure 4). Under the SSP5-8.5 scenario, the 95th percentile temperature is expected to increase by at least 1.5°C by mid-century, with the change at some stations approaching 2°C (Figure 5).

Figure 4. Projected daily Tas,max distributions for February–May under the SSP2-4.5 scenario at each station. The 95th percentile temperature is highlighted for the historical (1995–2015), 2030 (2020–2040), and 2050 (2040–2060) time periods.
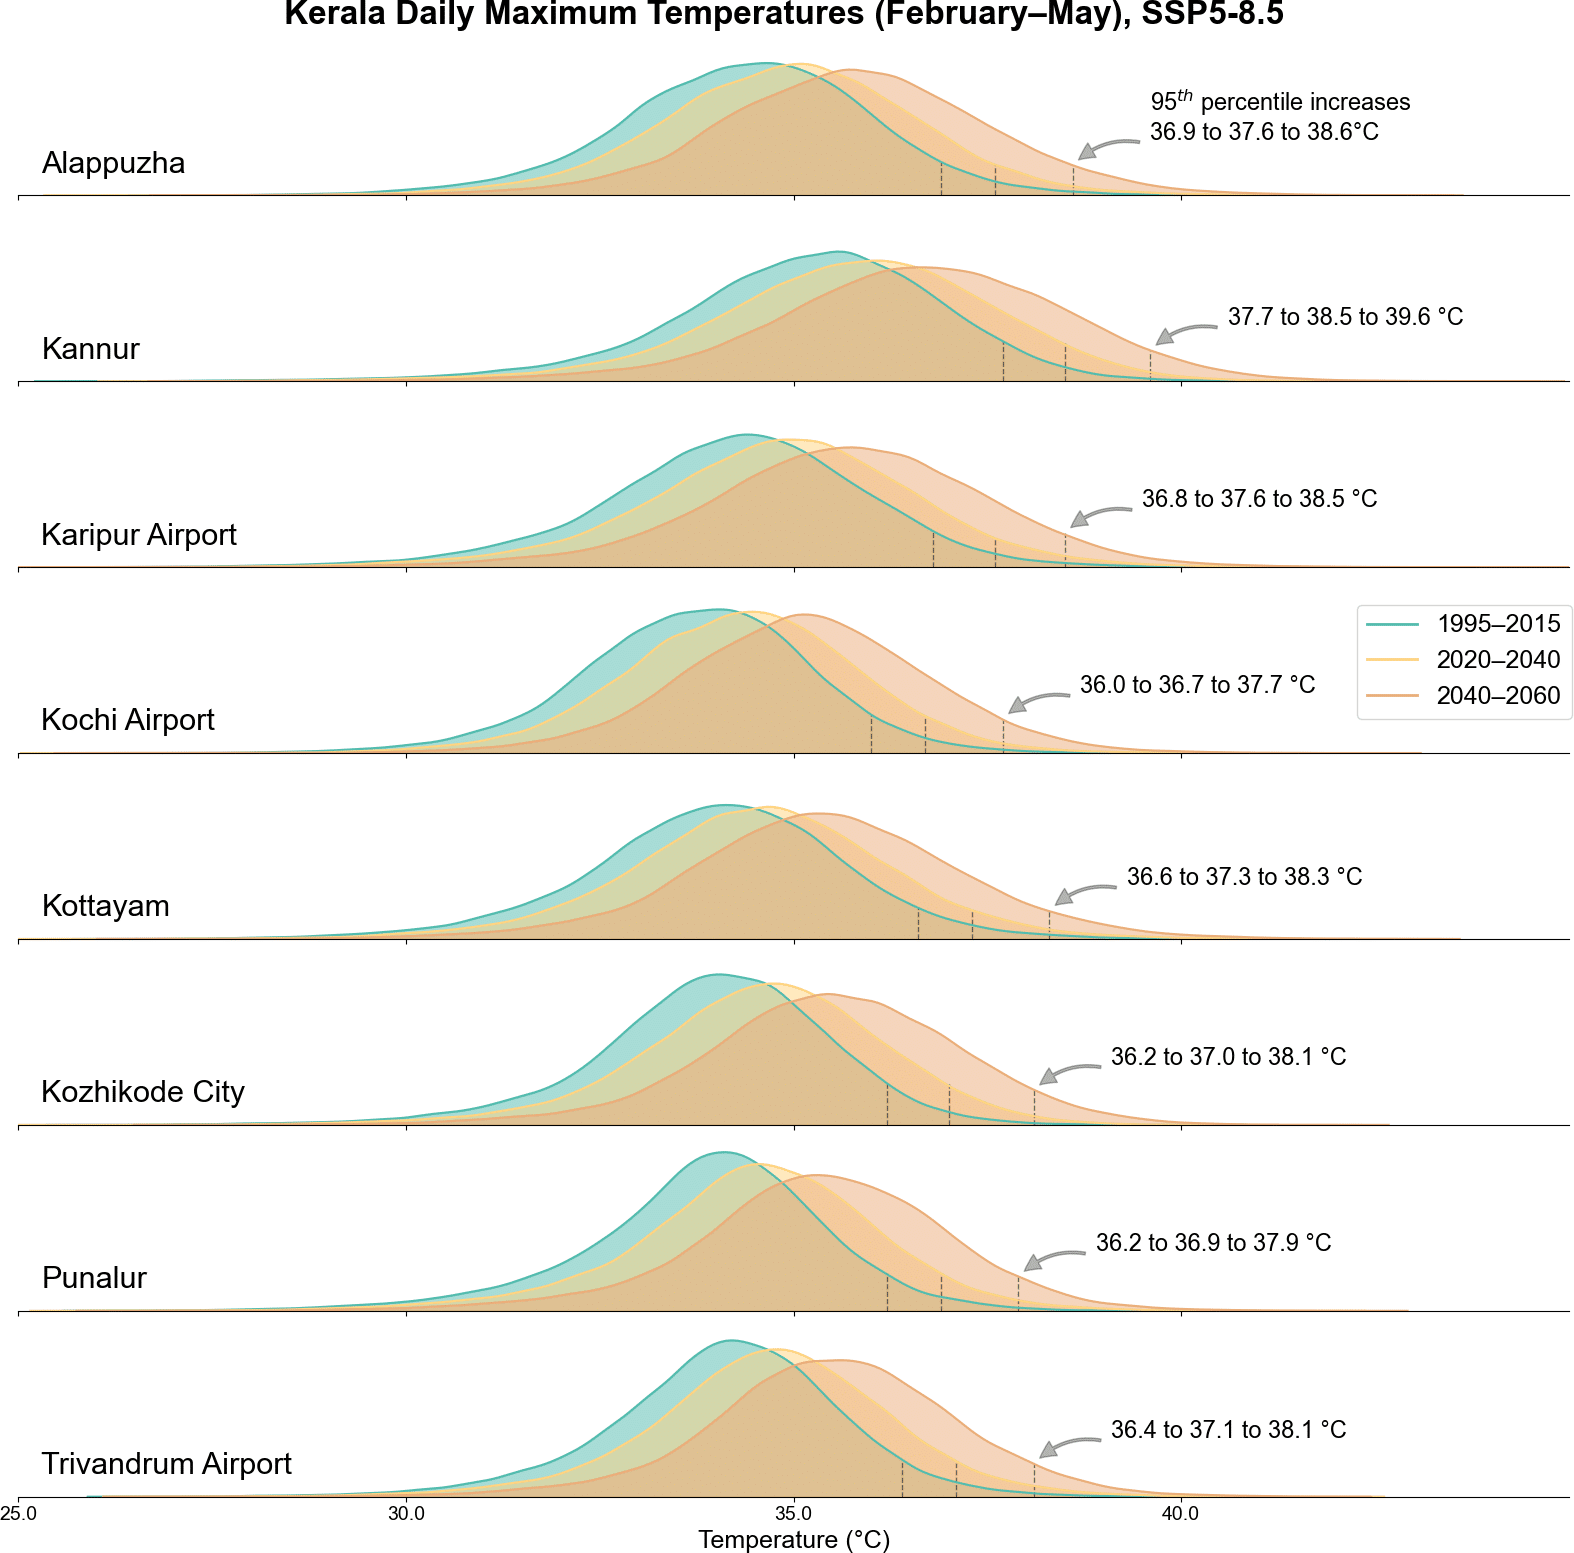
Figure 5. Projected daily Tas,max distributions for February–May under the SSP5-8.5 scenario at each station. The 95th percentile temperature is highlighted for the historical (1995–2015), 2030 (2020–2040), and 2050 (2040–2060) time periods.
1 Daily observational station data was provided by KSDMA.
2 CHELSA-downscaled monthly climatology data and the delta method are described in the Appendix.
3 CHELSA-downscaled daily W5E5 data is described in the Appendix.