Climate risk assessment: Kentucky River Area Development District
The impacts of climate change on the frequency and severity of physical hazards have already put communities at significant risk. As the threat of climate change intensifies, the need for accessible information, tools, and expertise to support climate-resilient decision-making grows more urgent. From local communities to entire countries, effective planning and response are crucial. Woodwell Climate Research Center collaborates with local government leaders to tailor and localize climate risk assessments. Despite the critical importance of this information for informed planning decisions, it remains largely inaccessible to many local government leaders. Woodwell advocates for the free and widespread availability of this vital science. To bridge this gap, Woodwell partners with communities worldwide, including the Kentucky River Area Development District (KRADD), providing comprehensive community climate risk assessments at no cost.
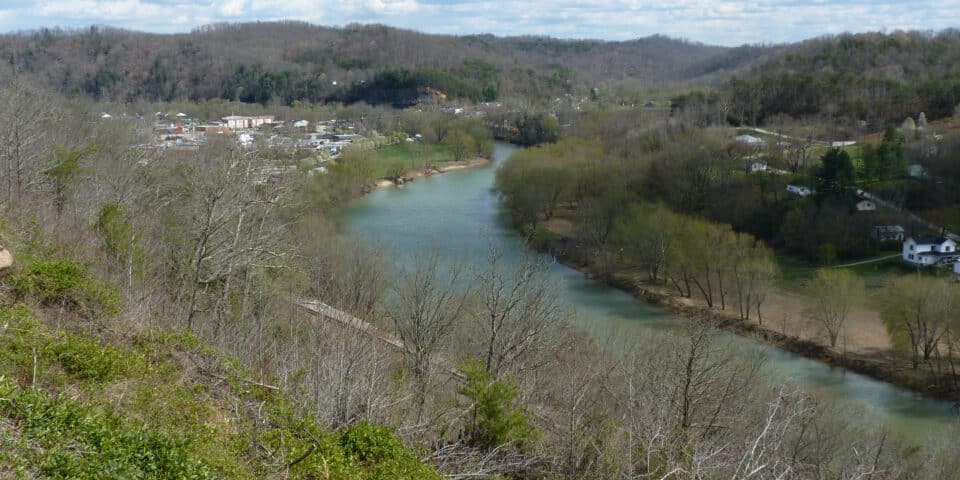
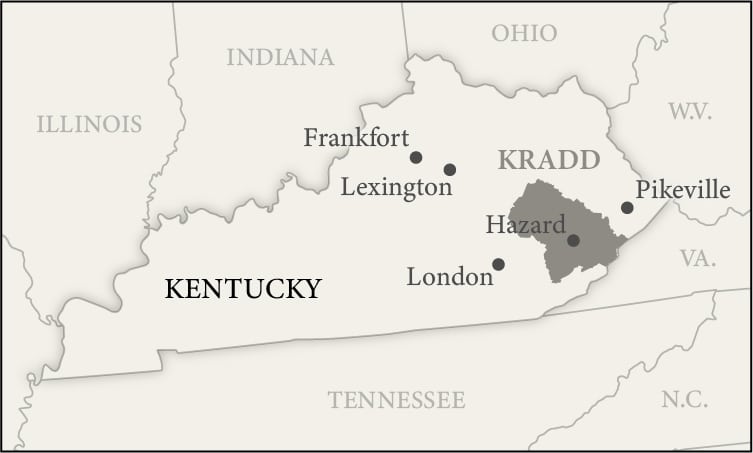
Research area
Results summary
As a result of climate change, flood risk is projected to increase in KRADD. The probability of the present-day 100-year rainfall event, a useful indicator of flood risk, is expected to be five times greater by midcentury and ten times greater by the end of the century. Heavier rainfall will translate into greater flood depths and extent for KRADD. Here we present our findings on extreme precipitation and flooding to help KRADD in its plans to create a more resilient future for all residents.
Extreme rainfall
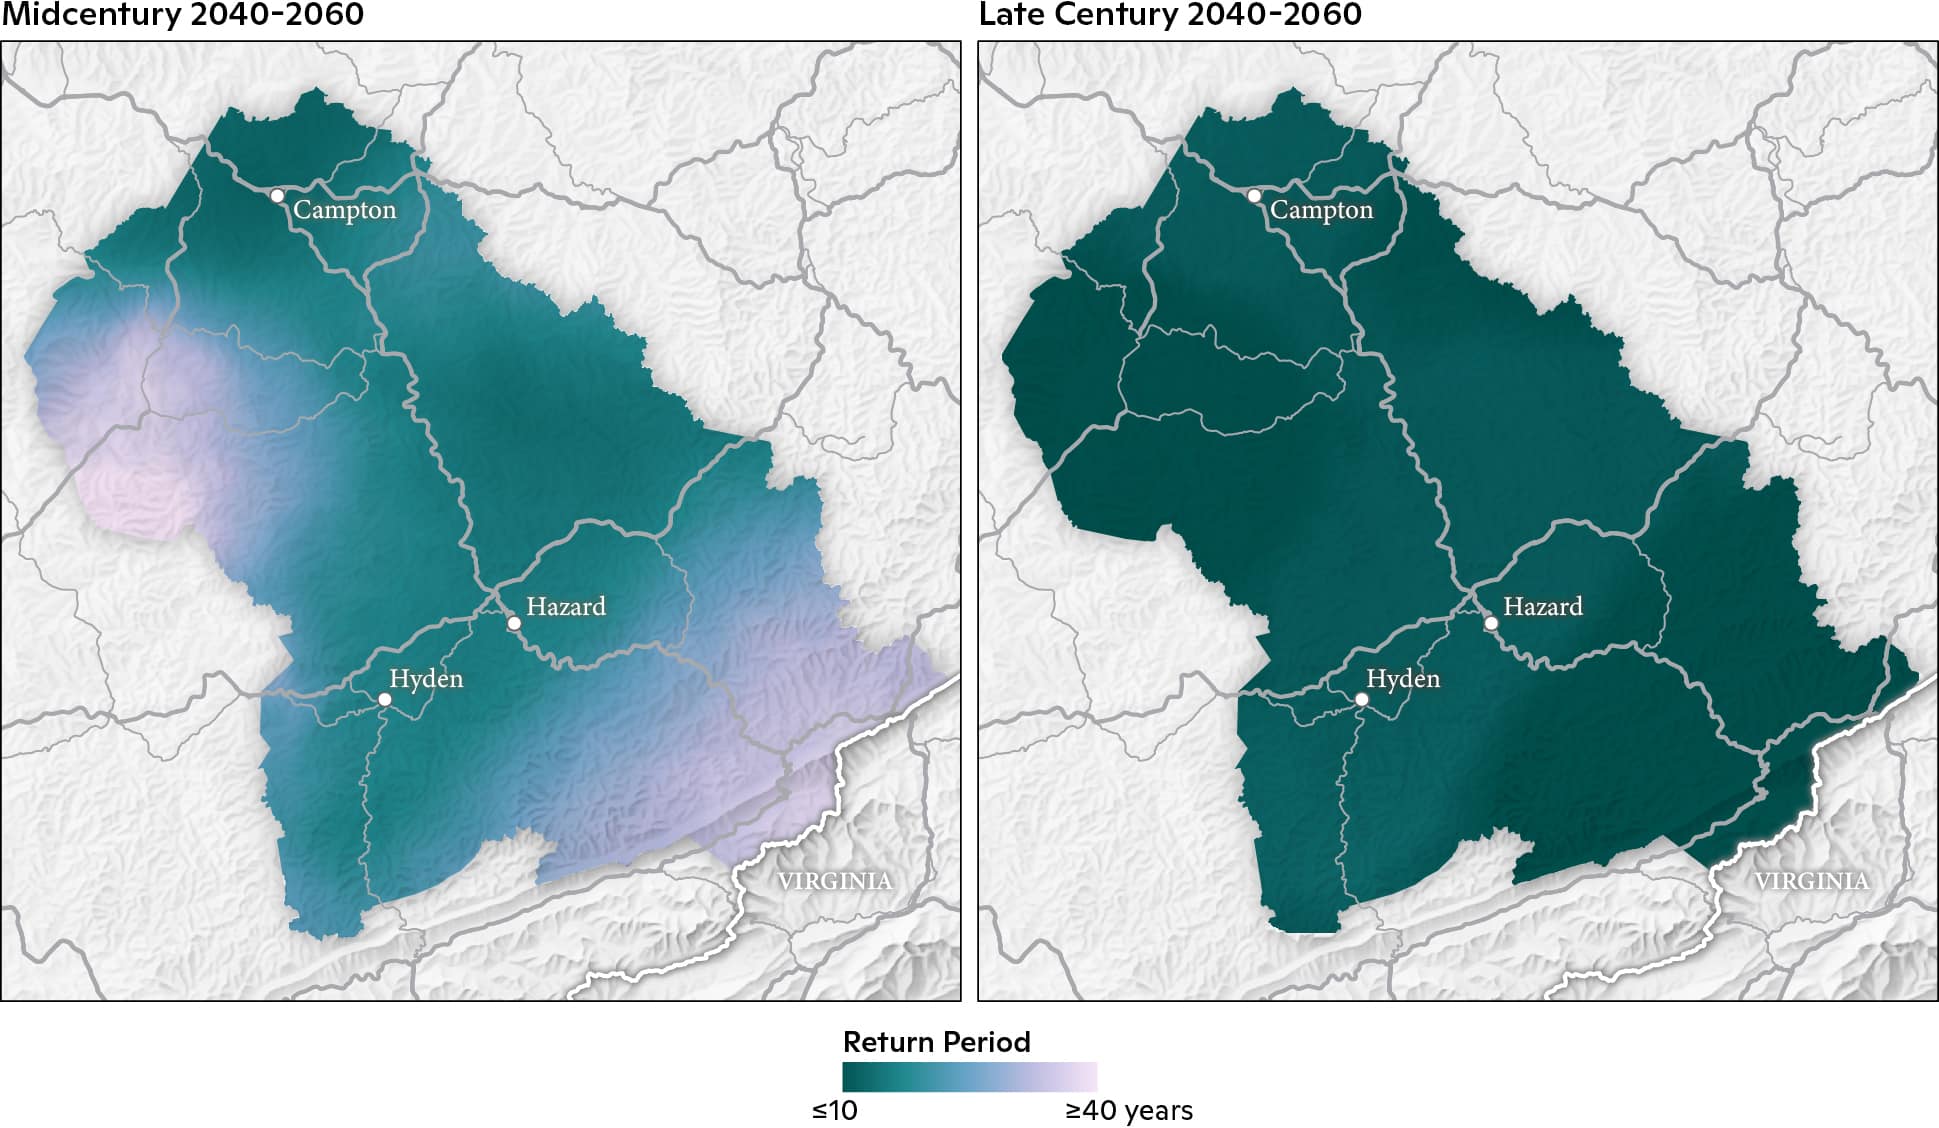
The Fifth National Climate Assessment shows that the U.S. Southeast region has already seen a 37% increase in annual precipitation occurring from the heaviest 1% of events1. Future warming is expected to continue this trend of intensification, meaning more frequent and severe rainfall events. Here we use localized future precipitation data from a downscaled global climate model to calculate the change in probability of extreme rainfall events. A detailed explanation of the precipitation data processing can be found in the methodology section of this document. In Figure 1, we show the changes in the return period of the present-day (2000–2020) 100-year rainfall event for midcentury (2040–2060) and late century (2070–2090). By midcentury, the present-day 100-year event will occur with a return period of roughly 1-in-20 for all counties except for Owsley and Letcher which are closer to 1-in-50. By late century, the present-day 100-year event will become a roughly 1-in-10 year event for all counties except Owsley which is a 1-in-15 and Letcher which is closer to 1-in-20.
Figure 1: Mid- and late-21st century change in present-day 100-year return period. The future return period of the present 100-year rainfall events in midcentury (left) and late century (right) with the darker the hue, the smaller the return period (greater frequency of occurrence). By midcentury, the present-day 100-year rainfall event is expected to become between a 1-in-20 year event for all counties except Owsley and Letcher, which are closer to a 1-in-50 year event. By late century, the present-day 100-year rainfall event is expected to become a 1-in-10 year event everywhere except for Owsley County which is 1-in-15 year event and Letcher County which is close to 1-in-20 year event.
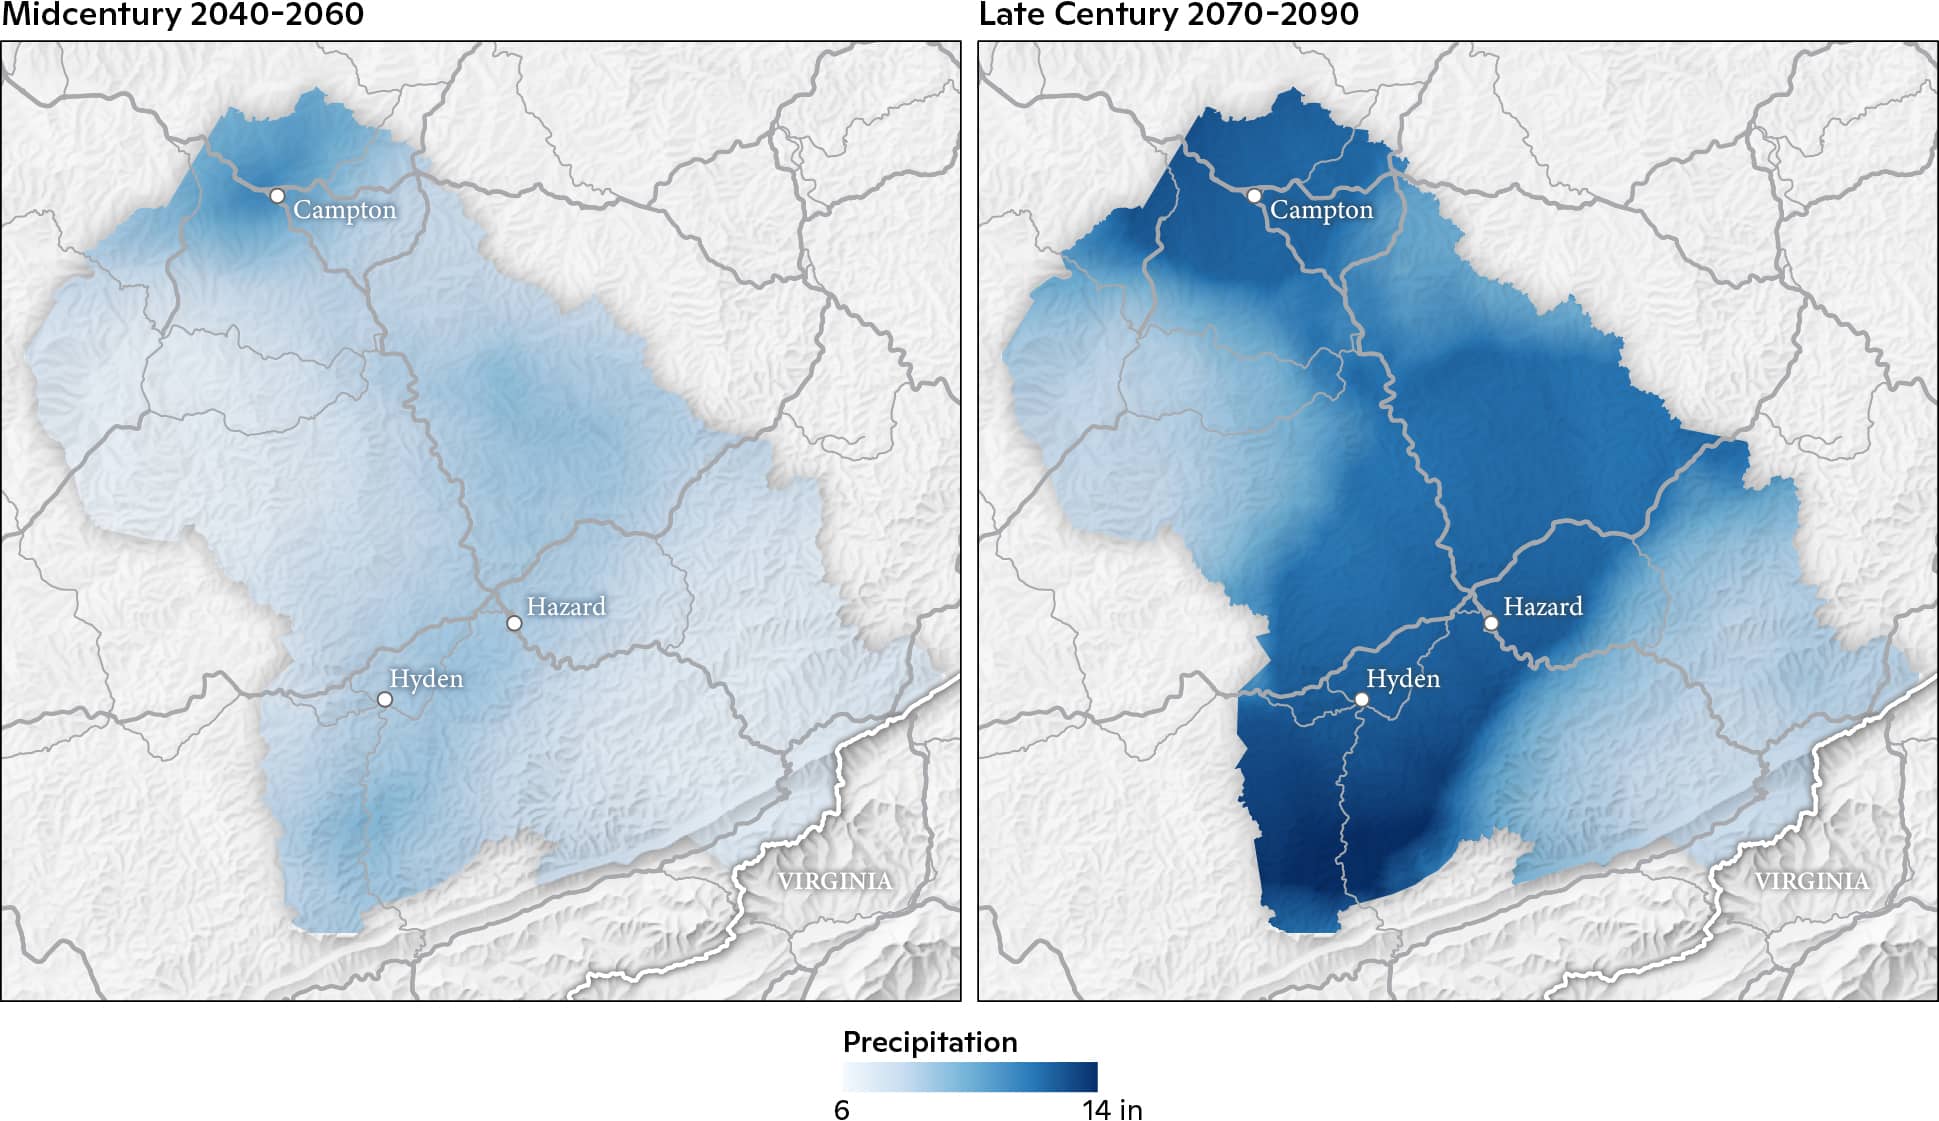
Figure 2: Mid- and late-21st century change in historical 100-year rainfall. The future rainfall amounts in inches for mid-century (left) and late-century (right) 100-year rainfall event with the darker the blue, the greater the rainfall amount. By midcentury and late century, the 100-year rainfall event is expected on average to drop 7.8 inches and 10.79 inches respectively across KRADD, see Table 1 for specific locations.
According to the National Atlas 14 published by the National Oceanic and Atmospheric Administration (NOAA), the 100-year rainfall amount, based on present-day rainfall records, for KRADD is between 5.42 inches (137.67 mm) and 6.48 inches (164.59 mm)2. For reference, the present-day annual average rainfall for Jackson, KY is 51.89 inches (1318.01 mm)3. By midcentury, the 100-year amount increases to between 6.25 inches (158.75 mm) and 11.34 inches (288.04 mm) and by late century this further rises to between 7.51 inches (190.75 mm) and 14.58 inches (370.33 mm; Figure 2). Table 1 shows the 100-year rainfall events for the eight county seats in KRADD and the average value across KRADD.
| Present | Midcentury | Late Century | |
| Hazard | 5.71 in (145.03 mm) | 8.45 in (214.63 mm) | 12.63 in (320.80 mm) |
| Jackson | 5.72 in (145.29 mm) | 8.26 in (209.80 mm) | 11.89 in (302.01 mm) |
| Beattyville | 5.8 in (147.32 mm) | 6.6 in (167.64 mm) | 8.42 in (213.87 mm) |
| Hyden | 5.74 in (145.80 mm) | 8.39 in (213.11 mm) | 12.62 in (320.55 mm) |
| Whitesburg | 5.58 in (141.73 mm) | 6.6 in (167.64 mm) | 7.6 in (193.04 mm) |
| Booneville | 5.76 in (146.30 mm) | 6.5 in (165.10 mm) | 8.24 in (209.30 mm) |
| Campton | 5.78 in (146.81 mm) | 10.89 in (276.61 mm) | 12.47 in (316.74 mm) |
| Hindman | 5.51 in (139.95 mm) | 7.63 in (193.80 mm) | 11.12 in (282.45 mm) |
| Area Average | 5.73 in (145.54 mm) | 7.8 in (198.12 mm) | 10.79 in (274.07 mm) |
Table 1: Mid- and late-21st century change in present-day 100-year rainfall. The rainfall amounts in inches and millimeters for the county seats in the eight counties of KRADD along with an area average of the present-day, mid-century, and late-century 100-year rainfall events.
Flooding
For a detailed explanation of the flood model input data and flood modeling procedures, please refer to the methodology section of this document.
Flood extent comparison
Before estimating future flood risk, we compare the present-day flood risk results against the Federal Emergency Management Agency (FEMA) flood maps as a validation exercise. FEMA maps are not ground truth data, but it is useful to compare various model results given the lack of appropriate reference data. Several patterns emerge when comparing the extents visually. The risk of rivers overflowing their banks, also known as fluvial or riverine flooding, estimated by Woodwell is greater than FEMA estimates, particularly along tributaries to the different segments of the Kentucky River. This is a result of FEMA simulations indirectly accounting for rainfall because they use stream gauges or hydrologic models. Finally, FEMA shows no flood risk in areas disconnected from rivers, while Woodwell demonstrates extensive non-riverine areas are vulnerable to flooding. This is because FEMA does not account for direct rainfall across the entire domain, also known as pluvial flooding. Finally, comparing the flood extents in some counties is challenging, because the FEMA analyses used to generate the flood zones are out-of-date or they don’t contain any in-depth studies. While the effective year of the FEMA Flood Insurance Study for Lee County is 2022, the riverine modeling for the Kentucky River and its tributaries in Beattyville was completed in 19764. Breathitt County was also completed in 2022; however, the riverine modeling for Panbowl Lake was done in 1991 and the North Fork Kentucky River in the city of Jackson was completed in 19905. The counties of Owsley and Wolfe have no flood zones where studies were completed.
Present and future flood risk
The primary flood risk in KRADD is riverine flooding. Major riverine flooding is associated with the North Fork Kentucky River, the South Fork Kentucky River, and the Middle Fork Kentucky River. In Figure 3, we show the depth of the 100-year flood for select locations around KRADD. In Hazard, flooding along the North Fork Kentucky River is quite extensive. Several structures along the North Fork Kentucky river are inundated during a present-day 100-year flood, particularly along Main Street (roughly 9.8–13.1 feet; 3–4 meters), and approximately 20 homes between Kentucky Boulevard and Parkway Street (about 9.8 feet; 3 meters). Campton also has flooding along Swift Camp Creek that goes through downtown. Approximately 1.64 feet (0.5m) to 3.28 feet (1m) of flooding occurs along Main Street and near Washington Street. Lastly, Hyden shows extensive flooding from the Middle Fork Kentucky River and Rockhouse Creek. This causes flooding along Main Street/ US HWY 421 which inundates several locations such as Hyden City Park (36.1 feet; 11 meters), Kentucky School of Bluegrass and Traditional Music (11.5 feet; 3.5 meters), and flood waters approaching Mary Breckinridge ARH Hospital on the west side (6.2 feet; 1.9 meters). We mask wetland areas to focus the analysis on locations where human life and property are at risk.
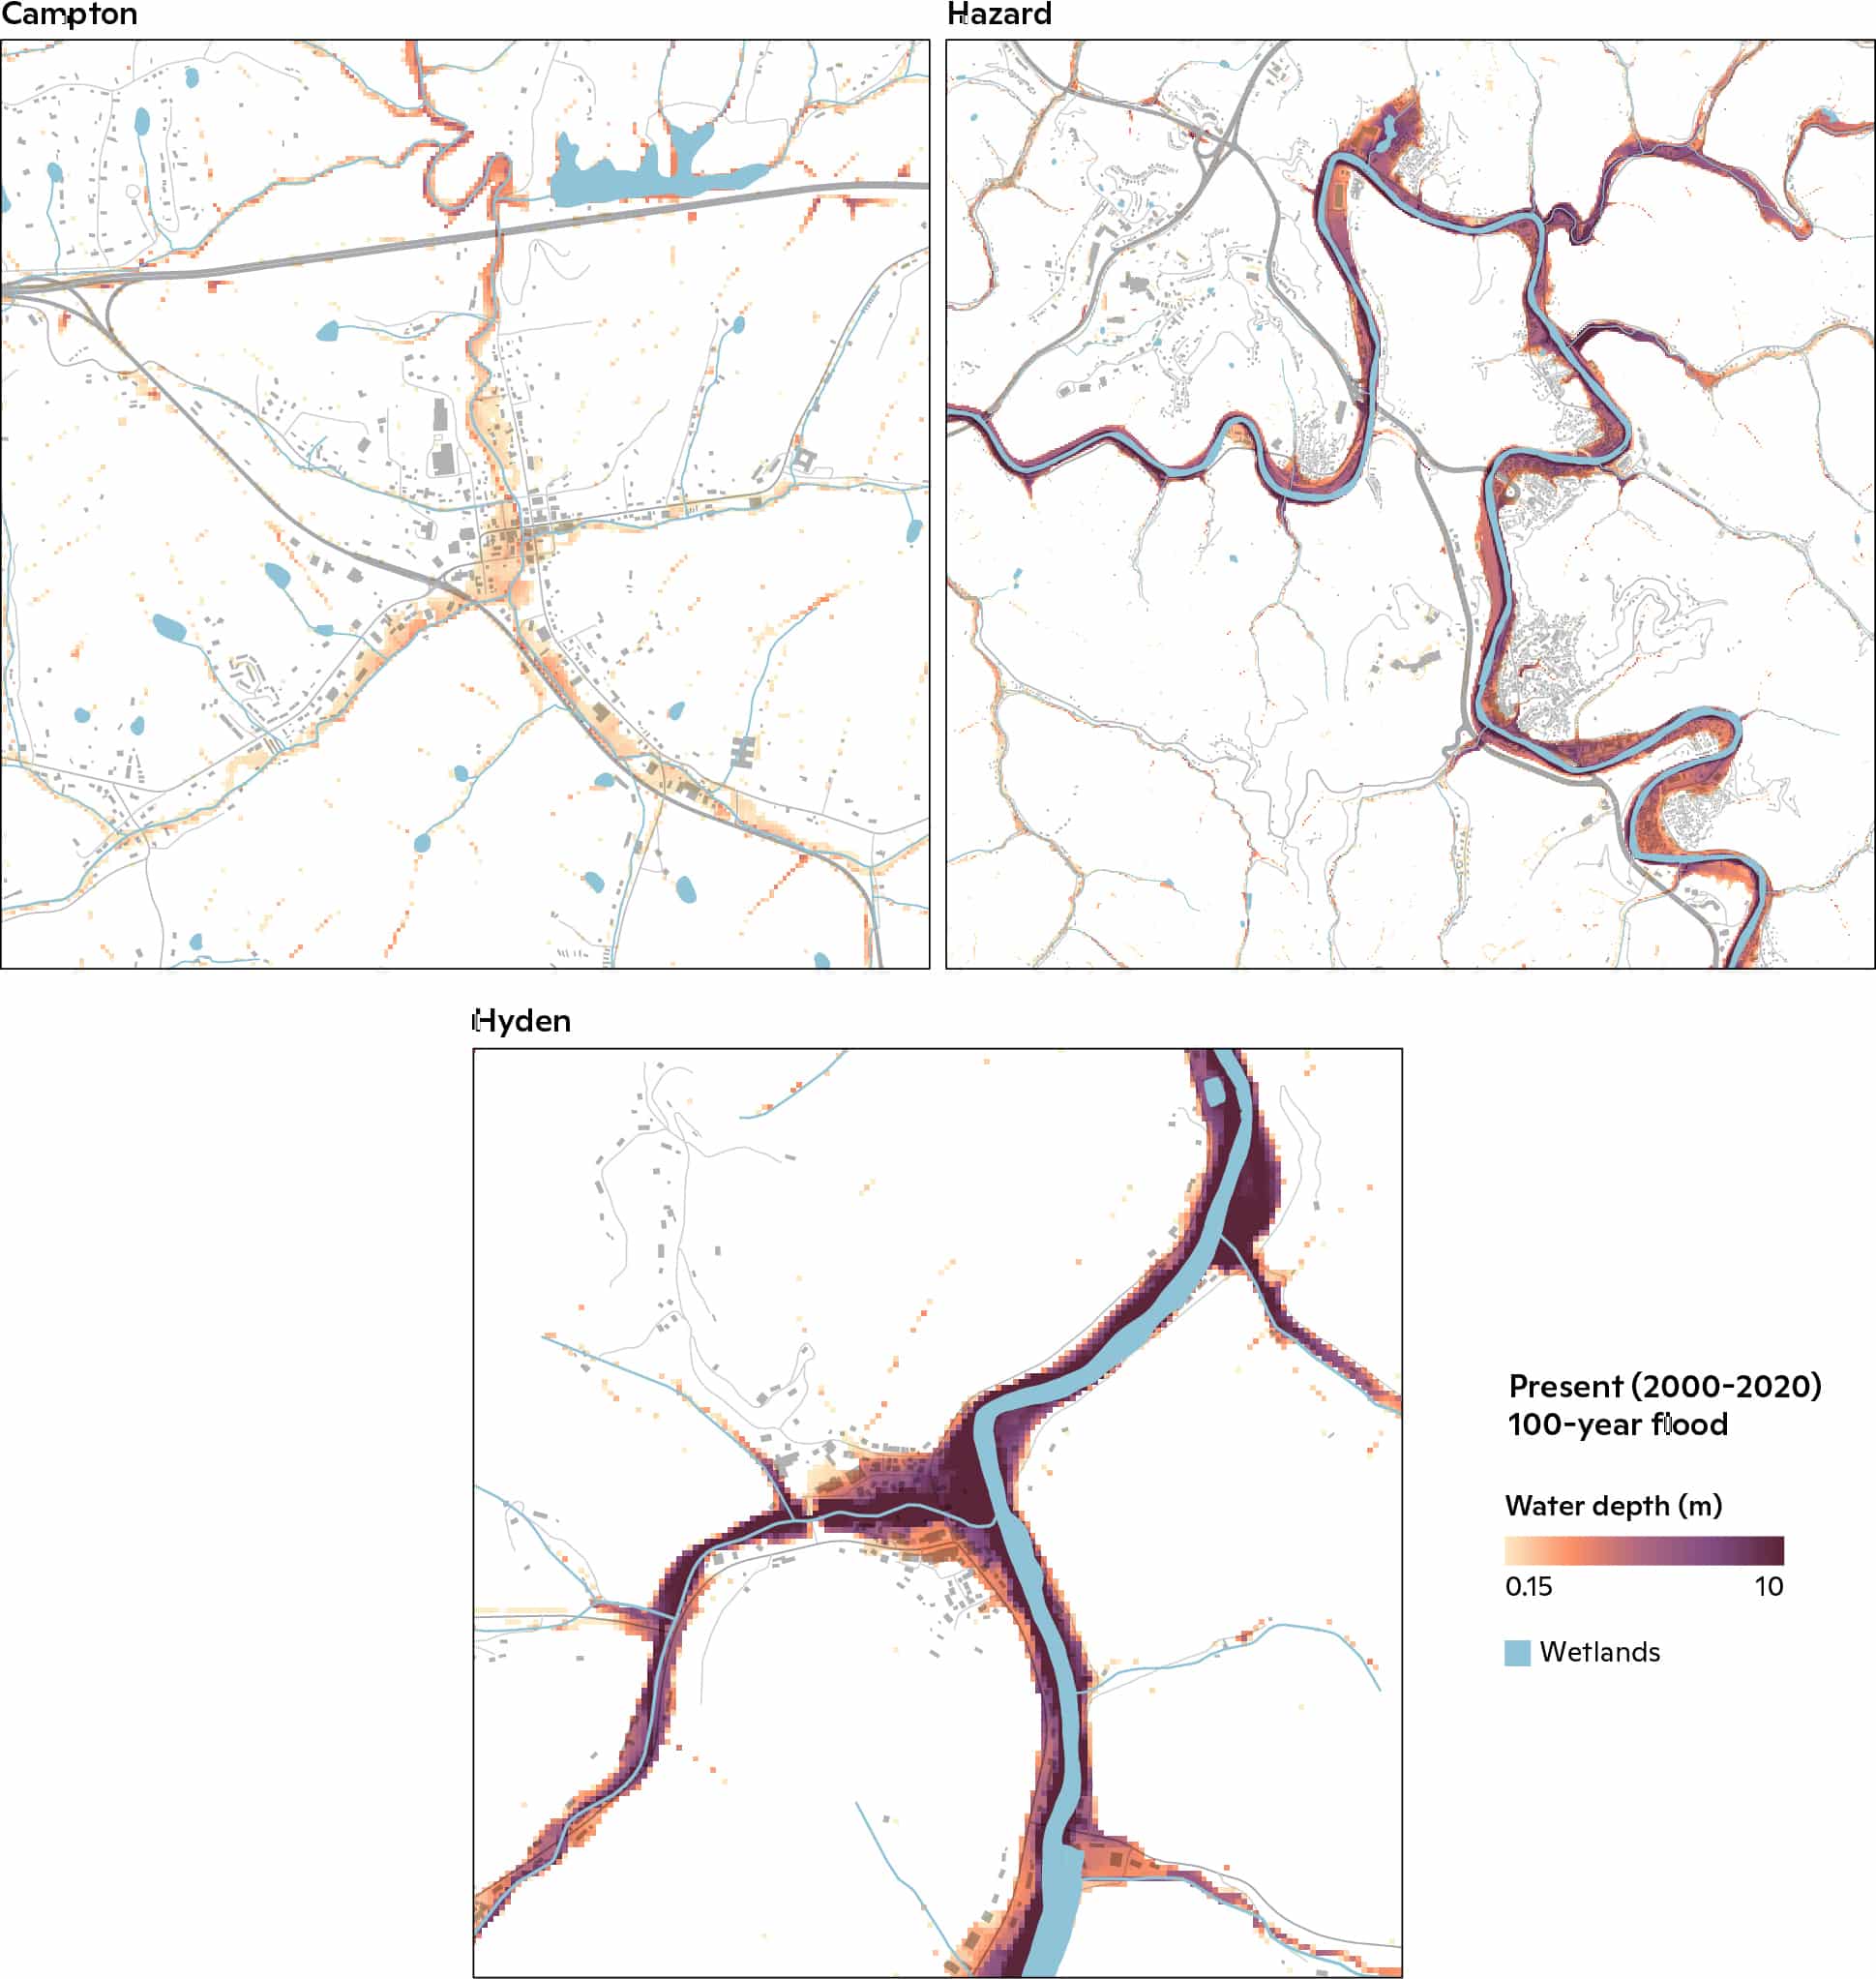
Figure 3: Present-day 100-year flood. The flood depth for select cities (Campton, Hazard, and Hyden) around KRADD. The maximum depth from the 100-year pluvial/riverine flood is shown. Darker hues indicate deeper flood waters. Gray polygons are buildings.
Future flood risk is most notably seen along various branches of the Kentucky River. We focus on Hazard, Campton, and Hyden where flood depth and extent expand throughout midcentury and late century (Figure 4). Most notably the Mary Breckinridge ARH Hospital in Hyden is inundated with 16.4 feet (5 meters) by late century. This change in riverine and pluvial flood risk is due to projected increases in rainfall on average between 2 and 5 inches (50.8 to 127 mm), as shown in Table 1. We also present several flood risk metrics in Table 2. Presently, just over 31% of the structures in KRADD are vulnerable to the 100-year flood. That number increases to about 36% by midcentury and then 40% by late century. The average flood depth in KRADD increases by 2.33 ft (0.71 meters) through the 21st century while the area flooded increases from 5.1% in the present day to 6.1% by late century.
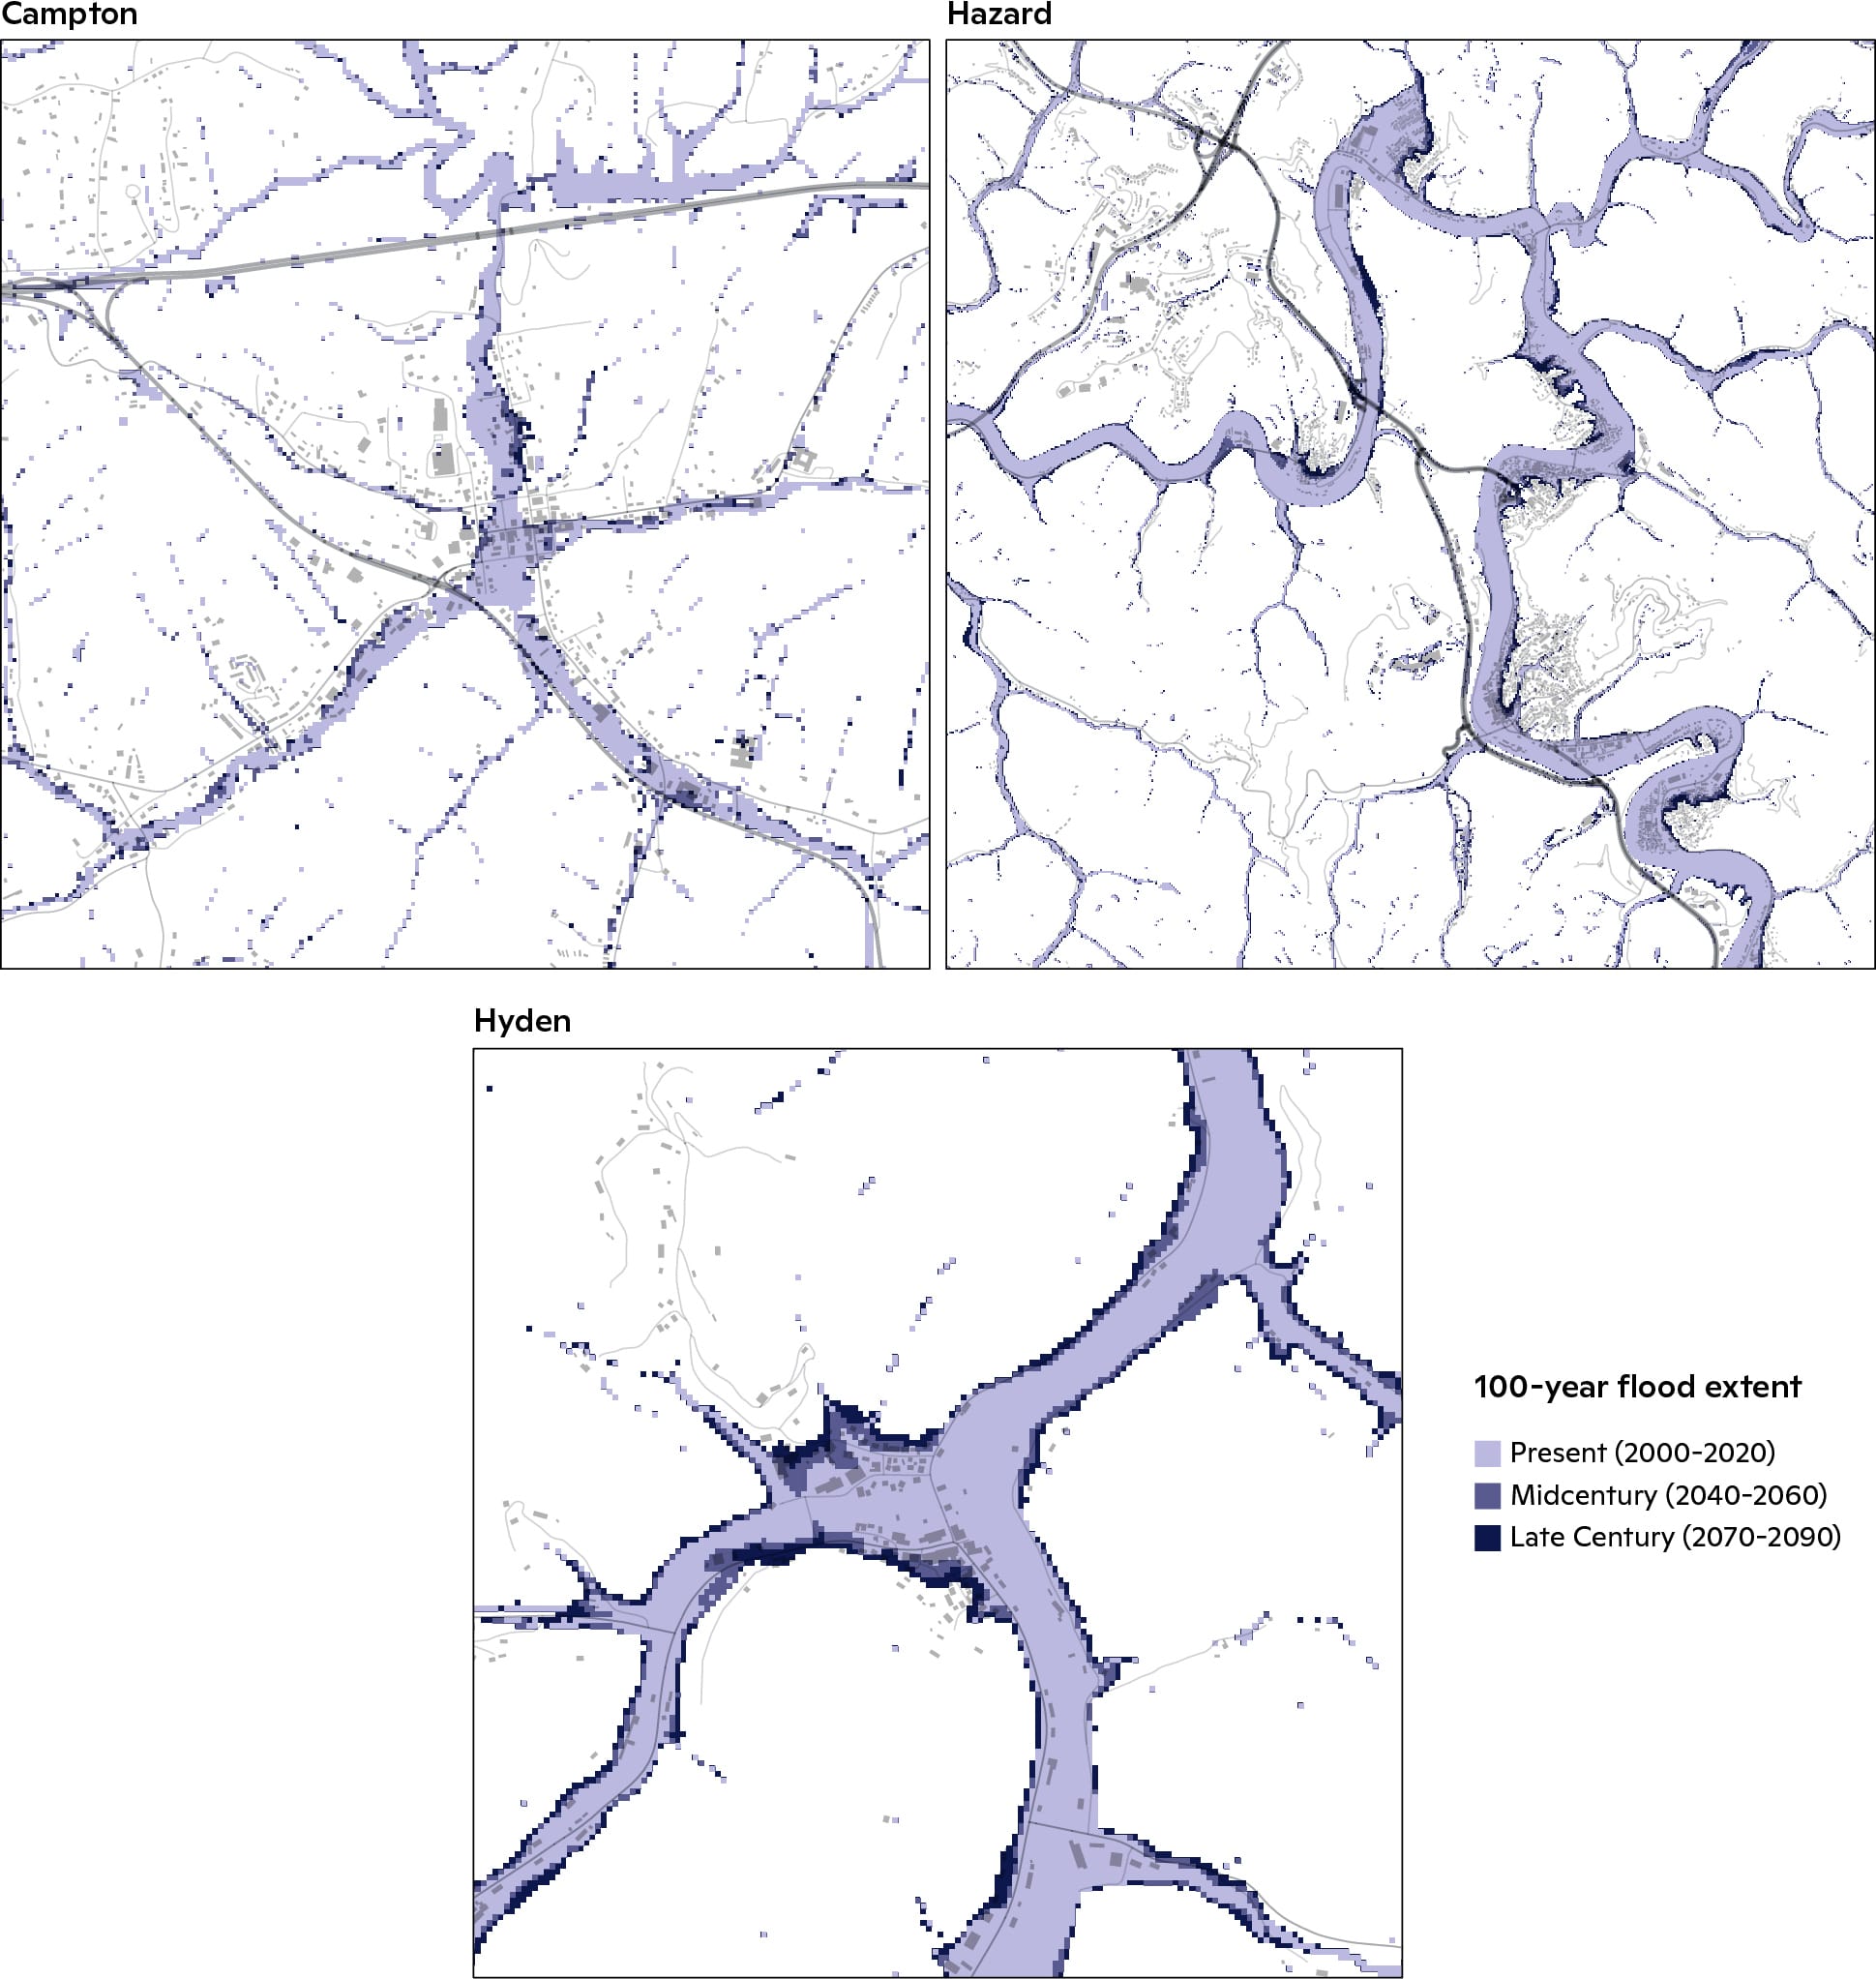
Figure 4: Present-day and future 100-year flood. The flood extent, quantified as having a depth of at least 0.5 ft (0.15 m), for select cities (Campton, Hazard, and Hyden) around KRADD. The maximum extent for the 100-year pluvial/riverine is shown. Gray polygons are buildings.
| Present | Midcentury | Late Century | |
| Area Flooded | 5.1% | 5.5% | 6.1% |
| Average Depth | 6.20 ft (1.89 m) | 7.02 ft (2.14 m) | 8.53 ft (2.6 m) |
| Structures Flooded | 21,070 (31.7%) | 23,831 (35.8%) | 26,568 (40%) |
Table 2: Flood risk metrics for mid- and late-21st century in KRADD. The percent of land area (excluding wetlands) flooded and the number of buildings (and percent of total structures) flooded for KRADD of the present-day, mid-century, and late-century 100-year rainfall events.
Conclusion
KRADD is currently at high risk from flooding, and this exposure will only increase under climate change. The results presented in this study were compared to FEMA’s flood maps, revealing significant discrepancies primarily due to the exclusion of pluvial flooding in FEMA’s analysis and dated studies. The results of this research indicate an expected increase in the frequency and intensity of heavy rainfall with the probability of the present-day 100-year rainfall event to be five times higher by midcentury and ten times higher by late century for most counties. This report provides insight into the vulnerability of KRADD, where an increasing number of buildings and areas will be exposed to flood waters by late century.