In a new study released this week in Nature Communications Earth & Environment, researchers assess the impact of a warming Arctic on global carbon emissions and find that carbon emissions from abrupt permafrost thaw and wildfire will substantially limit our ability to keep global temperature increase below 1.5° or 2° Celsius. When accounting for carbon emissions from abrupt permafrost thaw and intensifying wildfire regimes, the remaining carbon budgets to keep global temperatures below 1.5°C were reduced by about one quarter and by nearly one fifth for 2°C.
Abrupt thaw mainly occurs in ice-rich permafrost landscapes, where rapid thawing can cause the ground to collapse. This exposes deep carbon-rich soils to warmer temperatures, allowing large amounts of previously frozen carbon to be released over a short period of time and amplifying climate warming. At the same time, intensifying wildfires are emitting carbon to the atmosphere at the time of burning and further accelerating permafrost thaw by removing the insulating organic layer at the soil surface.
While existing research has recently led to the critical inclusion of projected carbon emissions from gradual permafrost thawing in global carbon budgets, the impact of abrupt thaw processes and wildfires are both largely missing from Earth System Models, hindering our ability to set sufficiently ambitious and accurate mitigation solutions. The study, which was led by Permafrost Pathways researchers at the Woodwell Climate Research Center and co-authored with the University of Colorado, Boulder and the International Institute for Applied Systems Analysis (IIASA) in Austria, calculates that these total permafrost thaw and wildfire carbon emissions could reach 63 Pg C for every degree Celsius of further global temperature increase. This is over double what is currently included in the Intergovernmental Panel on Climate Change (IPCC) projects. To put it another way, by the end of this century, these projected annual permafrost emissions could reach or exceed the current total annual emissions of a high-emitting nation such as the United States.
“Accurately accounting for land-based emissions directly affects whether remaining carbon budgets, as established by the Paris Agreement, are effective in restricting the planet’s temperature increase to below the 1.5°C and 2°C thresholds,” said Dr. Christina Schädel, lead author of the paper and Senior Research Scientist at Woodwell Climate Research Center. “As the Arctic continues to warm more rapidly than anywhere else on the planet, we must continue to research and support science-based solutions in the Arctic in order to mitigate the impacts of climate change on communities across the globe.”
“Estimates of remaining carbon budgets will continue to underestimate emissions unless the impacts of permafrost thaw and wildfire are fully included,” said Dr. Susan Natali, Senior Scientist and lead of Permafrost Pathways at Woodwell Climate Research Center. “Given the urgency of the climate crisis, and our rapidly shrinking window to limit its impacts and to respond to accelerating climate hazards, the global community must move quickly towards fully informed climate policy and accurate temperature goals.”
This study was funded by One Earth Philanthropy, the Gordon and Betty Moore Foundation, the Quadrature Climate Fund, and with funding catalyzed through the Audacious Project. The full study can be found here.
Every five years, all 195 signatories of the 2015 Paris Agreement must submit updated plans to reduce their greenhouse gas emissions to limit global warming. These plans, known as Nationally Determined Contributions (NDCs), are key components of the agreement and represent countries’ highest ambitions for emissions reductions over the next decade.
“The NDC is a pledge,” Director of International Government Relations at Woodwell Climate Dr. Matti Goldberg says. “It’s a pledge by a government to reduce their emissions by a certain amount, by a certain time frame. It can also be a pledge of taking certain types of actions. Each NDC also contains plans and measures to put it into action.”
This year, countries must submit their third NDC ahead of COP30 in Belém, Brazil.
How do NDCs fit into the Paris Agreement?
The Paris Agreement is a legally-binding international treaty under the UNFCCC. The treaty states that signatories should work together to limit global temperature increase to “well under 2°C” above pre-industrial levels and pursue efforts to keep the increase below 1.5°C. Nationally Determined Contributions outline how countries plan to achieve this goal and take other measures as part of the global climate effort.
Each NDC must build upon a country’s previous submission and reflect the party’s “highest possible ambition,” according to the Paris Agreement. While parties are legally required to submit an NDC and pursue actions to reach the target, they are “not legally bound to reach the target,” Goldberg says. “It’s a gigantic loophole in a way…although such flexibility is obviously necessary for countries to agree to this, and it does create a structure of pressure.”
After NDCs are submitted, the UNFCCC assesses the combined impact of countries’ NDCs on projected global emissions in a synthesis report. Parties in the Paris agreement also submit a Biennial Transparency Report (BTR) every two years, which outlines each country’s progress made towards accomplishing their NDCs.
“It’s the country’s own assessment,” Goldberg says. “But if a country announces a metric, then others can, of course, also look at whether that metric is being followed. This information creates the basis for civil society and other governments to put pressure on those governments.” Further transparency is created by a process where international experts review each country’s biennial reports.
Despite the ambitious intent of NDCs, Executive Secretary of the United Nations Framework Convention on Climate Change (UNFCCC) Simon Stiell determined last November that previous pledges fell “miles short of what’s needed to stop global heating from crippling every economy and wrecking billions of lives and livelihoods across every country.”
What is in the 2025 NDCs?
NDCs were initially due in February 2025, but with only 13 Parties submitting on time, the UNFCCC Secretariat announced a cut-off date in September to have enough time to prepare its synthesis before the start of COP30 in November. China, the United States, India, the European Union, Russia and Brazil were the world’s top emitters in 2023. Together, these six parties accounted for 62.7% of all global emissions. Of the top greenhouse gas emitters, only the U.S. and Brazil sent in their NDCs as of early September 2025.
The United States submitted its NDC in 2024 under the Biden Administration and set a target of reducing its net greenhouse gas emissions by 61 to 66% below 2005 levels in 2035. After taking office, President Trump issued an executive order announcing the U.S.’s intent to withdraw from the Paris Agreement, which will go into effect in 2026. After January 2026, the U.S. will no longer be required to submit new NDCs or Biennial Transparency Reports.
Despite the country’s withdrawal, Goldberg says the U.S. may see a reduction in greenhouse gas emissions because of its continuing transition from coal to natural gas, renewables and nuclear power — which, according to Goldberg, is driven more by economics and less by policy. Still, Dr. Christopher Schwalm, Vice President of Science at Woodwell Climate, predicts there is “no way” the United States will hit the targets set out in the NDC given the current global political climate. Even if the U.S. does reach its goals, the NDC still does not align with the global 1.5°C limit, according to the Climate Action Tracker. Schwalm calls the 1.5°C target “dead as a doornail.” To reach this goal, we would have needed global greenhouse gas emissions to peak by 2025.
Brazil’s most recent NDC states a goal of reducing greenhouse gas emissions 59% to 67% compared to its 2005 emissions. Goldberg calls it a “pretty ambitious” absolute target for a country classified as a developing country under the UNFCCC. However, the Brazilian climate organization Observatório do Clima states the NDC goals do not align with the global 1.5°C limit.
How could reaching targets in NDCs impact warming trajectories?
Woodwell Climate research scientist Dr. Abigail Lute wanted to see how much of a difference just two of the top-emitting countries’ NDCs could make.
“Are we moving the needle here or not?” she says. “How much are we moving the needle? Are we moving it enough to avoid 2°C? That’s the big picture, to see how ambitious these new pledges are.”
Lute modeled how both the U.S. and Brazil’s promises together could change the global warming trajectory using a “middle-of-the-road” scenario for future greenhouse gas emissions — though, at the moment, that scenario might be more optimistic than our current trajectory, she says.
For the first ten to 20 years after implementing the NDCs, temperatures will temporarily increase. This is due to the reduction in polluting gases such as sulfates that actually have a cooling effect in the atmosphere. After about a decade or two, the reduction in warming gases such as methane and carbon dioxide will cause temperatures to fall.
According to Lute’s calculations, under moderate emissions scenarios, the probability of exceeding 2°C is 25% by 2050 and 78% by 2100. If both the U.S. and Brazil reach their NDC targets, the probability of exceeding 2°C stays about the same for 2050 but drops down to 73% for 2100.
Global warming is expected to reach 1.8°C by 2050 and 2.3°C by 2100 under the medium emissions scenario. With the U.S. and Brazil’s combined NDCs, Lute expects warming to be reduced by about 0.01°C in 2050 and 0.06°C by 2100.
While these contributions may seem small, Brazil and the U.S. only represent two of the 195 parties in the Paris Agreement.
“It’s two of the larger ones for sure, but it’s only two,” Lute says. “If we extrapolate it to everybody, then it can make a meaningful difference…the story here is that everybody needs to contribute. This is a collective problem, and even one large country can’t solve it.”
From the Amazon to the Congo Basin, the largest remainder of tropical forest lies in Brazil and the Democratic Republic of Congo – taking up nearly 4 million square miles of land. As epicenters of biodiversity and carbon storage, these forests serve as the stabilizers of our climate. Yet many tropical forests around the world are disappearing as climate change and human activity drive deforestation every year.
Despite covering only 6% of the planet, tropical forests play a critical role in climate control. They prevent atmospheric warming by storing carbon, dispersing heat, releasing cooling water into the air, and helping to create clouds. They also help regulate air quality, soil health, and the water cycle. Keeping them standing is one of our best natural climate solutions.
At the 2021 United Nations Climate Change Conference (COP26), over 100 world leaders pledged to halt and reverse forest loss and land degradation by 2030, but deforestation has continued year over year. Under our current economic system, forests are often more valuable cut and cleared than left standing.
But this year, a new solution has appeared on the horizon: a fund to incentivize tropical forest conservation.
The tropical deforestation crisis
In 2024, the tropics lost 6.7 million hectares of primary forest – old forest that has been relatively undisturbed by humans – at a rate of 18 soccer fields per minute. It was a record-breaking year for primary forest loss and the fastest rate of primary forest deforestation on record, with much of the increase driven by wildfire.
Bolivia and the Democratic Republic of the Congo saw some of the highest levels of primary forest loss on record. But Brazil, the world’s largest tropical forest nation and home to over half of the Amazon rainforest, took the biggest hit. Over 40% of all tropical primary forest loss in 2024 occurred in Brazil.
The main forces behind forest loss worldwide are all human activities: agricultural expansion, mining, logging, and infrastructure development. Dr. Ludmila Rattis, Assistant Scientist and General Coordinator of Woodwell’s Tanguro Field Station, works on the Brazilian agricultural frontier to understand the impacts of agricultural intensification.
“Today, the number one driver of deforestation in the Amazon and Cerrado is land grabbing,” Rattis says.
Land grabbing refers to the control and clearing of large plots of land by a person or entity without clear rights to do so. In Brazil, land grabbing has been common since colonial times, when legislation restricted access to land. Today, nearly 50 million hectares of public forest in the Brazilian Amazon remains “undesignated” – meaning the land has not been formally designated by the government for a specific purpose – which leaves it highly vulnerable to grabbing.
Brazil is a major producer of agricultural commodities including beef, soybeans, and coffee. Because the country has a large amount of undesignated land with unclear regulations, land grabbing for agricultural production is profitable – and cleared forests are more financially valuable than standing ones. Brazilian law also allows the legal deforestation of some trees on private property, as long as 80% of forests on the property remain standing.
In late 2023, the Brazilian government proposed the Tropical Forest Forever Facility (TFFF) as a new financial solution that would pay tropical countries to keep their forests standing. Designed to generate and distribute $4 billion each year, it would complement other sources of finance by focusing incentives on forest conservation.
How does the TFFF work?
The TFFF is a global investment fund that proposes to use finance and investment strategies to generate annual payments to tropical forest countries that conserve and restore their forests. First introduced at COP28, the fund would provide tropical forest nations with large-scale, predictable payments based on how much forest cover they maintain.
The fund will raise money from both the public and private sectors, starting with $125 billion – $25 billion from government sponsors in long-term loans and guarantees and $100 billion from long-term, low-interest bond sales to private sector investors. The money raised will be invested into bonds with a high rate of return to generate revenue. Part of the revenue will be used to pay down interest on loans from bond-holders and government sponsors, with the remaining earnings being allocated to fund annual payments to tropical forest nations.
Frances Seymour, Senior Policy Advisor at Woodwell, is working on forest finance priorities leading up to COP30 this year.
“The innovative feature is the use of public capital to reduce the risk of non-repayment to private investors,” Seymour says.
The return generated by the fund would be paid out to eligible tropical forest countries at an initial rate of $4 per hectare of forest. It would be distributed to eligible governments with a deduction applied for every hectare deforested or degraded.
In order to be eligible for the fund, a country must be a developing nation with tropical or subtropical broadleaf moist forests – forests characterized by year-round warmth, high levels of precipitation, and trees with broad, flat leaves. Additionally, the deforestation rate during the year the country adheres to the TFFF must be lower than the previous year.
To track deforestation rates, participating nations would need to use remote sensing technologies such as satellite imagery. For example, Brazil’s National Institute for Space Research (INPE) monitors tree cover loss using satellite-based systems. Countries that do not have the ability to monitor their own forests would be allowed to use approved third-party methods and data.
How many trees make a forest?
Areas eligible for forest payments must also have more than 20% canopy cover, which refers to the percentage of the upper layer of trees in a forest that obscures light passing through. But some people argue that the proposed threshold isn’t high enough.
Scientists at Woodwell Climate, including Associate Scientist Glenn Bush and Research Assistant Patrick Fedor, are pushing for higher canopy cover thresholds for the fund.
“The problem is that most of us who work in tropical forests and know them well would say that a patch of land which only has 20% of forest cover isn’t a forest anymore – it’s a field,” Bush says.
A landscape with a few large trees scattered around may have canopies that register at 20% cover despite no longer functioning as a forest. Scientists recommend increasing the canopy cover threshold to 60% or even 80% to focus on high-value intact tropical forest areas and prevent cleared areas from qualifying for TFFF benefits.
In a memo to TFFF Secretariat Andre Aquino, Bush and Fedor assessed management costs and social benefits of conserving tropical forests in Brazil and the DRC. They found that with raised canopy thresholds and adjusted payments, the TFFF could help protect more biodiverse and climate resilient forests without increasing the fund’s total budget. The counter argument, however, is that any forests below the increased threshold may face a higher risk of being permanently converted to another use rather than restored if not included in the scheme.
“The biggest thing is to increase canopy cover because we want resilient forests,” Fedor says. “We’re trying to keep forests fully intact.”
COP30 and the future of tropical forests
While the specifics of the fund aren’t fully agreed upon, the general consensus is that the global effort would make a significant positive change for tropical forest nations. By providing a source of predictable budget support for forest conservation and management, tropical forest nations could bring environmental goals to the forefront of government policy and action.
“This is a really long-term commitment to what could be potentially transformational change,” Bush says.
If successful, the model has the potential to apply to other efforts beyond forest conservation. The TFFF model, Seymour says, could be replicated to finance efforts such as girls’ education or eradicating malaria, two areas that are facing pressures from recent reductions in development aid from wealthy countries.
The proposed TFFF model also puts an emphasis on Indigenous communities and their contribution to forest conservation by requiring a minimum of 20% of annual payments to each country – a global amount totalling at least $800 million annually – to be allocated to Indigenous and local forest communities.
“The focus on Indigenous Peoples and reinforcing land rights is really critical,” Bush says. “That’s the first time a fund of this sort has actually involved Indigenous Peoples groups in its design in such an early stage.”
Research has shown that Indigenous communities are the key to protecting tropical forests. Managing over half of the world’s remaining intact forests, Indigenous tropical forest communities experience more carbon capture, less carbon loss, and less tree cover loss than other lands. When Indigenous land rights are enforced, forests thrive.
“It’s an innovative policy that’s hopefully going to promote good change and good environmental outcomes,” Fedor says. “It changes the economics of a forest’s value.”
During New York Climate Week in September, Brazilian President Luiz Inácio Lula da Silva announced that Brazil itself would invest $1 billion in sponsor capital, challenging other governments to do their part as well. The Brazilian government plans to formally launch TFFF at COP30 in Belém, Brazil in November. With the world’s biggest climate event hosted in the world’s biggest tropical forest nation, tropical forests will feature heavily on the international agenda. Roughly 45,000 policymakers, government negotiators, scientists, activists, and Indigenous leaders will be descending on the city at the mouth of the Amazon, placing a major spotlight on one of the very regions the TFFF is designed to protect.
“If there were ever a moment when a big idea like this could get the political and financial support that it needs to get off the ground,” Seymour says, “this is it.”
As the Arctic heats up three to four times faster than the rest of Earth, hotter temperatures have super-charged northern fires, causing them to burn more area, more frequently, and more intensely.
These fires have a range of harmful impacts on communities, ecosystems, and wildlife in the north. When it comes to carbon, they represent a unique now-and-future threat to global climate. That’s because much of the boreal forest, which circles the high northern latitudes, is underlain by carbon-rich frozen ground called permafrost. Stocked with carbon from dead animal and plant matter that’s accumulated over hundreds to thousands of years, permafrost functions as Earth’s “deep freezer,” keeping the planet cool by keeping carbon out of the atmosphere.
When permafrost thaws, microbes begin to access and break down the once-frozen carbon, releasing it to the atmosphere where it contributes to warming. Wildfires accelerate this process by burning off the organic soil layer that protects permafrost— opening the door on the freezer. And as temperatures in the north rise and boreal forests dry out and experience greater climate stress, the fires these forests evolved with have become more frequent and severe, with consequences for both permafrost and our climate.
Why are boreal forests important to climate?
The boreal forest, the largest forested biome on Earth, covers large stretches of North America, Europe, and Russia and stores 25% of the planet’s terrestrial carbon. Roughly 80% of this carbon is stored belowground in the form of soil organic matter and permafrost. So when the forest burns, the carbon released from the trees is just the tip of the iceberg. Eighty percent or more of carbon emissions from boreal fires in North America and in central Siberia come from belowground combustion of soil organic matter.
Boreal forests have been reliable safekeepers of this belowground carbon historically by providing an insulating soil organic layer that protects permafrost. But increasingly severe fires are changing that picture.
What happens to permafrost when the boreal burns?
Wildfires threaten this belowground carbon in boreal forests in multiple ways, both during and long after the fire itself.
As a fire burns, it combusts the carbon stored in trees and plants, releasing it into the atmosphere along with smoke and harmful pollutants. Intense fires also burn through duff and soil layers that carpet the forest floor.
Burning these insulating layers exposes the permafrost below to warmer temperatures for years after a fire. A recent synthesis study led by Postdoctoral Researcher Dr. Anna Talucci of Woodwell Climate found that in burned sites across the boreal and tundra regions, the depth of seasonally thawed ground increased for two decades after a fire.
That means that long after a fire is extinguished, permafrost is still thawing and releasing carbon in the form of carbon dioxide and methane. Where this ground is rich in ice, it can sink and collapse after a fire, causing ponding, erosion, and creating bogs and wetlands that release methane.
All of this carbon released to the atmosphere contributes to further warming, which in turn contributes to drying forests, hotter temperatures, and more lightning ignitions in the boreal forests. That’s because warming has boosted both lightning ignition efficiency, or the likelihood that lightning starts a fire, and the number of lightning strikes in the region.
Average yearly burned area across Alaska and Canada has roughly doubled since the 1960s. Emissions from Canada’s 2023 fire season exceeded total fossil fuel emissions from every other nation except the U.S., China, and India for that year. And the frequency of extreme wildfires across the circumpolar boreal region increased seven-fold from 2003 to 2023.
These trends, amplified by the permafrost-fire feedback, worsen both Arctic impacts and global emissions and could hamper our ability to meet agreed-on climate goals.
Gaps in boreal fire research
Wildfires in boreal forests are already weakening the region’s carbon storage capacity, signalling a crucial shift in the global climate system. Addressing critical gaps in our understanding of the fire-permafrost feedback will help prepare for such shifts and their local and global implications.
Research teams including Permafrost Pathways and collaborators are refining tools to predict what increasing fires mean for regional and global carbon emissions and climate targets. Such insights are needed to inform the Intergovernmental Panel on Climate Change’s (IPCC) inventory of global emissions, which does not yet include fire emissions or fire-caused permafrost thaw emissions. Efforts to better model and predict the complex interactions between permafrost and fire are also critical to informing adaptation and management responses.
The region’s vastness, as well as geopolitical conditions, presents challenges to collecting field data. Here, modeling can help scale the insights from what field data is available. And developing more accurate fire maps in Alaska and Siberia, where less burned area satellite data exists, could equip researchers and communities with better near-real-time information. Long-term monitoring efforts that study pre- and post-fire conditions, such as those led by Łı́ı́dlı̨ı̨ Kų́ę́ First Nation at the Scotty Creek Research Station, are providing critical insights about fire’s acute and long-term effects on permafrost.
What we can do: solutions that support resilience
The impacts from widespread severe northern wildfires transcend boundaries, affecting health and ways of life for communities living in the Arctic and around the globe.
But there are solutions at hand. Cultural burning, an important practice for many Arctic Indigenous communities, can help boreal forests build resilience by removing fuels with low-intensity seasonal fire. And collaborative management approaches that suppress fires in permafrost regions have been shown to be a cost-effective climate mitigation tool that has co-benefits for human health and the global climate.
But the most important solution to help keep the global wildfire-permafrost feedback loop in check is to reduce greenhouse gas emissions. Lowering overall emissions will slow rising temperatures in the north and give communities, boreal forests, and other ecosystems a better chance to recover and to adapt.
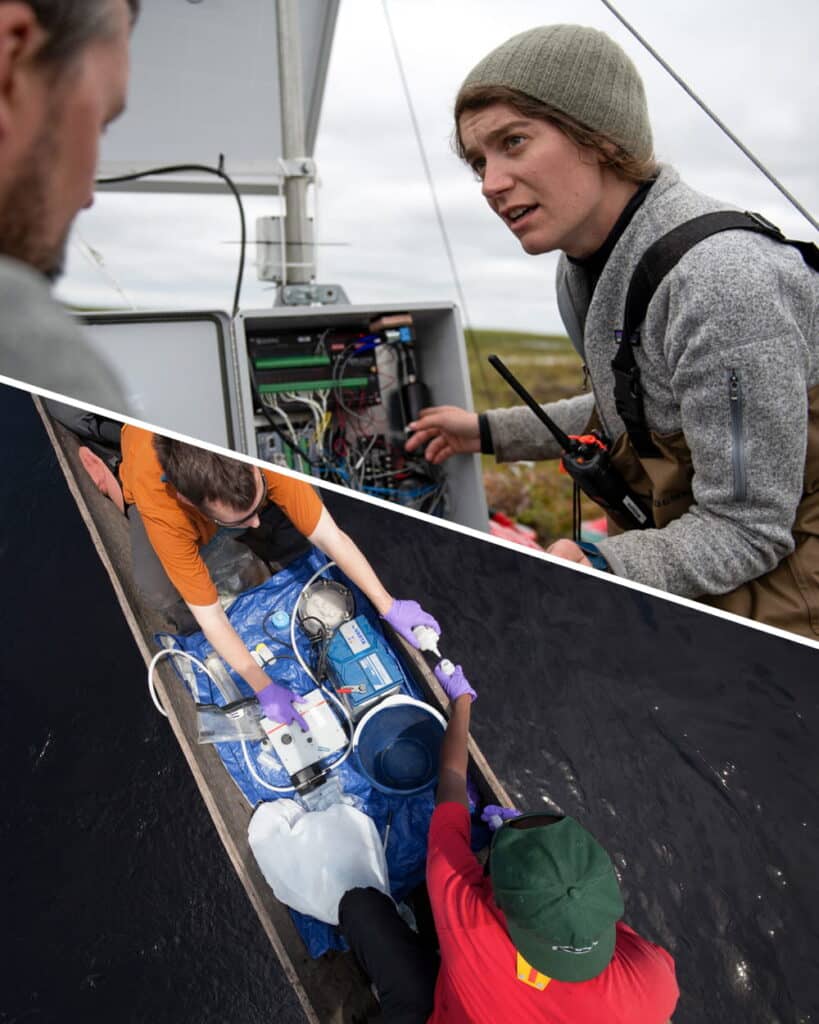
The MacGyver session at the annual American Geophysical Union (AGU) conference is full to the brim with scientists showing off blinking circuit boards and 3D-printed mechanisms. Research Assistant, Zoë Dietrich, stands in front of her poster and a plexiglass cube sprouting wires. As she speaks, a whizzing sound emanates from the box as it lifts itself up on one side, holding itself open long enough to flush the interior with air from the room. A laptop screen reads out numbers from the sensors in the box, detailing changes in the concentrations of carbon dioxide and methane within.
Dietrich constructed this device herself. It’s a low-cost, autonomous, solar-powered chamber designed to float on water and measure the flow of carbon into and out of the water. Dietrich has spent the past 1.5 years testing and troubleshooting various prototypes, and has already begun deploying models at research sites in Brazil and Alaska. Now she’s sharing her work with the broader scientific community in hopes of encouraging others to build their own versions.
“One of the goals of the chamber project is to make the construction very accessible so that scientists like me, without formal engineering training or background, can build the chambers pretty easily,” says Dietrich.
This was good news for Grand Valley University masters student, Jillian Greene, and her professor Dr. Sean Woznicki, who encountered Dietrich and her chambers at AGU. Though neither of them had experience with mechanical or electrical engineering, they knew immediately a device like Dietrich’s could be invaluable to their research.
Greene’s project involves sampling carbon emissions at drowned river mouth estuaries connected to Lake Michigan. She and Woznicki will then correlate that data with other ecological characteristics gleaned from satellite imagery. There are over one hundred of these freshwater estuary-like features around the region, and Greene and Woznicki are hoping to paint a complete picture of their cumulative role in carbon cycling.
“Originally, I was going to manually sample and quantify with a gas chromatograph,” Greene says. That’s a time-consuming process that limits the amount of data one team can collect. With the chambers, however, Greene can collect emissions data every 30 seconds—greatly expanding the amount of data she’ll be able to incorporate into her models.
“This is going to make our model a lot more robust and hopefully applicable to other drowned river mouth estuaries in the region,” says Greene.
Greene and her research team have already created and deployed 6 chambers. Since AGU, she has been in contact with Dietrich, troubleshooting issues as they arise and learning an entirely new set of skills as she goes.
“[the team] has learned how to solder, how to interpret the circuit diagrams, problem solve, and adjust for our kind of unique systems that we’re looking at,” says Woznicki. “It’s really been exciting to use Zoë’s design as a learning experience for masters and undergrad students.”
Dietrich has had other groups at Colgate University and the University of California, Berkeley reach out to her as well, and she is planning to publish a paper this fall that will include detailed instructions for anyone else to construct their own chambers. She’s already shared preliminary drafts of the step-by-step instructions, including photos, diagrams, and tips, as well as programming and data-processing code and a specific materials list with the other research groups. In turn, they have provided her with helpful revisions and ideas for new modifications. Dietrich is excited about the prospect of the designs being implemented by more people. More chambers means more data, which benefits the entire scientific community.
“Our sampling of carbon right now is limited by expensive instruments and where people can go and who has access to these resources,” says Dietrich. “But the goal of this project is to be low cost and more accessible to a broader set of researchers. The chambers are autonomous, and so are accessible to places and times that aren’t otherwise being sampled right now. And taking that a step further, we need to make them accessible to be built by anyone.”
“Why not float the aquatic greenhouse gas chamber on a surfboard?” Tropics Program Director Dr. Mike Coe suggested in one of our team meetings, and I could feel the gears in my brain begin turning. I started a sketch… If mounted on a surfboard, we would need a method to open the chamber, flushing it with outside air. Back in my office, I asked Google “what turns electrical energy into mechanical energy?” Google was quick to respond, “Motor.” Right, thank you, Google. Next, I typed, “motor that pushes something up.” Google replied, “linear actuator.” Three clicks later and I had ordered my first linear actuator for 35 bucks.
Three days later, that linear actuator sat expectantly on my desk. One red wire and one black wire, “12V DC” printed on its side. I turned back to Google, “How to wire a linear actuator?” Opening the first hit, I skimmed through the photos and diagrams. None of them striking my fancy, I moved on to the second hit: Step-by-step instructions, clear photos, even open-source code to program my Arduino microcontroller board – nice! Within an hour, my linear actuator was extending and retracting on command, ready to be mounted in an autonomous greenhouse gas chamber.
Adding the actuator to my sketch, I popped into Senior Research Scientist Kathleen Savage’s office to hear her thoughts. Savage always has new ideas brewing, and she suggested adding a feature that would allow the chamber to function on water and on land. The chambers are the product of a Fund for Climate Solutions (FCS) grant led by Savage to quantify carbon dioxide and methane emissions from small water bodies like lakes, ponds, and reservoirs. Because there are no low-cost and auto-sampling tools available on the market, we have been developing a new instrument to measure these emissions.
DIY science
“Chamber” is a fancy word for the upside-down buckets we use to measure how fast greenhouse gasses are released from different surfaces. By resting a bucket upside-down on a patch of soil or grass or water and measuring how fast gas concentrations increase or decrease inside the bucket, we can calculate a “flux” of gas over a set area and time. Common methods of measuring fluxes require manually collecting gas samples from a chamber to be processed in a lab, or connecting the chamber to a high precision analyzer that can cost around $40,000. These methods are costly in salary time and equipment, limiting where, when, and how often people can sample—usually daytime and in accessible areas and times of the year. We need new low-cost and autonomous systems that can measure around the clock to improve carbon emissions estimates. The recent commercialization of cheaper sensors and control systems to operate them, like the Arduino microcontroller, now make these developments possible.
I’m building a new floating chamber that measures aquatic fluxes autonomously using a $15 methane sensor and a $78 carbon dioxide sensor, improving previous designs published by Dr. David Bastviken’s group at Linköping University in Sweden. Powered by a solar panel and battery, the sensors measure gas concentrations, temperature, and humidity inside the chamber every 30 seconds. The data is stored on an SD card and transmitted within 50 meters via radio. The radio transmission allows us to check that the chamber is functioning properly from the shore and to see chamber measurements in real time. When gas concentrations have increased enough to discern a flux, the linear actuator extends to open the chamber, flushing the interior with outside air before retracting to close the chamber again for another flux measurement. Calibrating the chamber with a high precision analyzer in the field shows the low-cost sensors perform well, with an accuracy of approximately 1 ppm for methane and 3 ppm for carbon dioxide.
Field deployment
I first tested chamber prototypes last July on agricultural reservoirs at the Tanguro Field Station in Brazil. At the end of our field campaign, I left one chamber deployed to see how long the electronics would last and which components might eventually fail. After helping me deploy and calibrate the chamber, field technician Raimundo “Santarém” Quintino monitored it, checking its “vital signs” via radio every few weeks. In January, he noticed the linear actuator had stopped pushing the chamber open.
During a follow-up field campaign in March, I brought a couple of extra linear actuators and five more chambers to deploy on additional reservoirs at Tanguro. Tanguro staff and I worked together to modify chamber components that didn’t function well in the first deployment. These modifications included swapping the materials of the floating foam bases and improving the mounting mechanisms of the linear actuator and chamber hinge. Our adjustments were informed by recommendations from a Laboratory Operations Manager at the University of Maine in Orono (Christopher London), whom I met while doing fieldwork at the nearby Howland Research Forest. Woods Hole locals, such as John Driscoll and Fred Palmer of the Woodwell Climate Facilities department, kite foiler and carpenter Tad Ryan, and employees at Eastman’s Hardware, have also offered transformative recommendations on building materials and techniques to stabilize the floating chambers.
Working hands-on with the floating chambers on the reservoirs, Santarém, Dr. Leonardo Maracahipes-Santos, Tanguro’s Scientific Projects Coordinator, and Sebastião “Seu Bate” Nascimento of Tanguro Field Station have made invaluable improvements to the chamber design and deployments. A few of their contributions include advice on safe deployment locations, monitoring and collecting data from the chambers over time, and constructing aluminum and galvanized steel components for the floating bases. They also designed a new mount for the most recent chamber addition—a bubble trap that uses an inexpensive pressure sensor to autonomously measure the volume of gas released as bubbles.
Freshwater ecosystems worldwide emit nearly half as much carbon dioxide and methane as fossil fuel combustion. On the Amazon-Cerrado frontier, where Tanguro is located, there are hundreds of thousands of small agricultural reservoirs, which are important, yet overlooked, greenhouse gas sources. These artificial ponds—installed to provide drinking water for cattle, facilitate road crossings, or supply energy at the farm scale—can persist for decades, creating low-oxygen conditions that drive methane production. Monthly sampling of six reservoirs over a year by Water Program Director Dr. Marcia Macedo revealed high methane and carbon dioxide emissions, varying with season and reservoir size. But these measurements did not capture the significant variability that can occur on daily, monthly, and annual time scales, including transient “hot spots” and “hot moments” of high greenhouse gas emissions.
This lack of frequent measurements hinders climate scientists’ ability to integrate emissions at the reservoir scale in order to estimate cumulative greenhouse gas emissions at the landscape scale. The autonomous floating chambers will address that gap, enabling comprehensive carbon monitoring and modeling of the reservoirs.
From the tropics to the Arctic
Additionally, these chambers are versatile tools that can be used across different environments. Funded by a subsequent FCS grant, six new floating chambers will accompany me to the Yukon-Kuskokwim Delta, Alaska, this summer to measure greenhouse gas emissions from Arctic ponds. The chambers will supply the frequent data necessary to constrain the LAKE model utilized by Arctic Program scientists Dr. Elchin Jafarov and Andrew Mullen. The model predicts variations in carbon emissions from ponds, providing insight into processes regulating methane and carbon dioxide. By applying the LAKE model to both Arctic ponds and Amazon reservoirs, we can gain a deeper understanding of their impacts on regional greenhouse gas budgets.
“Deploying floating chambers will streamline the process of gathering aquatic data and enhance the temporal resolution of the data, which is vital for modeling and currently absent in existing datasets,” notes Jafarov.
Problem-solving and collaboration
While calibrating the low-cost sensors in our boat one March afternoon, Santarém and I noticed the linear actuator on another nearby chamber wasn’t retracting and extending as it should. Expecting another replacement was in store, we tuned into the radio and popped open the electronics case to check for “symptoms.” Blinking lights and radio silence revealed an entirely new and perplexing issue causing the malfunction.
Building this system from the ground up over the last year, the one constant has been mind-bending electronics puzzles that keep me up at night. As a biogeochemist by training, these problems usually require some tinkering, a dictionary, a lot of Googling, and sometimes bugging electrical engineers down the street at the Woods Hole Oceanographic Institution (Lane Abrams) and Spark Climate Solutions (Bashir Ziady), whose advice and contributions have substantially improved the chambers’ electrical designs. Each problem can usually be traced to a perfectly logical, satisfying solution, leaving me feeling wiser and excited to tackle the next one. I’ve tracked this new problem down to something potentially involving a “memory-leaking variable declaration” in my new bubble trap programming code. I might’ve fixed it with a “watchdog timer.” Both are new words for me, too. If the watchdog timer doesn’t pan out, Santarém and I will try another fix.
Designing, building, and testing these chambers has been an iterative and constantly evolving process. What works well? What doesn’t? How can we do this more simply? Using less energy? For a lower cost? How can we improve the design so that other researchers can easily build these floating chambers as well? Soon we plan to publish open-source instructions detailing how to build and troubleshoot the floating chambers—I have already sent preliminary instructions to three interested research groups. I’m lucky to collaborate with many talented people from Woods Hole to Maine and Brazil, many of whom are as new to chambers and fluxes as I am to engineering. Nevertheless, these floating chambers incorporate a brilliant flourish from each of them.
Arctic wetlands are known emitters of the strong greenhouse gas methane. Well-drained soils, on the other hand, remove methane from the atmosphere. In the Arctic and boreal biomes, well-drained upland soils cover more than 80% of the land area, but their potential importance for drawing methane from the atmosphere—the underlying mechanisms, environmental controls and even the magnitude of methane uptake—have not been well understood.
A recent study led by researchers from the University of Eastern Finland and University of Montreal, in collaboration with Woodwell Climate Research Scientist, Dr. Anna Virkkala, has expanded our understanding of these dynamics, finding that Arctic soil methane uptake may be larger than previously thought. The results show uptake increasing under dry conditions and with availability of a type of soil organic carbon that can be used in microbial uptake processes.
The study was primarily conducted at Trail Valley Creek, a tundra site in the Western Canadian Arctic. The authors used a unique experimental set-up consisting of 18 automated chambers for continuous measurements of methane fluxes. No other automated chamber system exists this far North in the Canadian Arctic, and only few exist above the Arctic circle globally, most of which are installed at methane-emitting sites.
The high-resolution measurements of methane uptake (more than 40,000 flux measurements) revealed previously unknown daily and seasonal dynamics: while methane uptake in early and peak summer was largest during the afternoons, coinciding with maximum soil temperature, uptake during late summer peaked during the night. The study shows that the strongest methane uptake coincided with peaks of ecosystem carbon dioxide respiration—meaning that as methane is removed from the atmosphere, carbon dioxide production in the soil is high. Complementing flux measurements at Trail Valley Creek with measurements at other sites spread across the Canadian and Finnish Arctic showed that the availability of soil organic carbon and other nutrients may promote methane consumption in Arctic soils.
“The methane cycle has previously been primarily studied in wetlands because of their high methane emissions, but this study shows that drier ecosystems are also very important in the methane cycle,” says Dr. Virkkala.
These findings are highly relevant for estimating the current Arctic carbon budget, and for predicting the future response of Arctic soil methane uptake to a changing climate. According to the study, high-latitude warming itself, occurring up to four times faster in the Arctic than the rest of the world, will promote atmospheric methane uptake to a lesser extent than the associated large-scale drying.
“The Arctic methane budget has remained highly uncertain,” remarks the paper’s lead author, Dr. Carolina Voigt. “Our research provides one potential mechanism that might explain those uncertainties, and highlights the importance of methane measurements in drier ecosystems to calculate more accurate methane budgets.”
When boreal forests burn in the Far North of the U.S. and Canada, the whole world feels the impact. From communities evacuating from the blazes, to smoke clogging the air thousands of miles to the south, to the release of carbon emissions that accelerate climate change, boreal forest fires are a global issue.
Research from Woodwell Climate has recently expanded our understanding of the scope of impact that boreal fires have. A new paper, led by Research Associate Stefano Potter, quantified emissions associated with fires across most of boreal North America, shedding light on the dynamics of boreal fires and climate change. These four graphics explain:
1. Boreal fires threaten an important carbon sink.
Using a new higher-resolution dataset, generated as part of NASA’s Arctic-Boreal Vulnerability Experiment (ABoVE), Potter and his co-authors created a map of burned area across the boreal region. The researchers combined satellite imagery with observations from the largest database of boreal field studies, which allowed them to calculate emissions from both vegetation burned aboveground, and organic matter in the soils that burned belowground.
The results show that the overwhelming majority of carbon emissions from boreal fires—over 80% of total emissions in most places—comes from soils rather than trees. Despite the dramatic imagery of burning forests, most of the real damage is happening below the ground.
2. The true impact of boreal emissions is currently underestimated.
That finding on its own was not surprising to researchers, as the majority of carbon in boreal forests is stored below the ground. However, the fact that the overwhelming contribution of belowground carbon to fire emissions is being left out of existing global fire and climate models, means we’re drastically underestimating carbon emissions from Arctic and Boreal environments.
“A large reason for that is because the [existing] models are not detecting the belowground carbon combustion, which we are modeling directly,” says Potter.
Potter and the team working on the paper were able to accurately model belowground carbon loss because of their machine learning approach and the abundance of available field measurements in their dataset.
Accurately representing these numbers in global fire models is critical, because these models are used to plot climate trajectories and inform carbon budgets, which tell us how much we need to cut emissions to stay below temperature thresholds like 1.5 or 2 degrees C.
3. Boreal fires are becoming more intense.
It is becoming more urgent to get an accurate understanding of boreal emissions, because boreal fires are becoming larger, more frequent and more intense. Burned area has increased as fire seasons stretch longer, return intervals between fires shorten, and single ignitions can result in massive blazes that burn further and deeper and cause greater carbon loss.
In 2023, for example, while the number of ignitions has been lower than most years since the 1990s, burned area as of August has far surpassed any year in the past three decades.
4.Fire suppression can be a cost effective protection against carbon loss.
Ultimately, preventing carbon loss from boreal forest fires will require bringing down emissions from other sources and curbing warming to get fires back within historical levels. But preventing boreal forests from burning in the short term can offer a climate solution that could buy time to reduce other emissions.
A collaborative study between Woodwell Climate and the Union of Concerned Scientists, published in Science Advances, modeled the cost effectiveness of deploying fire suppression in boreal North America and found that actively combatting boreal fires could cost as little as 13 dollars per ton of CO2 emissions avoided—a cost on par with other carbon mitigation solutions like onshore wind or utility-scale solar. Informed by this data, the U.S. Fish and Wildlife Service has decided to start combating fires in Yukon Flats National Wildlife Refuge, not only when they present a threat to human health, but also with the intent of preventing significant carbon losses. Yukon Flats is underlain by large swaths of carbon-rich permafrost soils, at risk of thawing and combusting in deep-burning fires.
Deepening our understanding of the complex boreal system with further research will help inform additional strategies for bringing emissions under control, preventing devastating fires that threaten human health both regionally, and across the globe.