If the summer of 2023 felt abnormally hot to you, that’s because it was. With heat waves making headlines month after month, this year saw a spike in temperatures that broke global records.
September 2023 followed in the footsteps of both August and July as the hottest each month has been since temperature record-keeping began, making the late summer of 2023 Earth’s hottest yet. Here’s how 2023’s sweltering heat compares to past years:
- Global average surface air temperature reached a record high in the summer of 2023.
- July 24th, 2022 was the hottest day of last year, at 62.5 degrees F.
- July 3rd, 2023 was the first day that was hotter than the hottest day in 2022.
- July 6th, 2023 was Earth’s hottest day on record.
- 42 days this year were hotter than the hottest day in 2022.
Record-breaking heat in 2023
In North America alone, 78 all time records for hottest temperature were broken over the course of June, July and August. In New Iberia, Louisiana, the temperature record was broken four times, peaking at 109 degrees F. Places as far north as Wainwright Airport in Alaska saw temperatures as high as 84 degrees.
Humidity makes the heat deadly
Extreme heat events like these present a serious danger to human health. That threat is multiplied when instances of high temperature coincide with high humidity— interrupting the ability of the human body to cool off through evaporating sweat. A recent paper, co-authored by Woodwell Climate Risk Program director, Dr. Christopher Schwalm, defines “lethal heat” as a wet bulb temperature (a measure combining heat and humidity) of 35 degrees C (95 degrees F). Prolonged exposure— over 6 hours— to temperatures exceeding this can result in death even for a healthy person keeping hydrated in the shade
According to the paper, instances of deadly heat waves are increasing with climate change. Already, with over a degree of warming, parts of Northern India are seeing annual heat events. By just two degrees of warming— a milestone we are currently on track to hit by mid-century— a quarter of the world is expected to experience a lethal heat event at least once in a decade. A significant subset of the world, particularly regions of India, Africa, South America, and the Southeastern US, can expect deadly heat conditions at least once a year at that point, and the area will expand wider with each half degree of warming.
It’s a forecast that highlights the urgency of acting to mitigate warming and developing local and regional strategies to prepare communities to handle high heat and humidity events when they do come.
“It puts this past year’s heat waves into somber perspective,” says Dr. Schwalm. “Without action, we put a lot more, potentially billions, of people at risk of heat stress or death on an annual basis. It’s a significant public health concern.”
Fires, heatwaves get an early start this year
In some places, an extreme summer has already begun
Springtime in the Northern hemisphere is a momentary respite for many places—a pause before the heat of summer and potential for drought and fire. This year, however, summer arrived early, bringing with it scorching temperatures and out-of-control fires that have made national and international headlines.
Record March-April heatwave sweeps India and Pakistan
Portions of India and Pakistan already have experienced record-setting heat. Unseasonably warm weather began in March, when India recorded the hottest monthly temperatures that the country has seen in the past 122 years—hitting an average maximum of 33.1 degrees Celsius (91.6 Fahrenheit). The heatwave continued with the third hottest April on record. The hottest time for India is typically May and June, before the monsoon season begins.
In addition to the early start of summer temperatures, this heat wave is particularly concerning for its scope. The heat has settled over most of India as well as parts of neighboring Pakistan for two months.
“The most shocking part for me has been the geographical extent and the duration,” said Woodwell Assistant Scientist, Dr. Zach Zobel in an interview with CNBC.
The heat-related death toll in Maharashtra state, the second-most populous state in India, has already reached 25. Heat waves like this one become particularly dangerous when humidity is high—preventing the human body from cooling itself through sweat and evaporation.
Earlier and more intense heat waves also have the potential to disrupt India’s crop yields, particularly heat, which is vulnerable to hot, dry weather. As climate change progresses unchecked, extreme heat waves like this one will become more and more common.
Megafires in New Mexico forcing evacuations
On the other side of the globe, rising temperatures have resulted in a rash of destructive fires well before the usual summer season. The state of New Mexico is currently fighting 20 separate fires in 16 counties. Two, the Hermit’s Peak and Calf Canyon fires, recently merged into the state’s second-largest wildfire on record, which has been burning now for more than a month.
The merged “megafire” has destroyed at least 276 structures and forced the evacuation of nearly 13,000 residences.
New Mexico is used to a fire season that starts in May or June. Climate change is making out-of-season fires more common and big fires were seen this year in Colorado and California as early as December and January. The United Nations declared a global wildfire crisis in February.
Climate change is warming and drying out western U.S. states, increasing the number of “fire weather days.” This has made fire management harder, limiting the possible timeframe for prescribed burns that reduce fuel loads. Intense winds also played a large role in fanning the New Mexico fires, one of which began as a prescribed burn that escaped.
Heat rising, summers lengthening with climate change
As temperatures rise, the risks from deadly heatwaves and wildfire are growing. Fire seasons and extreme heat seasons are lengthening, frequently starting earlier and ending later, giving the land no time to recover from dry winters or the prior year’s heat. The response to both the fires in New Mexico and heat in India and Pakistan is the same—rapidly reducing global emissions by 15% every year to hit the IPCC target of 1.5 degrees of warming.
“There is no question that heat waves are made worse by fossil fuels and climate change everywhere in the globe,” said Dr. Zobel. “India and Pakistan are two of the hottest places in the world and will likely continue to see heat waves of this magnitude and worse over the next several decades.”
Unequal heat
A visit to Worcester, Massachusetts in the heat of summer highlights the inequities of rising temperatures
It’s a hot, humid day in late August and we’re all already sweating as Arman Bajracharya begins to tell us about his project.
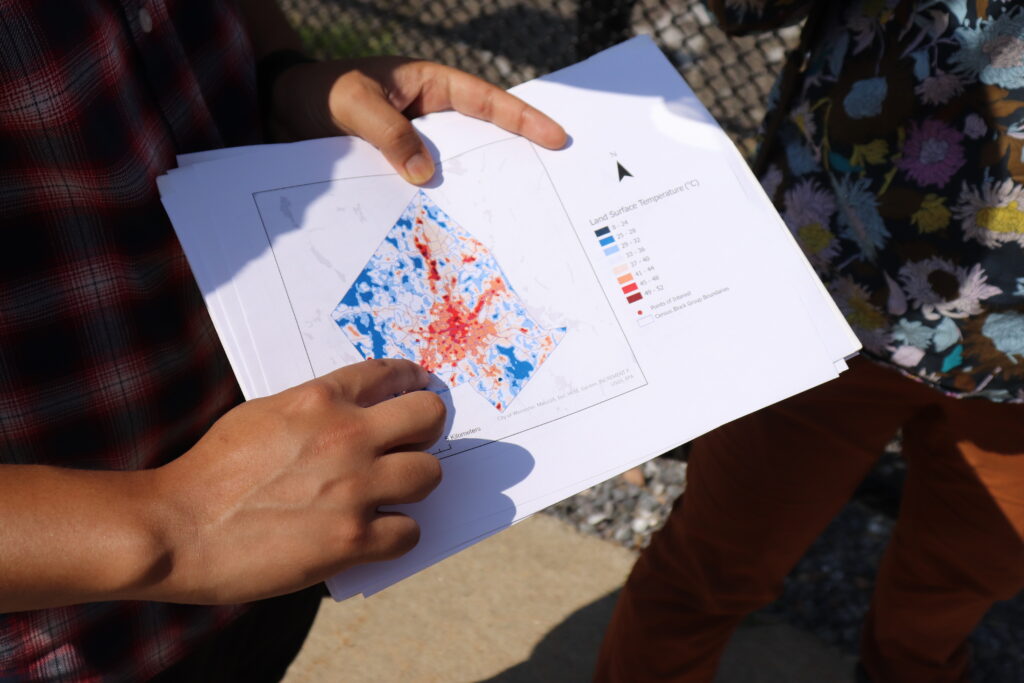
Bajracharya is a second year Ph.D. student in the geography department at Clark University in Worcester, MA, where we’re standing now. He pulls out a green and orange map of the city and points to our location on one of the orange blocks that signals industrial land use and impervious land cover.
We’re standing in the sparse shade of some trees ringing the edge of an old millpond, but we had to walk across a hot, cracked parking lot to access it. The neighborhood is called Webster Square. It is located in the southern reaches of Worcester, which was once a vibrant epicenter of the industrial revolution.
That industrial heritage is evident both on the maps Bajracharya shows us as well as in our surroundings. Truck beds and spare pvc piping and gravel piles rest at the edge of the water. It’s also scorching hot.
Temperature varies with land cover. In cities, the presence of impervious surfaces like asphalt, concrete, and metal trap heat, while natural surfaces—water or vegetation—can help buffer it. The distribution of these hotspots and heat buffers in Worcester, as in many cities, is not equal. Some neighborhoods endure much higher temperatures than others during the summer months.
Bajracharya’s research during the Summer of 2021 made possible by the Edna Bailey Sussman Fund employed remote sensing and census data to determine what features make a neighborhood more susceptible to extreme heat. He mapped temperature, land cover, and land use onto areas of greatest social vulnerability in Worcester, as well as two other post-industrial cities in Massachusetts, Haverhill and New Bedford. The results show that as climate change warms cities, the communities that have already experienced environmental inequities are likely to face more.
A gateway to the American dream
Worcester, Haverhill, and New Bedford are designated as gateway cities. These places, often important centers of the industrial revolution, have served as “gateways to the American dream,” offering job opportunities and housing for many who immigrated to the region.
Worcester began its industrial life as a mill town but soon grew into a manufacturing center for a variety of goods. It was also a crossroads of canal, and later, rail thoroughfares connecting the rest of Massachusetts with Providence and New York. Today, at the edge of the millpond in Webster Square, the remnants of an old rail bridge are still visible and active trains can be heard traveling the present day rail lines in the distance.
Industrial neighborhoods built to serve mills and factories often filled in with minority populations, and over time, wealthier families moved to quieter and more suburban areas of town. In the case of Haverhill, some communities also suffered the consequences of redlining, a discriminatory Federal Housing policy during the post-Depression era that limited financial services available to people, overwhelmingly African-American and people of color, deemed “hazardous to investment,” limiting social mobility and enforcing racial housing segregation. These factors often intensified the overlap between areas of high social vulnerability and industrial infrastructure.
“In the 1930s, these practices delineated which areas were defined to be good for financial services like loans,” Bajracharya says. “Which is why there is a historical divide between which areas are favorable and which areas are not. That can impact how we see the land being used today, especially where the greenspaces are.”
Mapping the heat
Bajracharya used available satellite data to show the relationship between land cover and social vulnerability. Examining the imagery, he created an index of relative heat in the city. Areas with high tree cover correlated with lower land surface temperatures. He then overlaid social vulnerability and environmental justice datasets that index communities in Massachusetts based on socioeconomic status, minority status, primary language, and other demographic information.
“Throughout many or most U.S. cities, neighborhoods facing greater environmental risks (such as from heat waves, urban flooding, and hazardous wastes) were historically settled by poorer families or racial and ethnic minorities,” Bajracharya says. “And there really is a lot of evidence for communities of color, or low-income communities, continuing to be disproportionately exposed to risk.”
According to Bajracharya, the analysis showed a startling overlap between the hottest areas of the city and the most vulnerable. Neighborhoods classified as Environmental Justice Communities tended to have a lower percentage of green vegetation (especially tree cover), with higher average temperatures. The most vulnerable areas are clustered in the core of the city.
The satellite maps only tell part of the story, however, which is why Bajracharya and his advisor Dr. Rinku Roy Chowdhury have brought us out onto the streets of Worcester. A few blocks away from the millpond, a grassy field rolls out behind a chain-link fence. In Bajacharya’s maps, this appears as a patch of vegetation interspersed among the developed land uses. The field sits under metal towers belonging to a nearby power station.
Often, Roy Chowdhury reminds us, the “green” and “blue” spaces that do exist in vulnerable areas may be inaccessible to residents, either cordoned off as private property or unsuitable for use due to safety concerns or an absence of trails or paths. The sign on the chain-link fence here warns of danger from high voltage.
This is where the distinction between land cover and land use becomes important. Land cover refers to what is currently on the land— whether that’s forest, grassland, or concrete. Land use data shows how humans are interacting with an area of land. For example, an area of grassy land cover could be used for conservation, residential or commercial purposes.
When natural land covers such as trees and water bodies are present but inaccessible, it limits potential social co-benefits that green and blue spaces can offer. Beyond regulating temperature, these spaces can reduce air pollution and provide recreational opportunities. Bajracharya and Dr. Roy Chowdhury emphasize the importance of field trips like this one, along with more in-depth work to ground truth satellite image analysis in local realities.
“There’s a really interesting mix of industrial and commercial uses interspersed with areas important for conservation and recreation, that could also potentially help in bringing down surface temperatures,” Dr. Roy Chowdhury says. “Tree cover and water are really helpful for buffering against the urban heat island, but so much more needs to be done to understand and steward such ‘ecosystem services,’ especially in underserved areas of cities.”
Building an Emerald City
With climate change accelerating, every patch of green and blue on the map will become indispensable in regulating city temperatures. To prevent a crisis of infrastructure failures and heat-related illnesses and even deaths from unfolding during brutal summers, cities like Worcester are going to have to get greener, faster—and do so in a way that benefits residents equitably.
Dr. Roy Chowdhury and Bajracharya are interested in investigating further to figure out the most promising pathways towards greener, more equitable cities. Questions still remain around finding the best proportion and distribution of land cover and implementation strategies that will improve environmental equity and encourage citizen participation. Woodwell’s Dr. Chris Neill has been collaborating with Dr. Roy Chowdhury and Clark University over the last decade to analyze land cover and ecological structure of urban vegetation in several US cities.
“Every tree makes a difference, but there are scale effects as well. What is the minimum threshold to make a difference? What’s the mix in different cities or neighborhoods? What do local residents value and want? These are really interesting and important questions to ask,” says Dr. Roy Chowdhury.
Research into the interactions between these green spaces and rising temperatures could help city planners make more conscious decisions about climate adaptation. Baracharya’s future projects may also examine flooding risk in cities, which adds another dimension to potential inequities in climate risk. Future research could also incorporate social interviews in different neighborhoods to understand residents’ concerns regarding their environment, climate change, and quality of life.
The last stop on our Worcester tour is Beaver Brook Park— an example of what’s possible when a city decides to reinvest in its natural spaces. The neighborhood surrounding the park was a primary destination for Black Americans moving north after the Civil War and has a history as a vibrant minority community. The titular brook had been paved over years ago, running in darkness under the city until 1990, when it was daylighted again to serve as a central feature of the park.
The area is now a green haven for recreation in the neighborhood and a stop on Worcester’s East-West trail, which Dr. Roy Chowdhury describes as “an emerald necklace” running through Worcester—one of the ways the city and numerous environmental stewardship organizations are working towards broader greenspace protections and access.
The feel of the air here contrasts sharply with where we started the day—a hint of the power urban greenspaces hold. Despite the heat warping off the street pavement, in the shade of old oak trees by the gurgling brook, it’s easy to stop sweating for a moment and just feel the breeze.