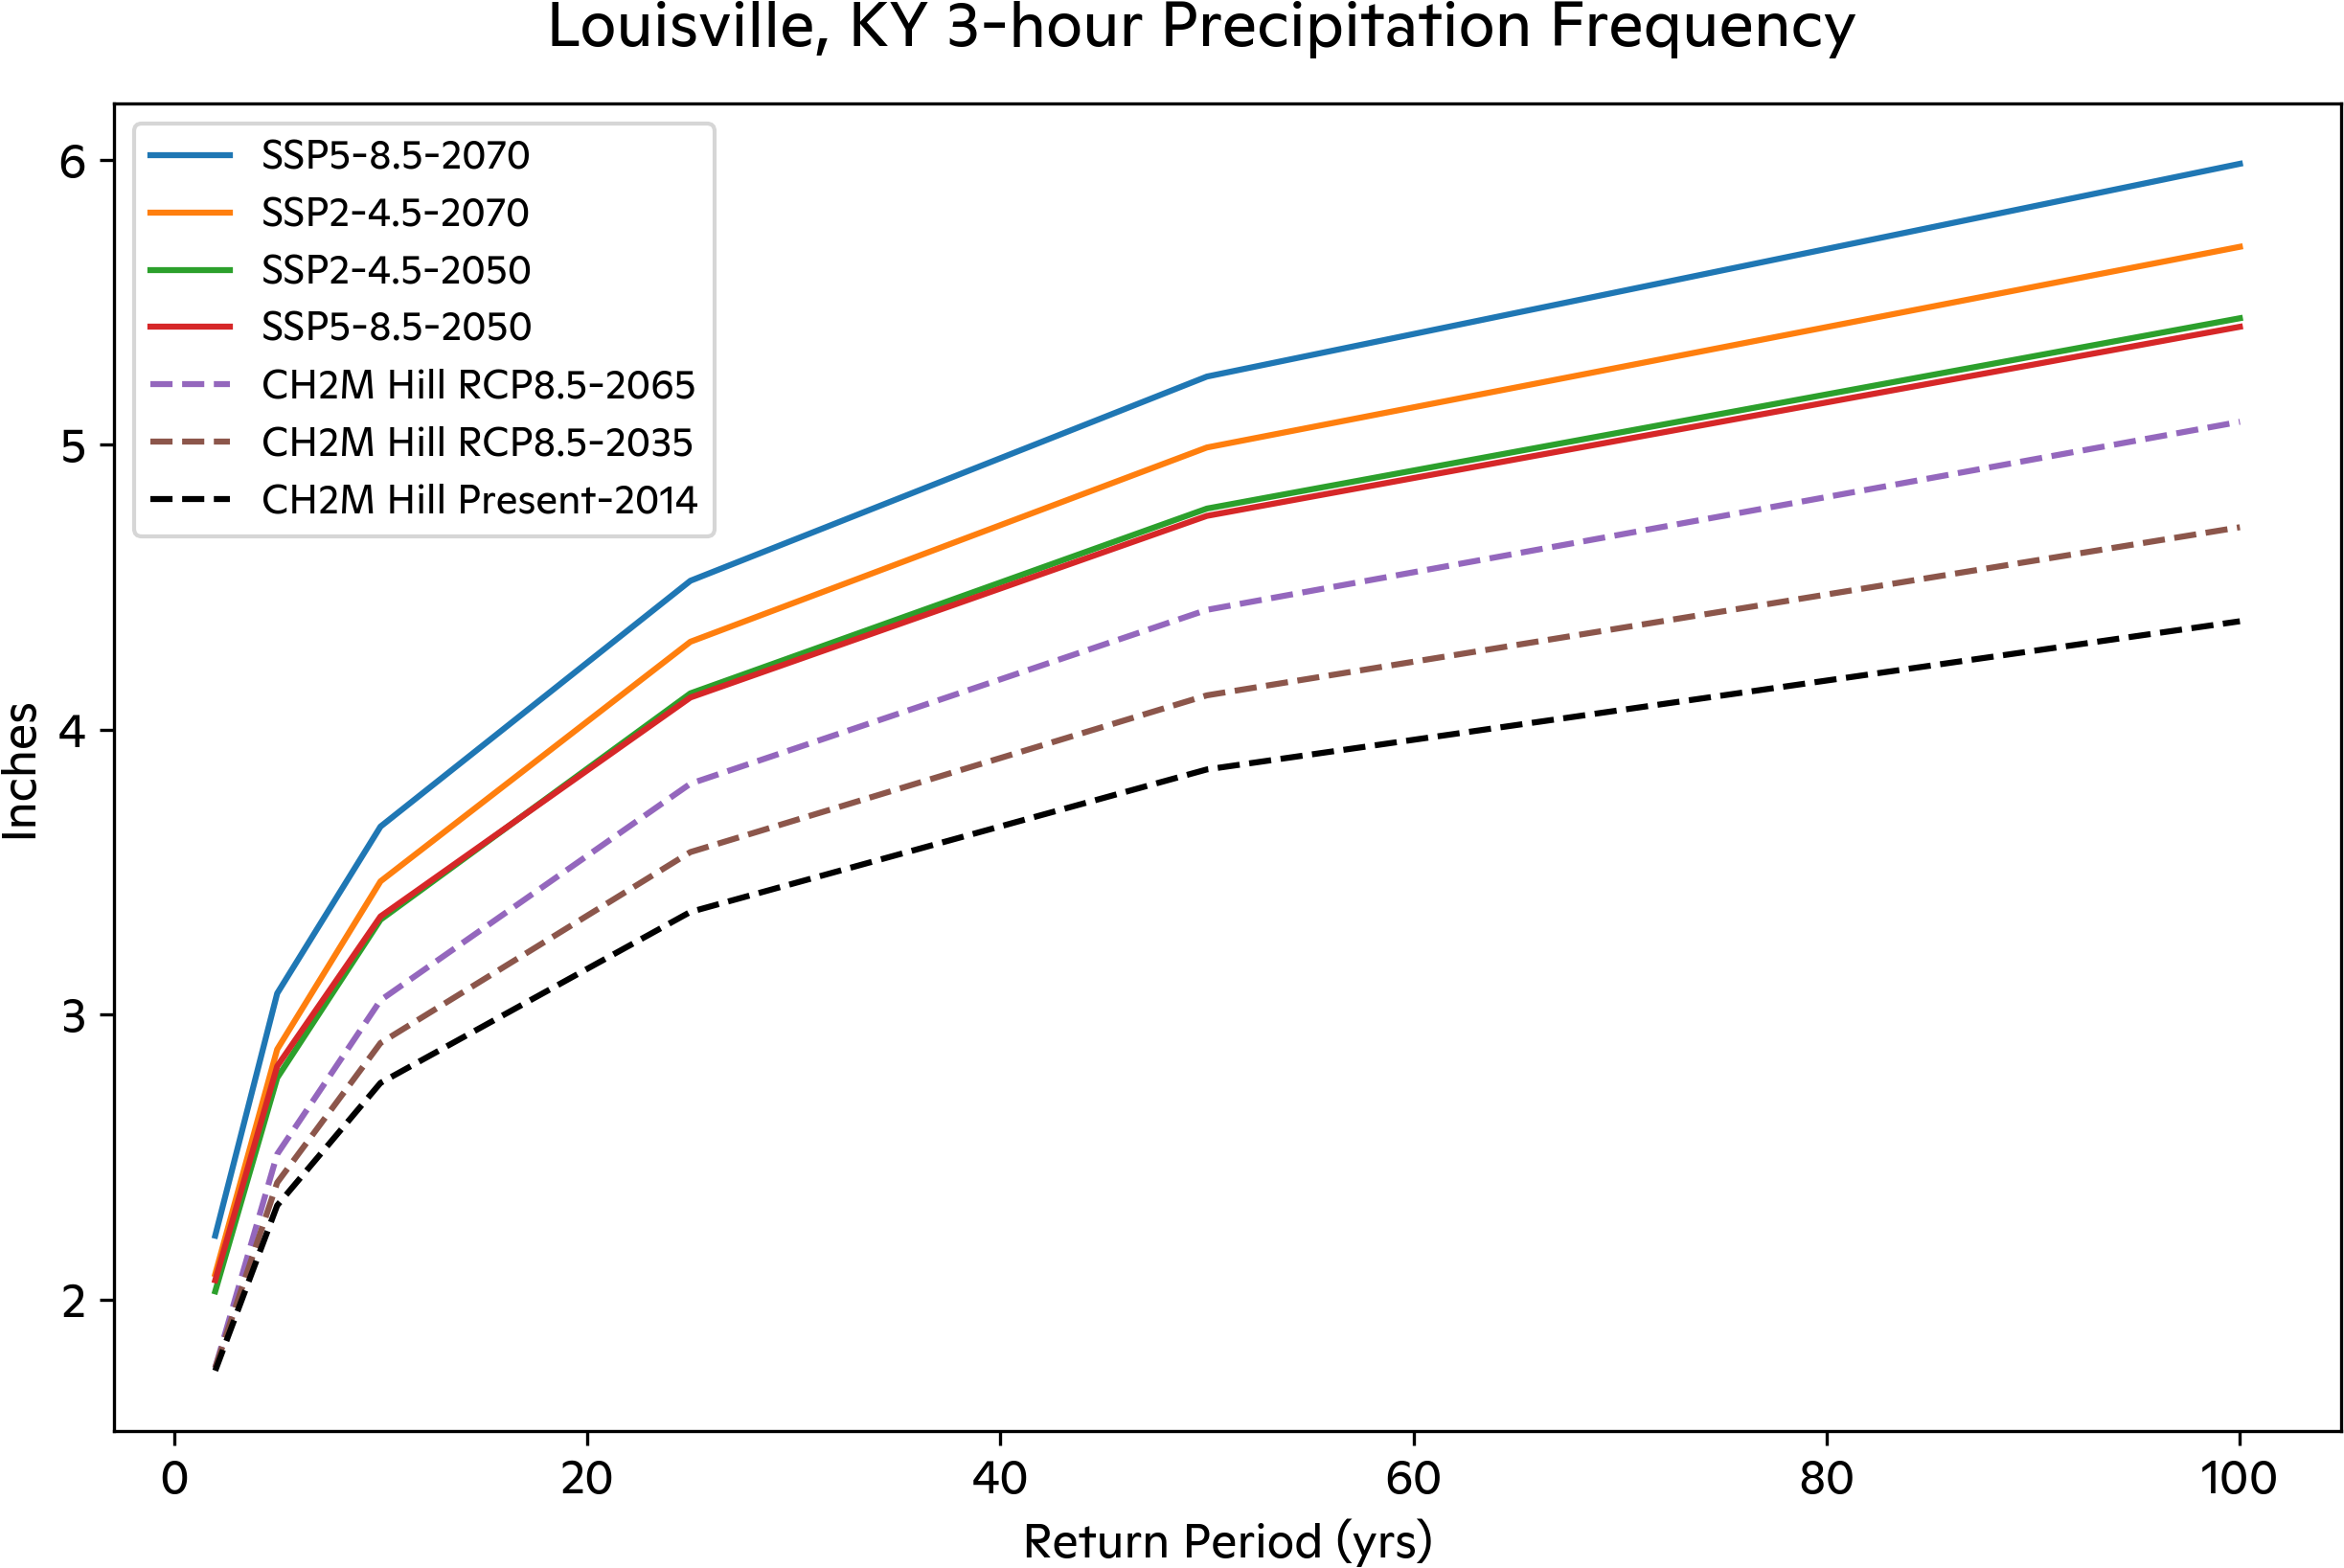
Figure 1: Depth-Frequency curve for the three-station average for historical, CH2M Hill projections, and Woodwell projections of the 3-hour rainfall event.

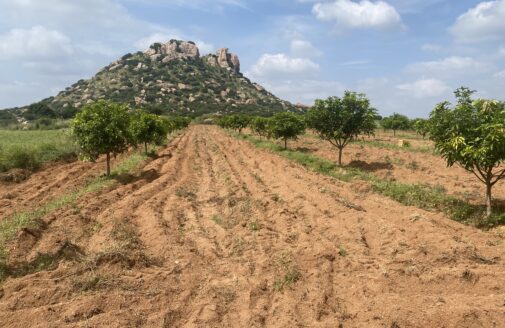
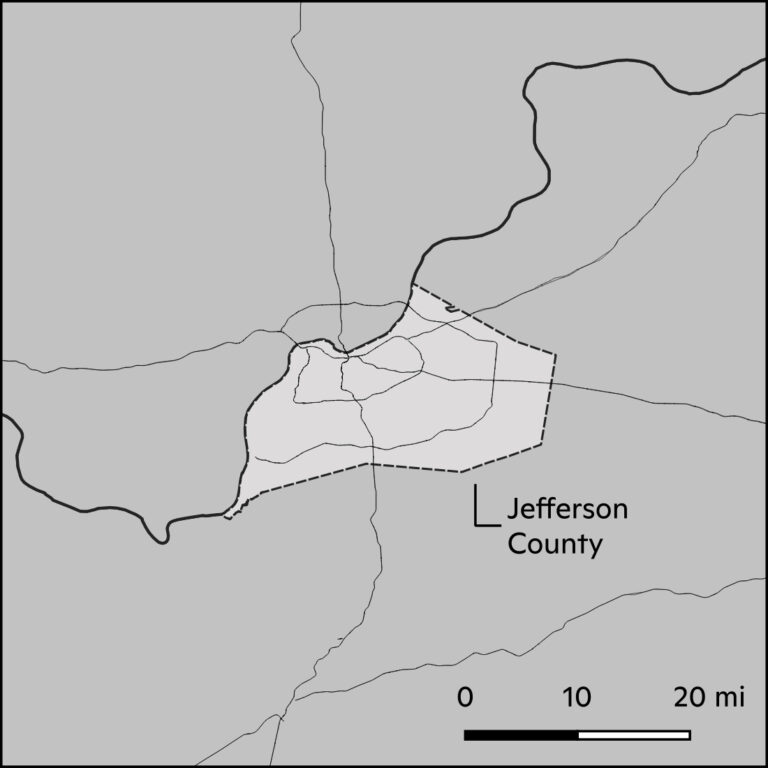
The impacts of climate change on the frequency and severity of physical hazards are putting many communities at risk. As the threat of climate change grows, so too does the need for accessible information, tools, and expertise to support climate-resilient decision making across multiple scales, from communities to countries. Woodwell Climate Research Center believes there is a need to localize and customize climate risk assessments. This information is critical for local government leaders as they make planning decisions, but it is not available to all communities. Woodwell believes that this science should be freely and widely available. To address this gap, Woodwell works with communities across the world, including Louisville, KY, to provide community climate risk assessments, free of charge. This report was generated in partnership with the Louisville Metropolitan Sewer District (Louisville MSD), so we have focused this analysis within the geographic area of Jefferson County, KY.
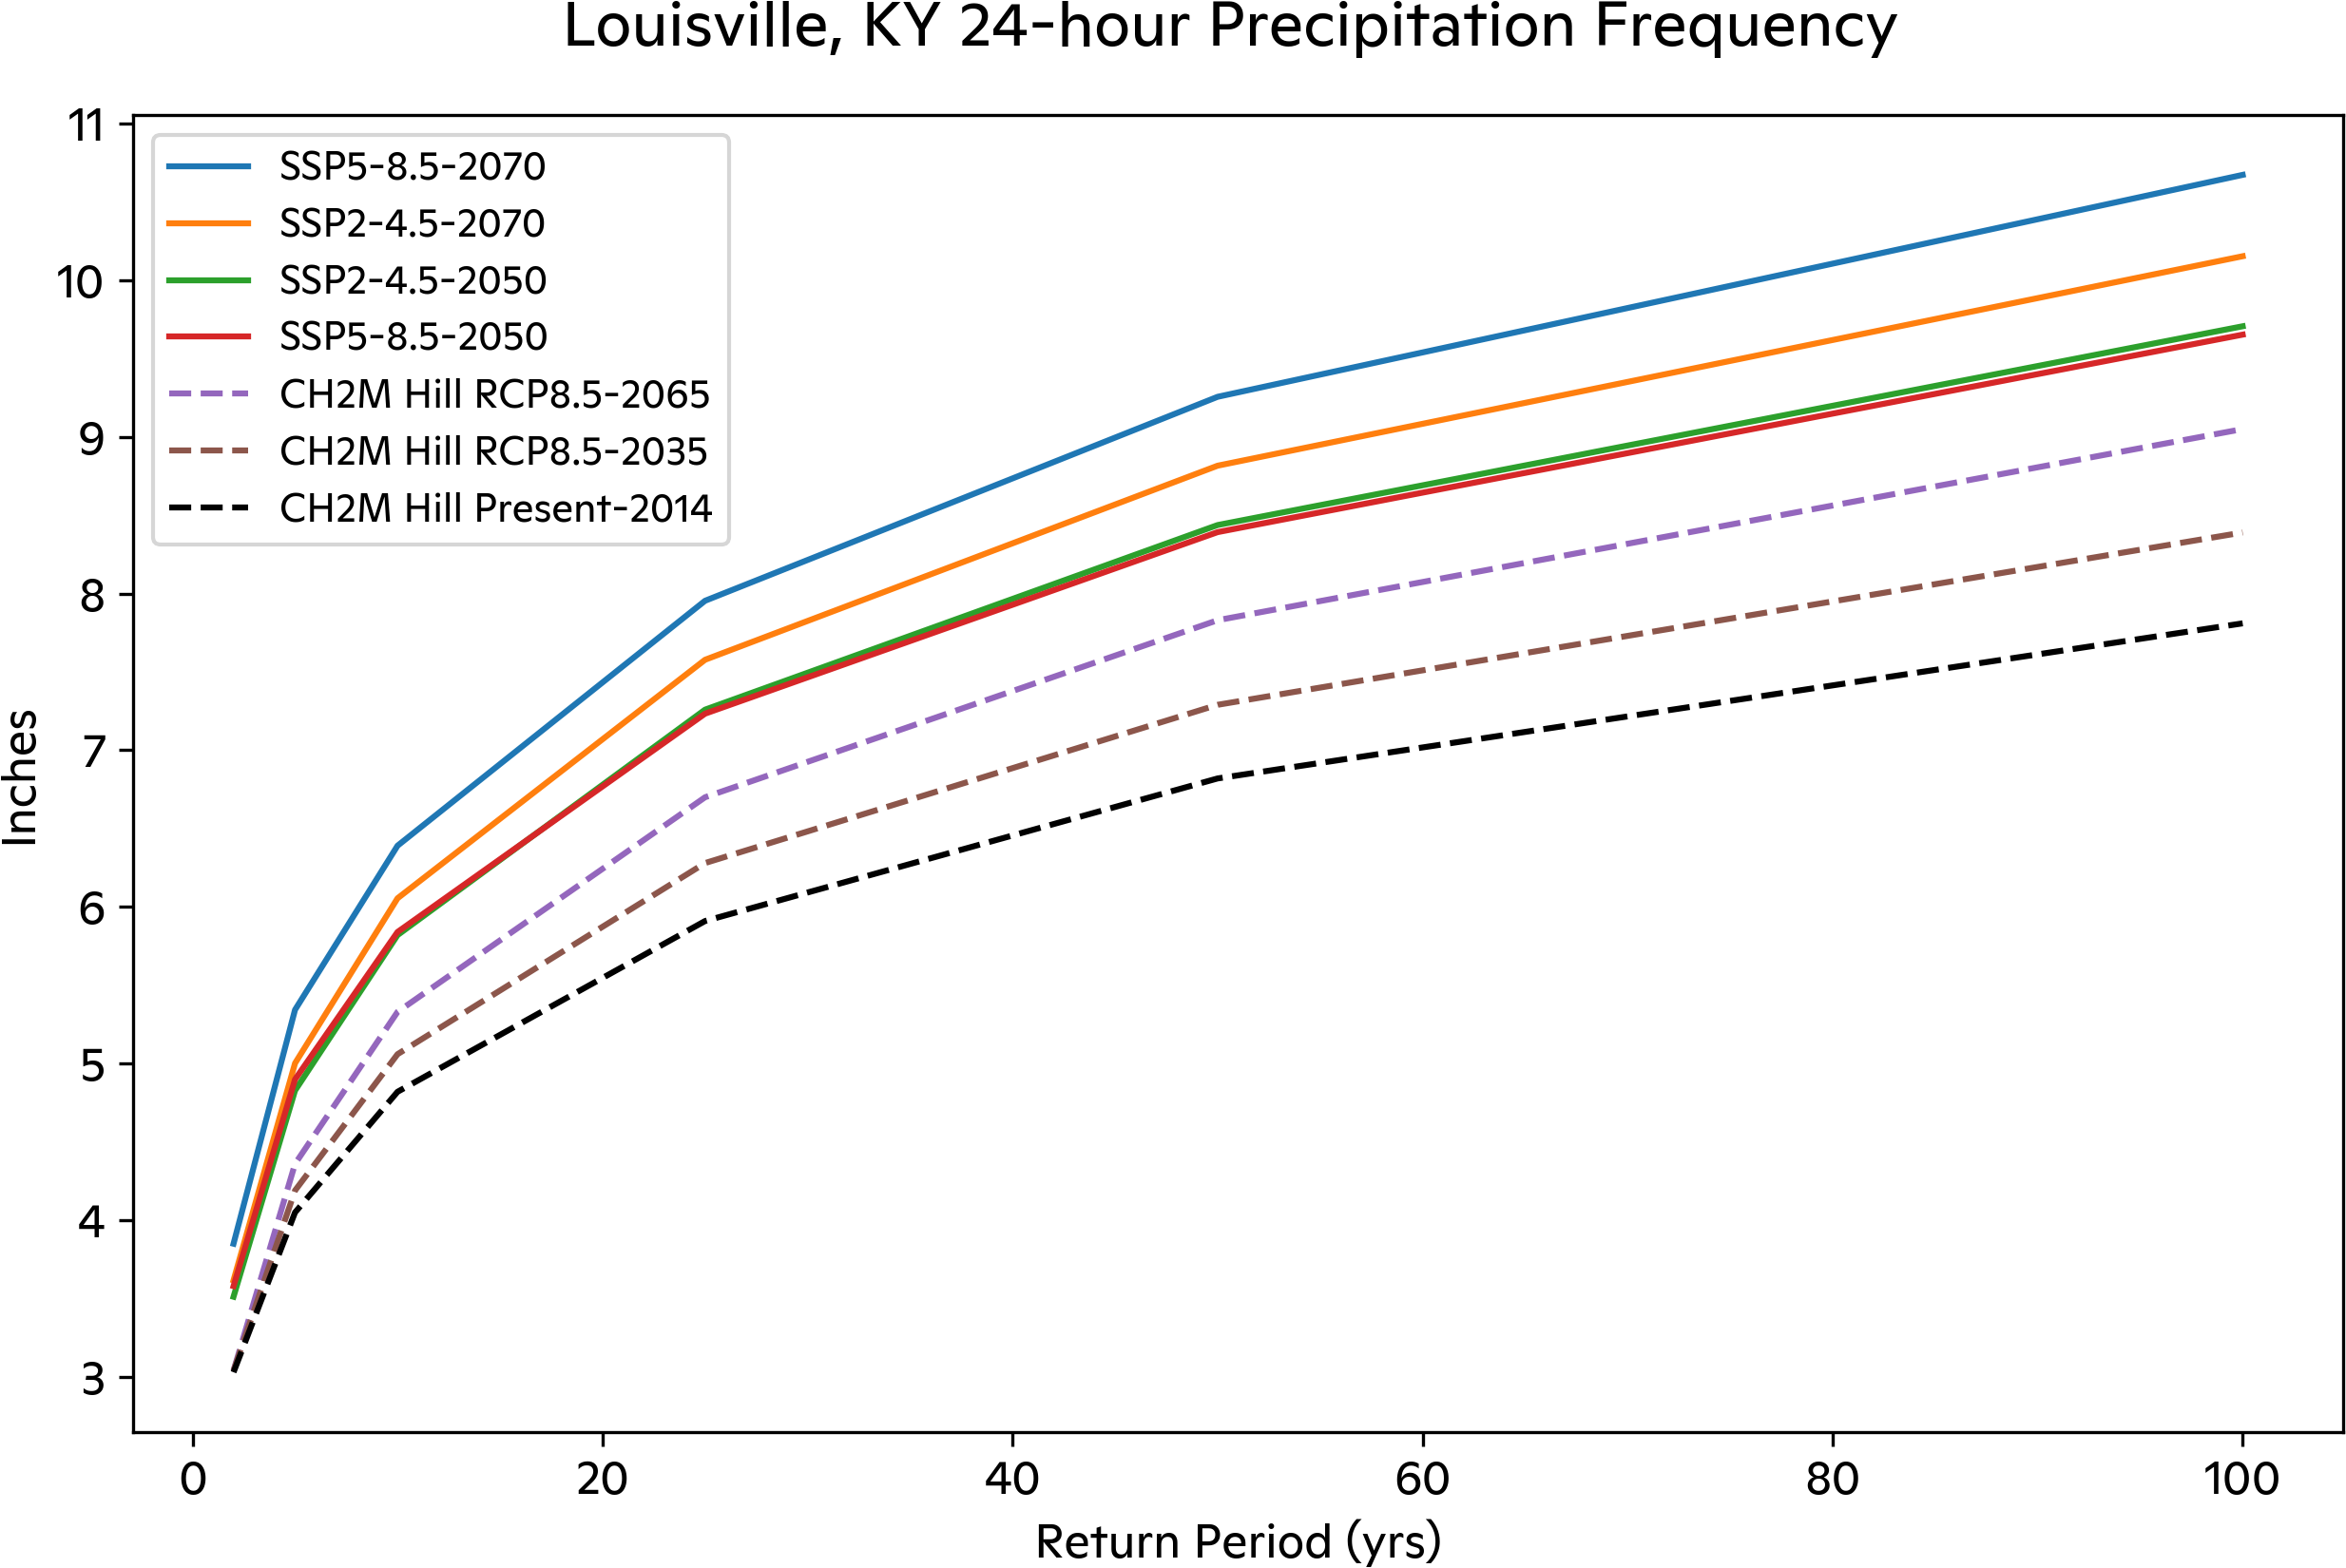
As a result of climate change, the 100-year 24-hour extreme precipitation event amount of rainfall will be 24% greater by 2050 and between 29% and 37% greater by 2070, compared to the 2014 amount of 7.8 inches. Odor days, periods of time with low precipitation and moderate to high temperatures that cause sewage odors, will increase from 140 days per year on average to 145 days by 2050 and 156 days by 2070 under a high emissions scenario. Here we present our findings on extreme precipitation and odor days to help Louisville, KY in its plans to create a more resilient future for all residents.
In 2015, the engineering firm CH2M Hill was contracted by Louisville MSD to conduct an assessment on how climate change would impact extreme precipitation in the near future. We provide a brief comparison of Woodwell’s and CH2M Hill’s methodologies which will hopefully provide clarity on the differences between the results from the two assessments.
There are several similarities between the methodologies of CH2M Hill and Woodwell to estimate changes in future extreme precipitation. The main similarities are that both use a regional fitting method for the Generalized Extreme Value (GEV) distribution, the delta ratio method for estimating changes between historical and future precipitation, downscaling was done similarly using bilinear interpolation to a 1km resolution, and both use the updated 2014 National Atlas 14 (NA14) Precipitation Frequency Estimates (PFEs) as the baseline that CH2M Hill generated in their analysis. The main differences are as follows and are by no means comprehensive.
Woodell projects that extreme precipitation is expected to intensify in Louisville through 2070. By 2050, we estimate that the 100-year 24-hour event will be 9.7 inches and 9.6 inches under SSP2-4.5 and SSP5-8.5, respectively, up from 7.8 inches currently. In comparison, CH2M Hill projects the same event will be 9 inches by 2065 under RCP8.5. By 2070, Woodwell projects the 100-year 24-hour event will be 10.1 inches and 10.7 inches under SSP2-4.5 and SSP5-8.5, respectively. Similar shifts between scenarios, years, and data providers are present in lower return periods and the 3-hour event as can be seen in Figures 1 and 2. As shown in Figures 1 through 4, results for SSP2-4.5 and SSP5-8.5 in 2050 are highly similar. This is because the scenarios do not diverge significantly by 2050 and internal climate variability influences the GEV distribution more than the climate change signal.
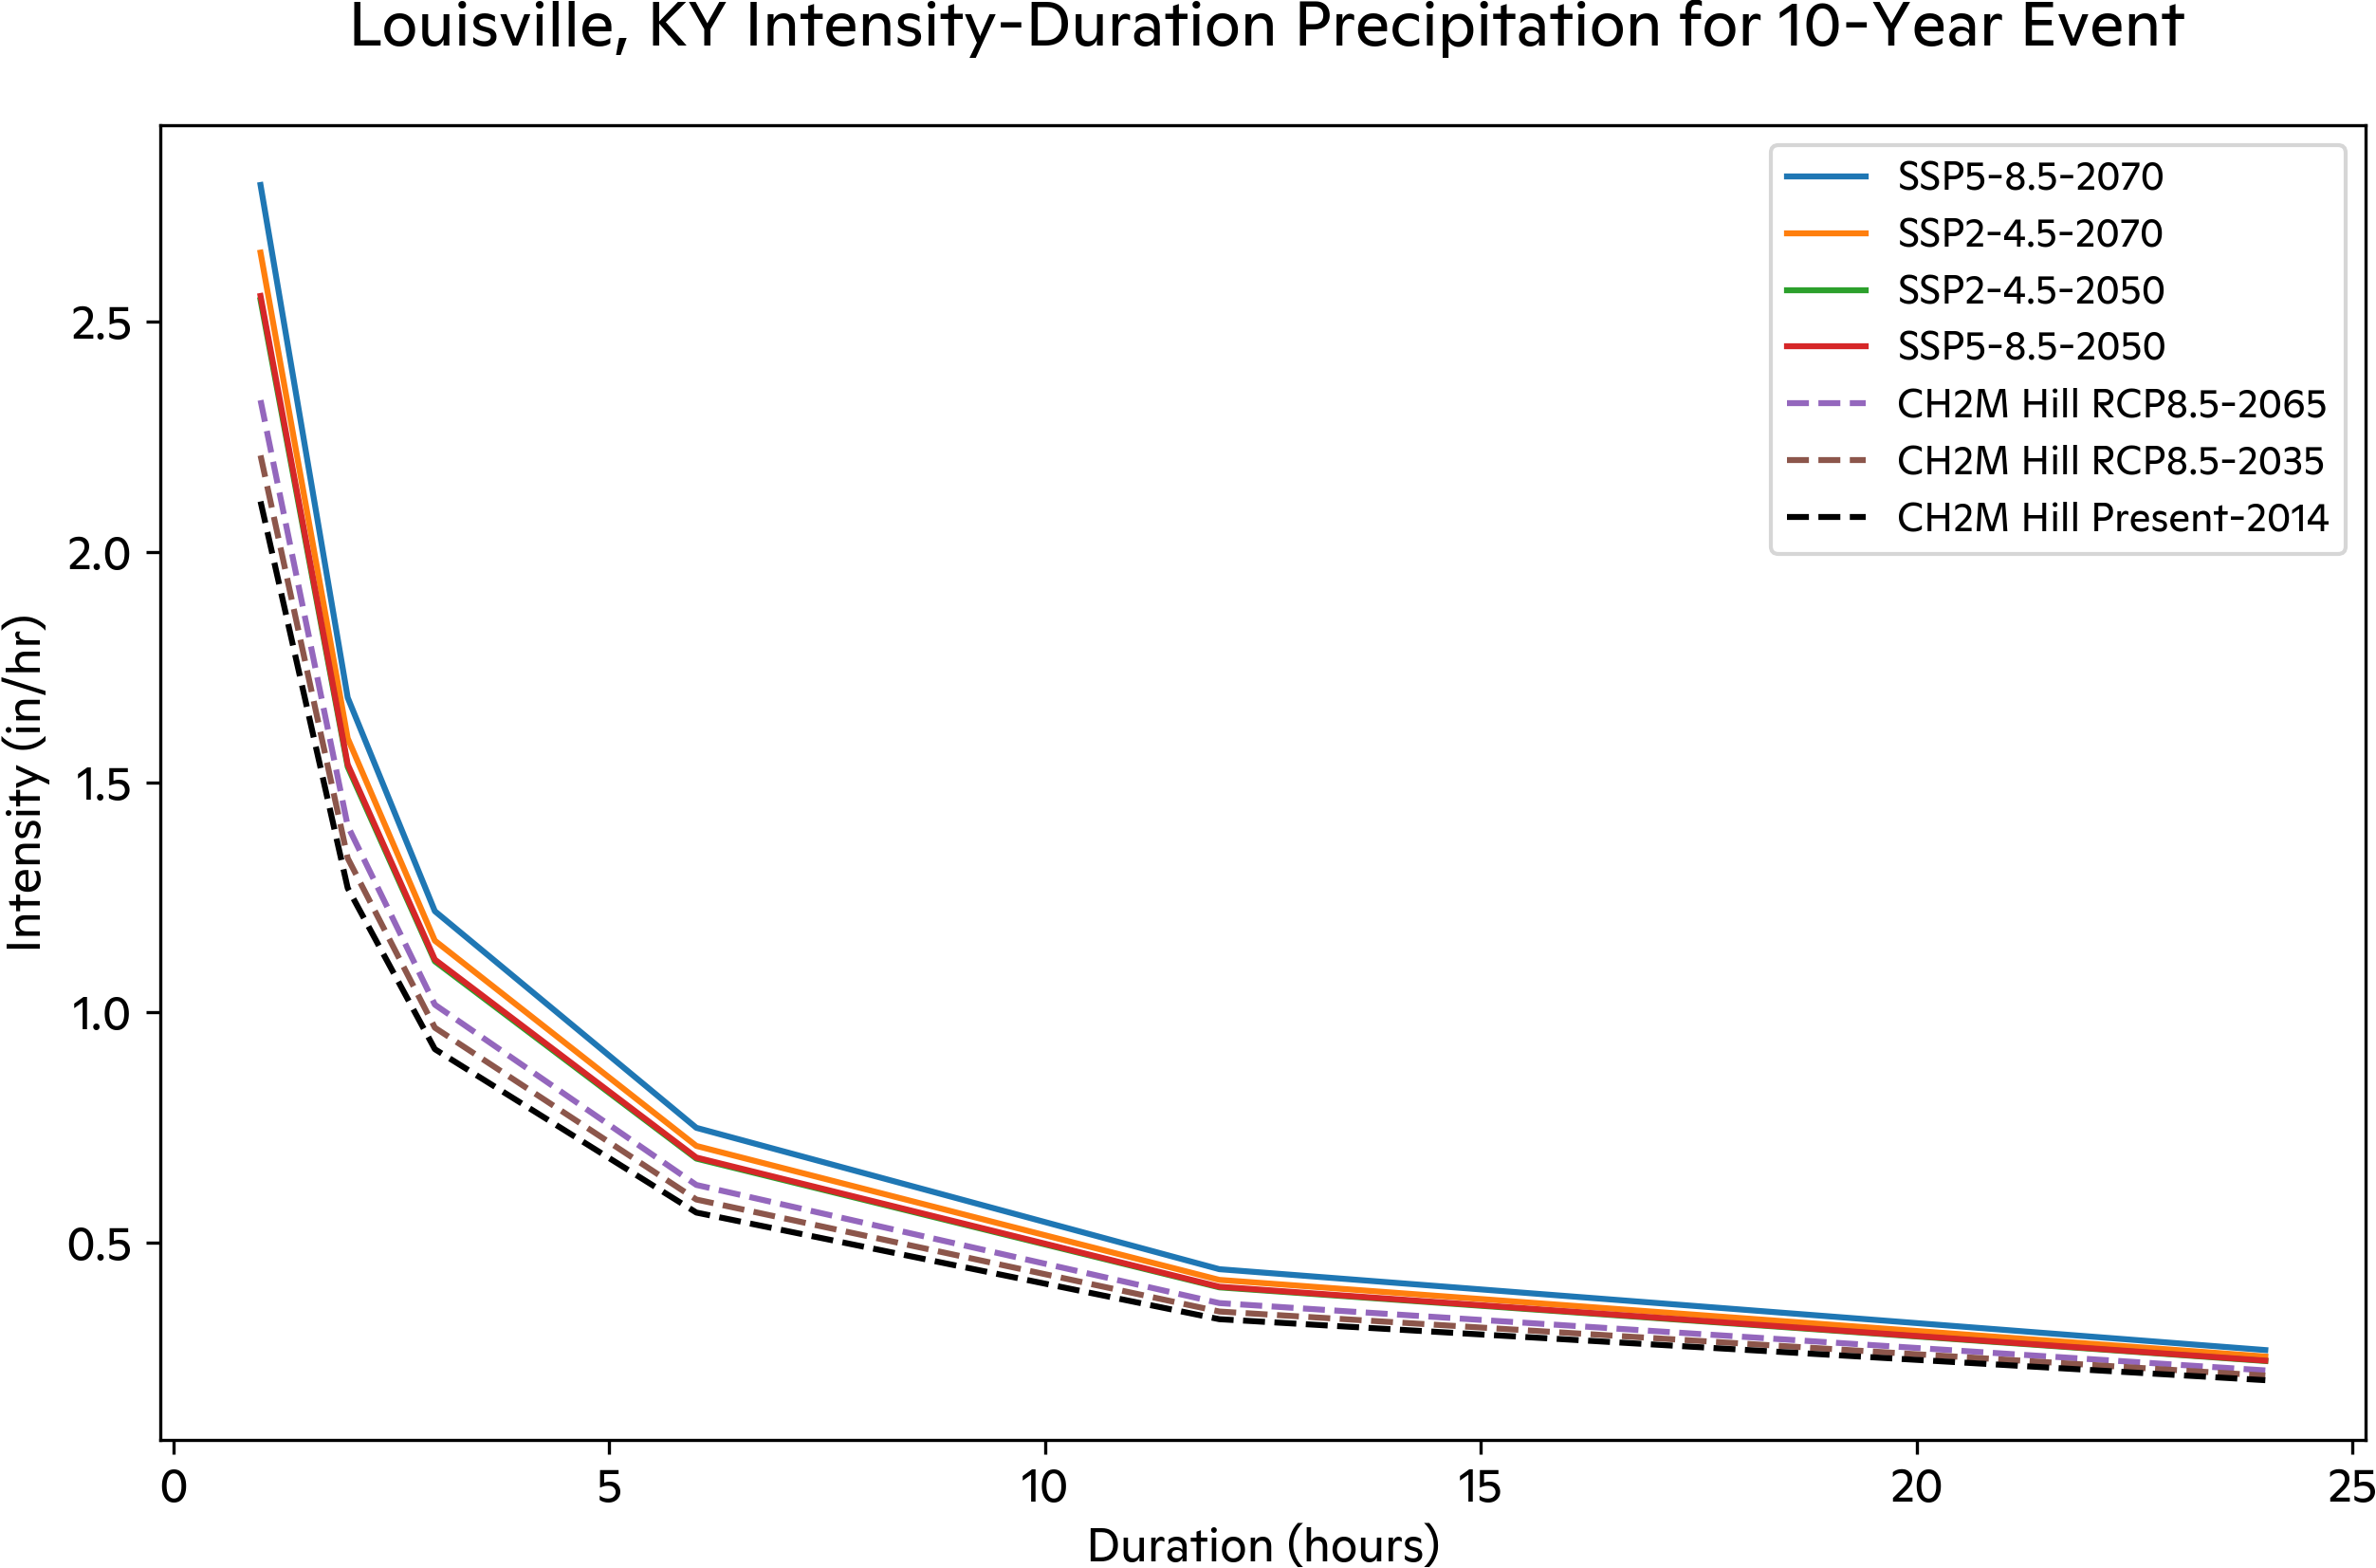
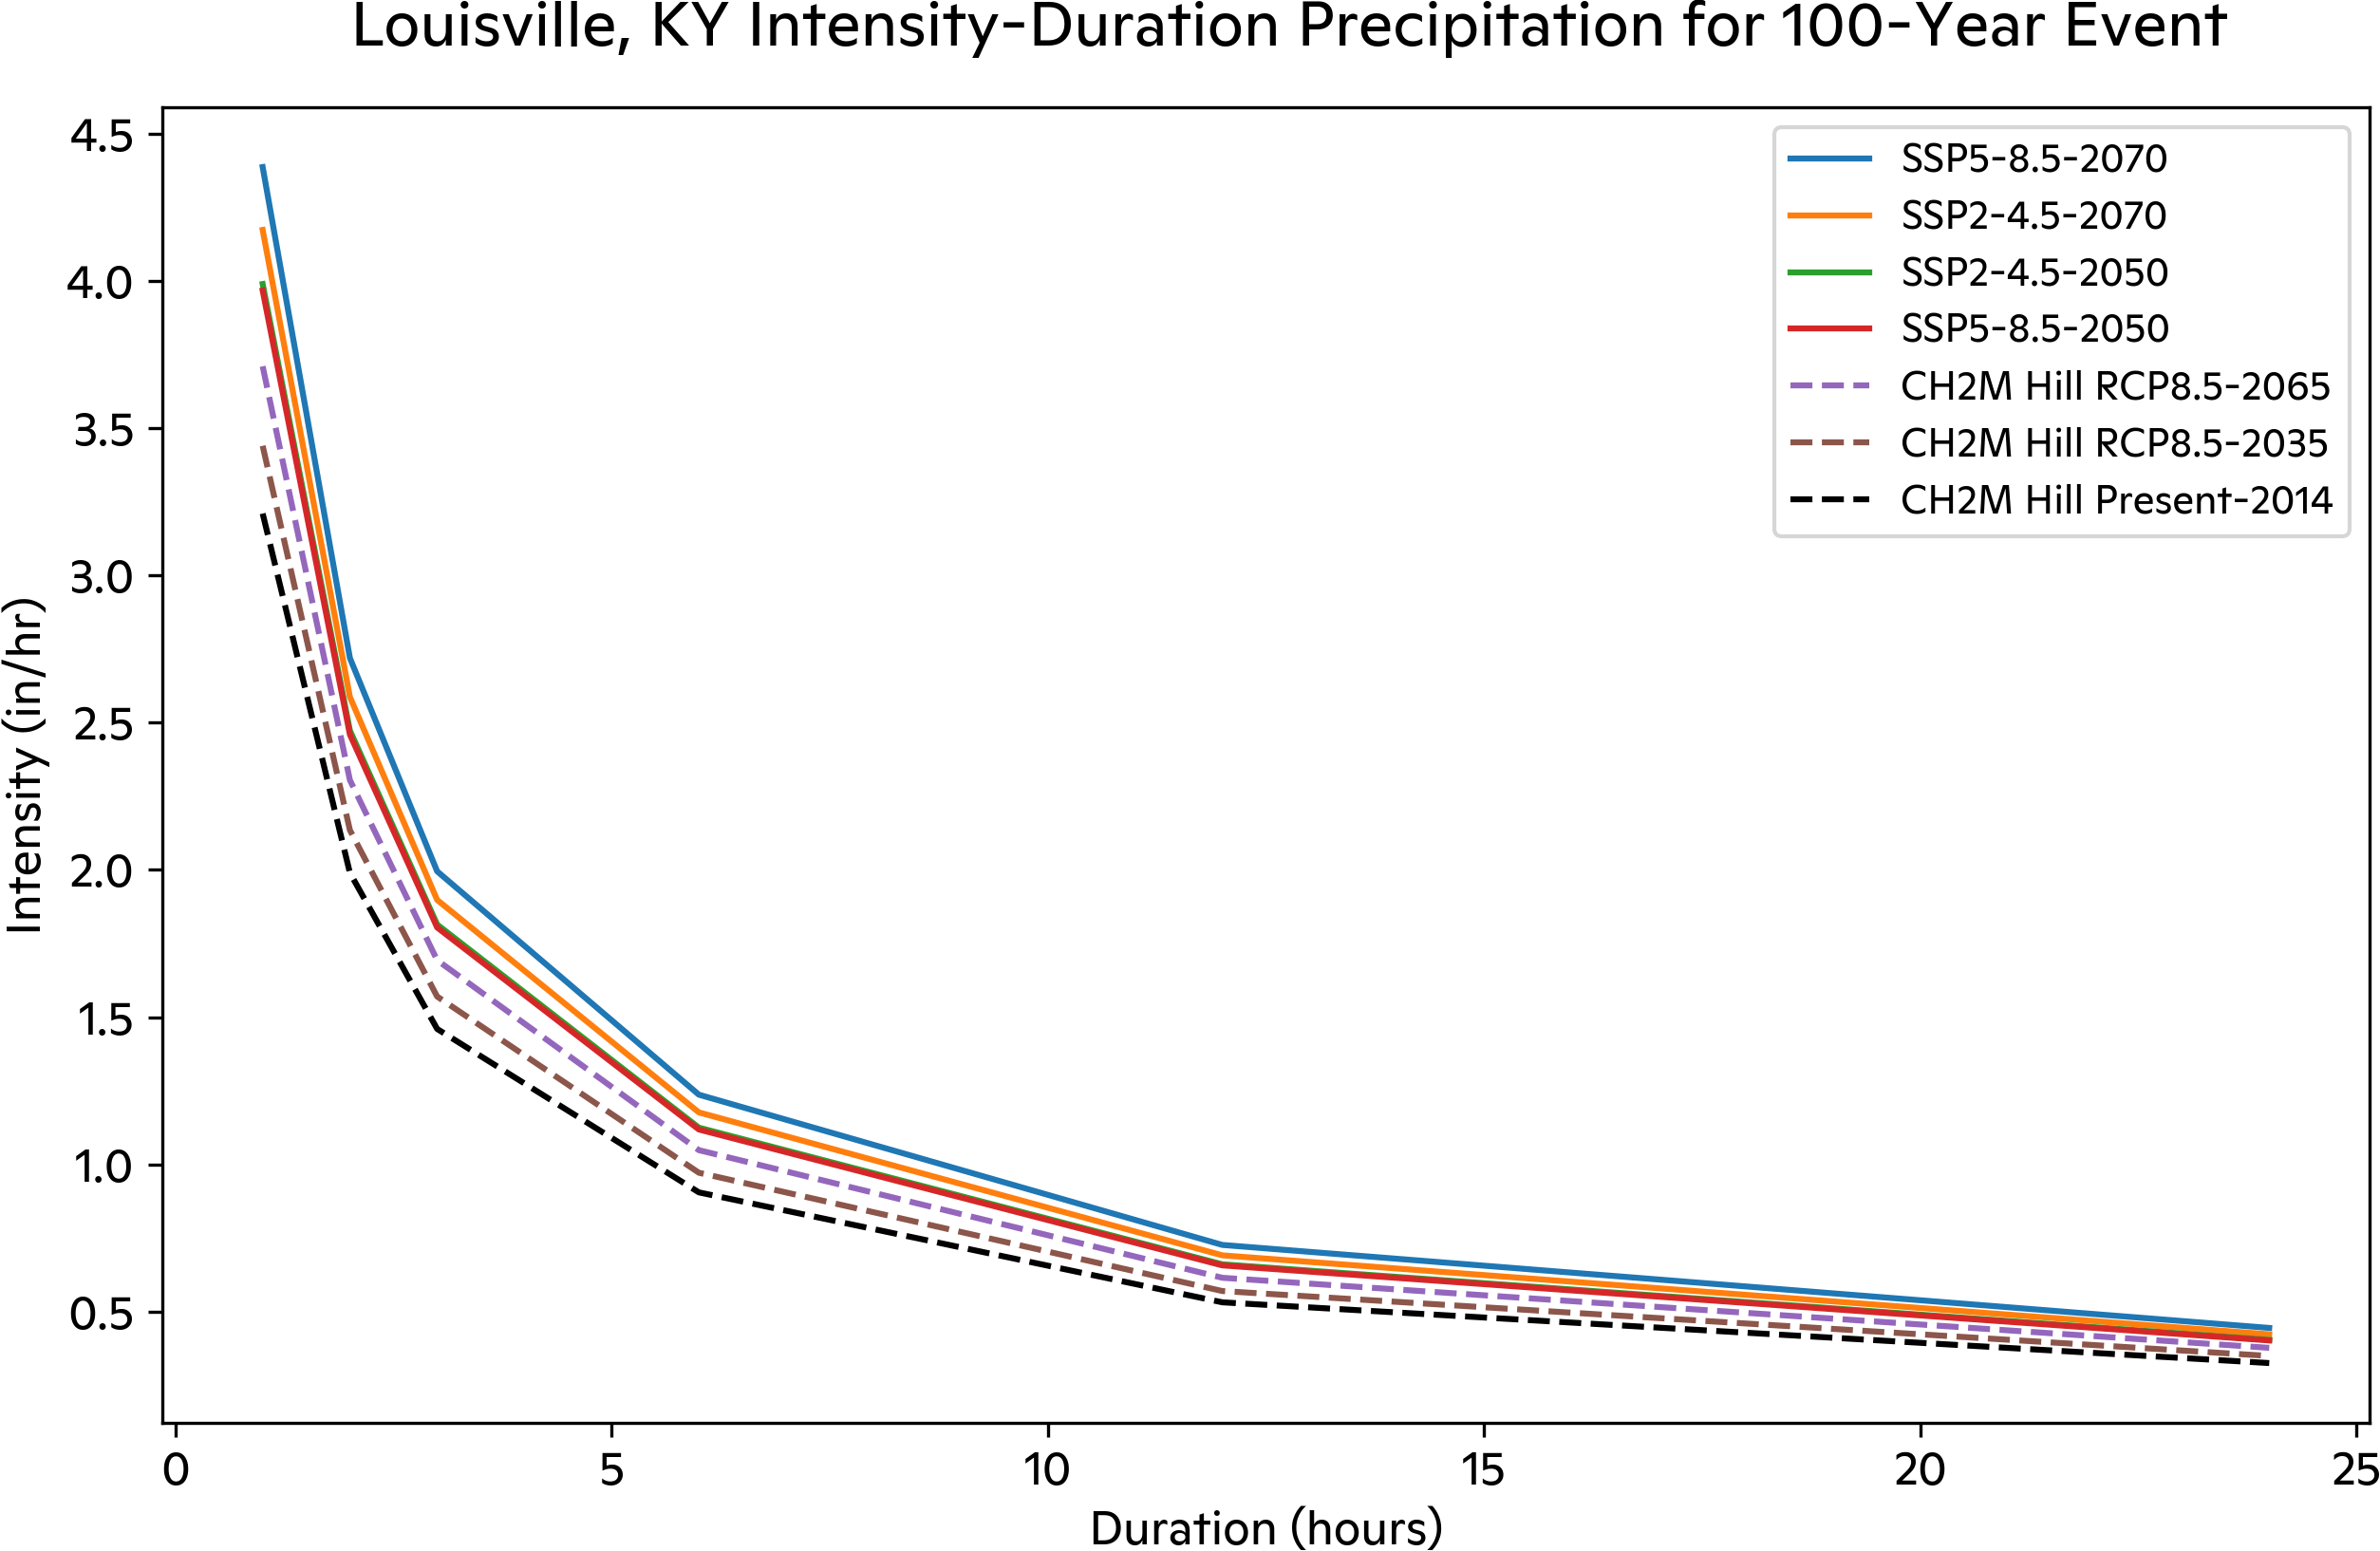
Changes in intensity-duration curves are expected to follow similar intensifications. The largest shifts in intensity are expected to be at lower durations as shown in Figures 3 and 4. For the 1-hour 10-year event, rainfall intensity is expected to reach 2.5 inches per hour by 2050 and 2.6 inches per hour under SSP2-4.5 and 2.8 inches per hour under SSP5-8.5, respectively, by 2070. In comparison, the current 1-hour 10-year intensity is 2.1 inches per hour and CH2M Hill projects 2.3 inches per hour by 2065 under RCP8.5. The intensity-duration curves are expected to shift similarly for the 100-year event.