| Scenario | Changes in 100-yr, 24-hr PFEs | Changes in all PFEs (2- to 500-yr, 1- to 24-hr) |
| Min–Max (Mean) | ||
| SSP2, QS | 3.0%–15.3% (10.4%) | 0.6%–8.4% (4.9%) |
| SSP2, NS | -5.6%–2.7% (-0.2%) | -5.7%– -0.3% (-2.8%) |
| SSP5, QS | 2.3%–14.5% (9.4%) | -0.6%–6.6% (3.4%) |
| SSP5, NS | -7.1%–1.2% (-1.7%) | -6.8%– -1.6% (-4.0%) |
Climate Risk Assessment: Pima County, Arizona
The impacts of climate change on the frequency and severity of physical hazards have already put communities at significant risk. As the threat of climate change intensifies, the need for accessible information, tools, and expertise to support climate-resilient decision making grows more urgent. From local communities to entire countries, effective planning and response are crucial. Woodwell Climate Research Center (Woodwell) collaborates with local government leaders to tailor and localize climate risk assessments. Despite the critical importance of this information for informed planning decisions, it remains largely inaccessible to many local government leaders. Woodwell advocates for the free and widespread availability of this vital science. To bridge this gap, Woodwell partners with communities worldwide, including Pima County, Arizona, providing comprehensive community climate risk assessments at no cost.
Overview
Tucson, the population center and county seat of Pima County, experienced its third-warmest year on record in 2023.1 The July 2023 monthly average temperature was 94.2°F, a whole 6.0°F above normal, making it not only the hottest July, but also the hottest single month on record. The city experienced 18 days with temperatures ≥ 110°F, breaking the old record of 10 days. A historic 53-consecutive-day streak of daily temperatures ≥ 100°F occurred between June 16 and August 7; the old record was 39 consecutive days. In addition to 2023’s record-breaking heat, the monsoon season started late and exhibited below-average rainfall, resulting in the spread of moderate to extreme drought across much of Pima County by the end of 2023.
As a result of climate change, the trend of increased extreme heat and drought in Pima County is expected to continue. Additionally, the frequency of extreme-rainfall events can be expected to rise, resulting in precipitation occurring on fewer days but in wetter and more intense storms. Negative impacts associated with these climate hazards will be disproportionately distributed across the county. Community resilience to extreme heat, drought, and flooding events is influenced by several factors, including income, race, age, health, and proximity to greenspaces and cooling centers. Pima County, the City of Tucson, and Tohono O’odham Nation have been proactive in forming multiple climate change mitigation and adaptation plans, many of which look to combat extreme heat, the urban heat island, water resiliency, and flooding. Pima CAN!,2 Tucson Resilient Together,3 and the Tohono O’odham Climate Change Adaptation Plan (in development) are three such initiatives that seek to increase climate resilience in Southern Arizona with a strong focus on environmental justice. Here we present our findings on extreme heat, precipitation, and drought to help Pima County continue its efforts to create a more resilient and equitable future for its residents.
Heat
Heat-related deaths are at risk of increasing as temperatures rise and extreme-heat events become more frequent and intense with climate change. In 2022, Pima County saw a then-record-high 54 heat-related deaths,4 excluding deaths among undocumented border crossers (UBCs). In 2023, the total number of non-UBC heat-related deaths more than doubled to 126, with 45 of these deaths occurring among unsheltered individuals.5
Additionally, there were 50 UBC heat-related deaths during this time period. Several factors will combine to result in an unequal distribution of increased heat-related deaths across Pima County in the future. The unsheltered, aging, poor, and minority communities will be most negatively impacted, along with those who have pre-existing health conditions or work outdoors. Across Tucson, communities with a higher population of Latinos and/or lower-income individuals already experience temperatures that are hotter than the citywide average due to decreased tree cover and increased impervious surfaces.6 Several citywide initiatives, such as Million Trees Tucson and Storm to Shade, have been implemented to combat extreme heat by increasing tree cover and shade equity across Tucson.
To analyze future changes in extreme heat for Pima County, we examine how often current levels of heat stress will be exceeded. This uses the 95th-percentile daily maximum temperatures7 from a 2000–2020 baseline period, along with the number of days expected to exceed this extreme-heat threshold in mid-century (2040–2060) (Fig. 1). During the baseline period, the hottest 5% of days—about 18 days per year—exhibited maximum temperatures at or above the extreme-heat thresholds depicted in Figure 1(a). These thresholds range from 82°F in the peaks of the Santa Catalina and Rincon Mountains to 110°F in the far northwest corner of Pima County. The baseline extreme-heat threshold for Tucson is 106°F. By mid-century, the number of days estimated to exceed baseline extreme-heat thresholds across the county ranges from 35–45 under an assumed SSP2-4.5 (SSP2) scenario and 45–53 days under the high-emissions SSP5-8.5 (SSP5) scenario (Fig. 1(b), (c)). Tucson is estimated to experience 40–50 days (SSP2 and SSP5, respectively) exceeding the baseline threshold, a 122–178% increase in extreme heat compared to the baseline 18 days. In other words, the maximum temperatures experienced in Tucson during the hottest 5% of 2000–2020 are expected to be met or exceeded 11–14% of the time in 2040–2060.
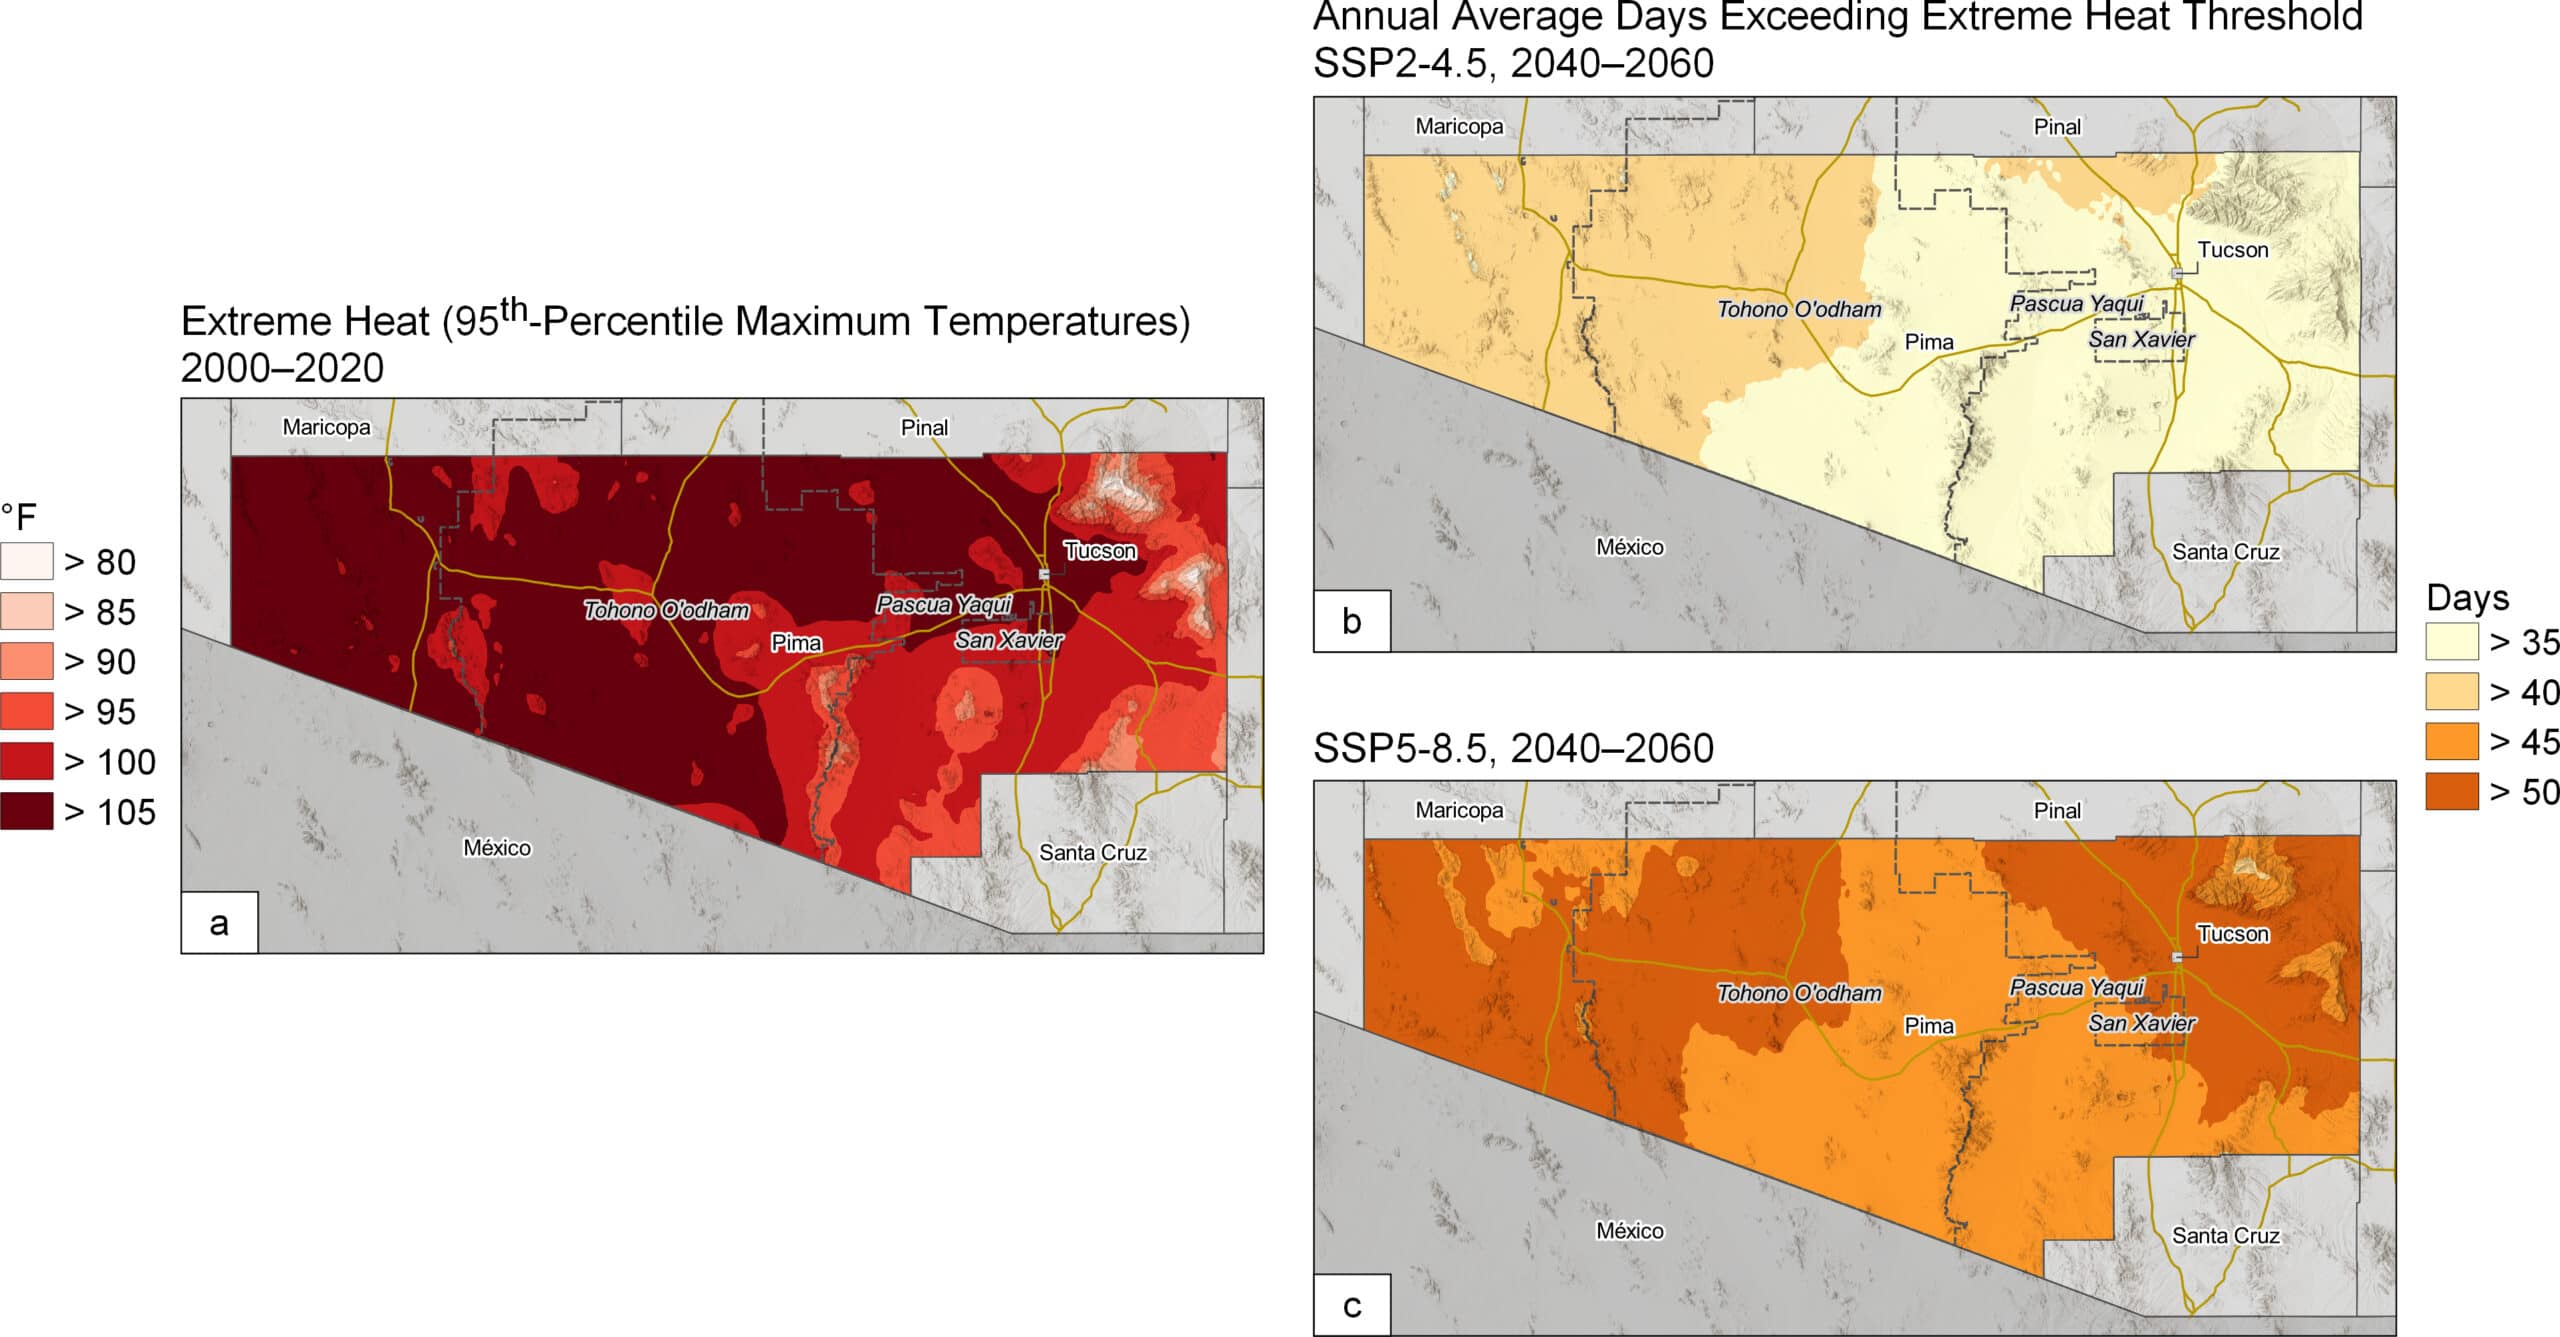
Figure 1. Extreme heat (95th-percentile maximum temperatures) and days exceeding extreme-heat threshold. (a) Extreme-heat temperature thresholds for 2000–2020, (b) Annual average days exceeding historical extreme-heat threshold, 2040–2060, SSP2, (c) Same as (b) but for SSP5.
Heat danger days, defined as days when the heat index (combined temperature and humidity) result in a “feels like” temperature of 103°F or higher, represent a level of heat stress where heat exhaustion is likely and heat stroke is possible for anyone engaging in physical activity outdoors.8 The heat index is measured in the shade—in direct sunlight it can feel up to 15°F hotter. The frequency of heat danger days is set to rise across Pima County as the climate warms. In 2000–2020, the number of heat danger days ranged from zero in the Santa Catalina and Rincon Mountains to 60 in the northwest part of Pima County (Fig. 2(a)). In 2040–2060, central Tohono O’odham Nation and northwestern Pima County could see 90–100 (SSP2 and SSP5, respectively) annual average heat danger days (Fig. 2(b), (c)). Tucson saw around 28 heat danger days per year during the baseline period, and could expect between 66–82 such days per year by mid-century, a 135–193% increase, or roughly 1–2 additional months of dangerous heat annually.
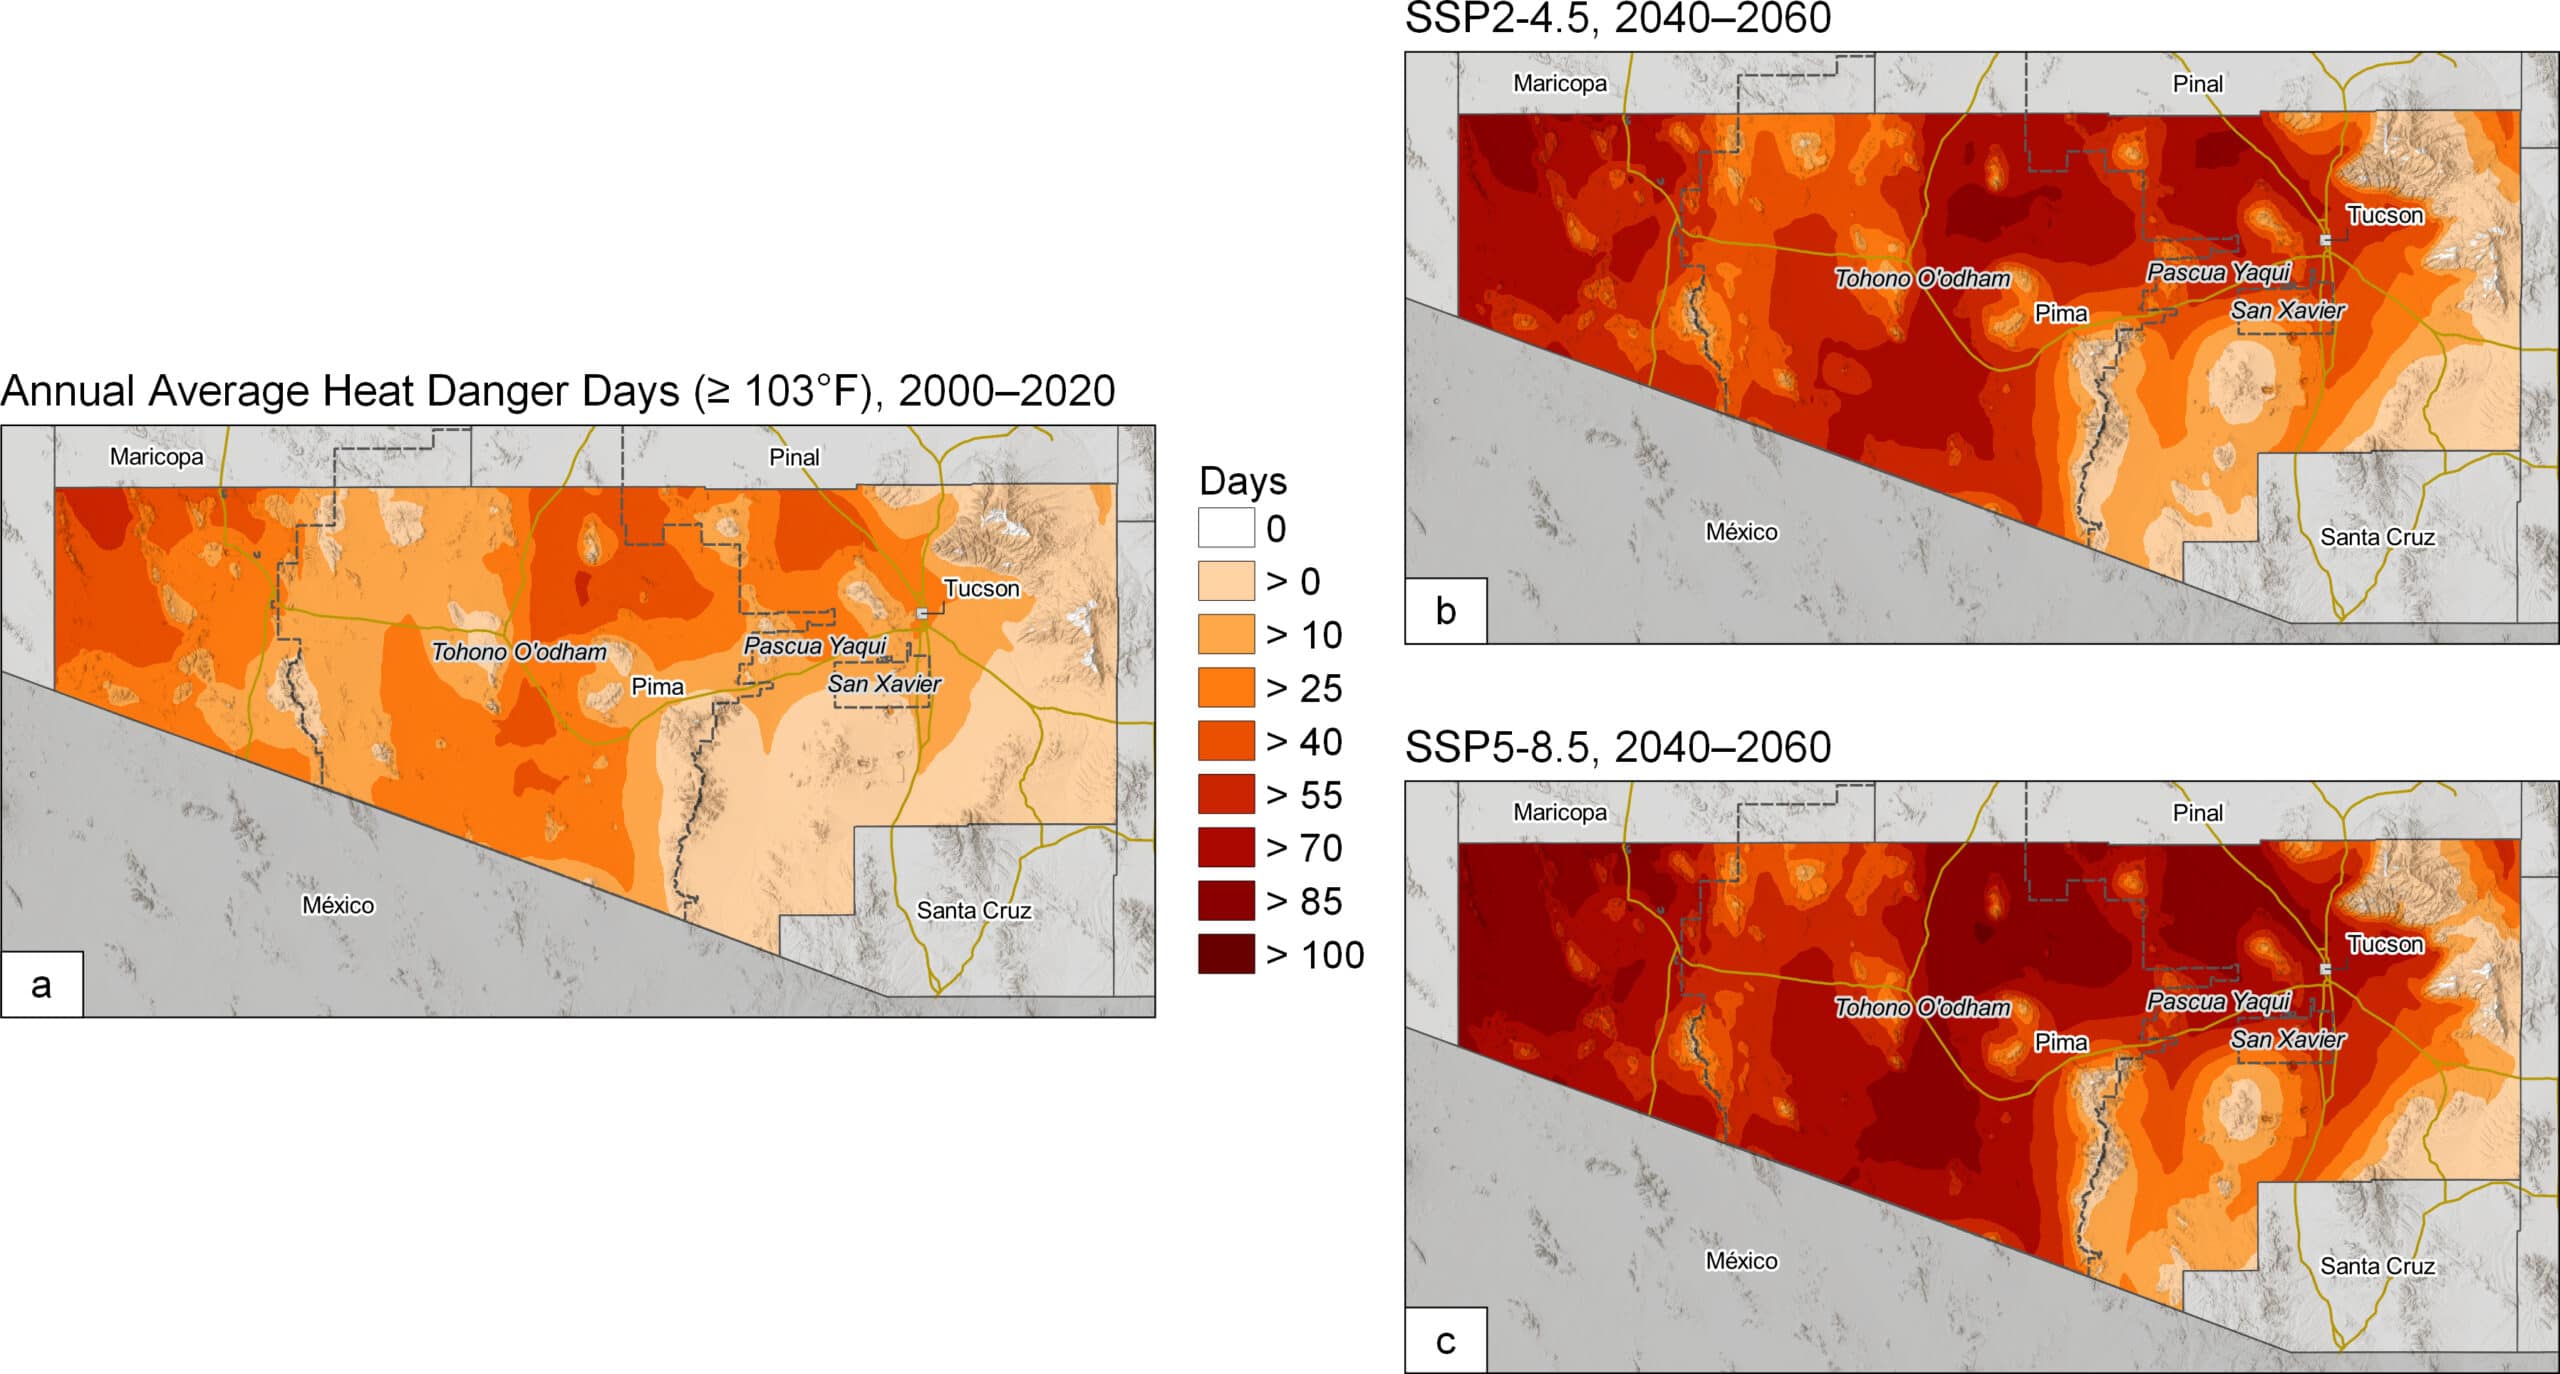
Figure 2. Heat danger days. (a) 2000–2020, (b) 2040–2060, SSP2, (c) 2040–2060, SSP5.
It is important to note that increased temperatures associated with the urban heat island effect are not factored into climate model temperature data, so actual temperatures could be even hotter than projected in the above figures, specifically within urban neighborhoods with low tree canopy and high concentration of buildings, concrete, and asphalt.
Drought
Drought represents a temporary negative anomaly in water balance conditions. 9 Here we show results for extreme drought, which is defined as an event with a less than 10% chance of occurring during 2000–2020, the baseline period. In 2040–2060, under a SSP2 scenario, virtually the entirety of Pima County will experience a 10–15 percentage-point increase in extreme drought relative to the baseline (Fig. 3(a)). Under the high-emissions scenario SSP5, the chances of extreme drought are even higher, with a 15–25 percentage-point increase relative to baseline (Fig. 3(b)). This means that by mid-century, Pima County can expect to experience extreme drought between 20–25% of the time under the SSP2 scenario and 25–35% of the time under SSP5.
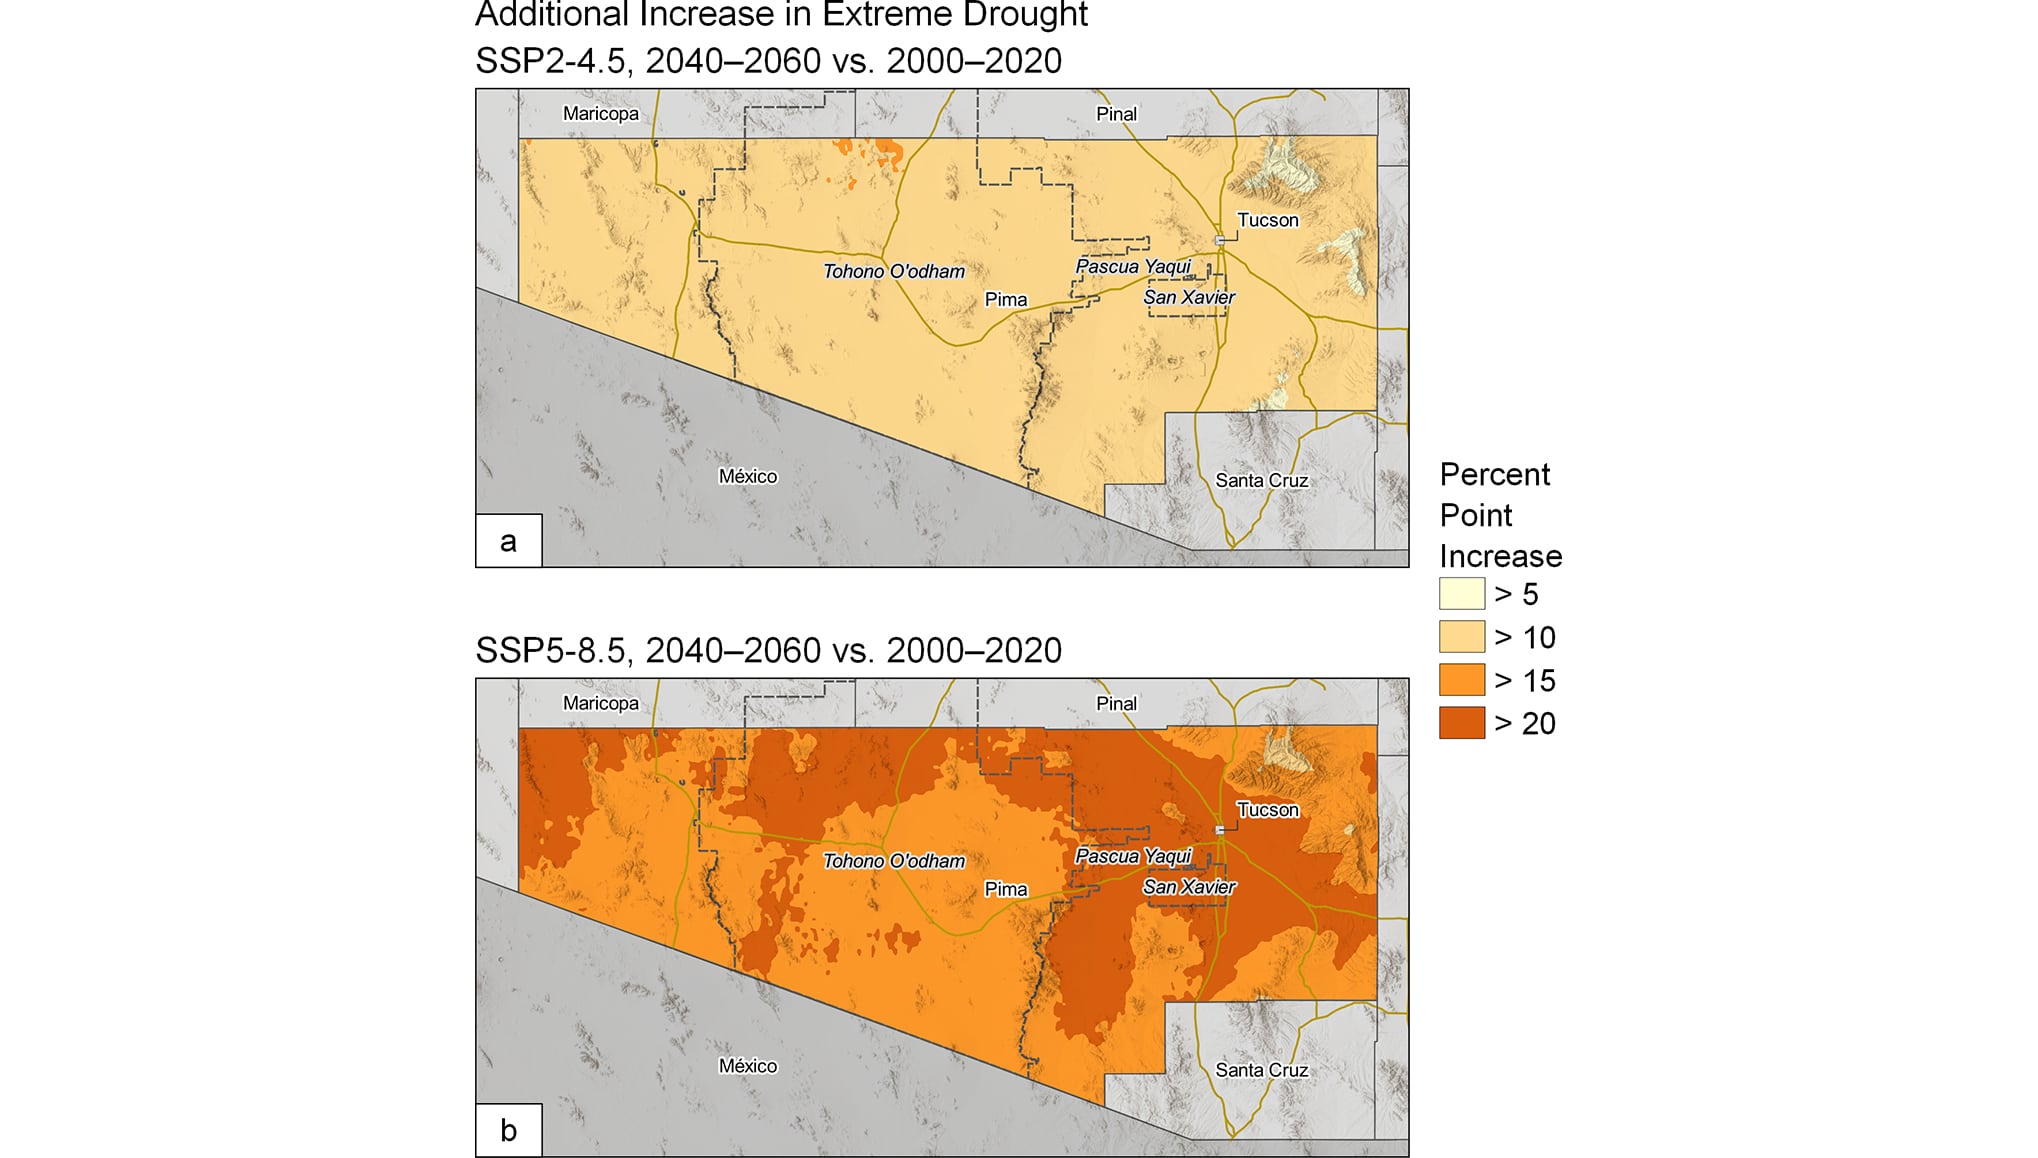
Figure 3. Additional increase in extreme drought relative to baseline period (2000–2020) by 2040–2060. (a) SSP2. (b) SSP5.
Having experienced groundwater shortages during a dry period in the 1970s, the City of Tucson now has one of the longest-running water conservation programs in the United States.10,11 While population has risen by more than 200,000, Tucson is still using the same total amount of water as in the mid-1980s through various methods including low-water appliance rebates, low-income incentive programs, rain- and greywater installations, reclaimed water use, and grass removal. Tucson has also recently developed One Water 210012 to further expand water-saving and reuse efforts. While the annual average rainfall for Tucson is only about 11 inches, this equates to more water than annual city-resident municipal-water consumption.13 Therefore, keeping rainwater local through the expansion of Green Stormwater Infrastructure and rainwater harvesting will be key to securing the city’s water future. With future projected increases in drought and Colorado River water restrictions, it will be crucial for Pima County and the City of Tucson to continue working with regional partners throughout the Colorado River Basin and the Southwest to ensure an equitable, sustainable, and safe water future for everyone.
Extreme Precipitation
While Pima County can expect to experience drought more frequently in the future, the region can also expect an increase in extreme-precipitation events. This means that the average number of days with precipitation can be expected to decrease while the storms that do occur will be wetter and more intense in nature. To determine future changes in precipitation for Pima County, we provide updates to current NOAA Atlas 14 (NA14) Precipitation Frequency Estimates (PFEs),14 which cities use to inform their design storm policies.15,16 Design storms are specific rainfall events that cities use to plan and build stormwater infrastructure. We present results pertaining to changes in future PFEs using two approaches, referred to as quasistationary (QS) and nonstationary (NS) methodologies (Fig. 4).17
In our QS approach, precipitation estimates were calculated for two different time periods, the baseline (1975–2004) and future (2025–2054), where each period is treated as stationary. In the NS approach, precipitation estimates are calculated for the entire time series (i.e., 1971–2100) using radiative forcing for each SSP scenario to represent changes in extreme precipitation through time. Both analyses are performed on a time series consisting of each year’s largest daily precipitation event. The analysis was conducted for each of 19 climate models for two different scenarios (SSP2 and SSP5), and the ensemble mean was compared to the NA14 upper 90% confidence interval (CI) PFEs.
Figure 4 depicts current NA14 upper 90% CI PFEs for Eastern Pima County (EPC) for the 100-year, 24-hour event, alongside our QS and NS results for SSP5 for the future time period. The difference in PFEs between Woodwell results and the NA14 upper 90% CI are also presented. The QS approach estimates up to 0.8 inches more rainfall than the NA14 upper 90% CI precipitation estimates across EPC. The NS approach projects increased extreme precipitation compared to the NA14 mean value, but virtually no change compared to the NA14 upper 90% CI. This can be seen in Figure 2(e) where the difference ranges from -0.05 to zero inches across the region. The smaller increase estimated by the NS method is largely due to the shape parameter remaining fixed throughout the 1971–2100 time period.18 Similar differences between the QS and NS methods were found in the NOAA report15 where the QS method projects greater increases in extreme precipitation than the NS method for the Northeastern United States.
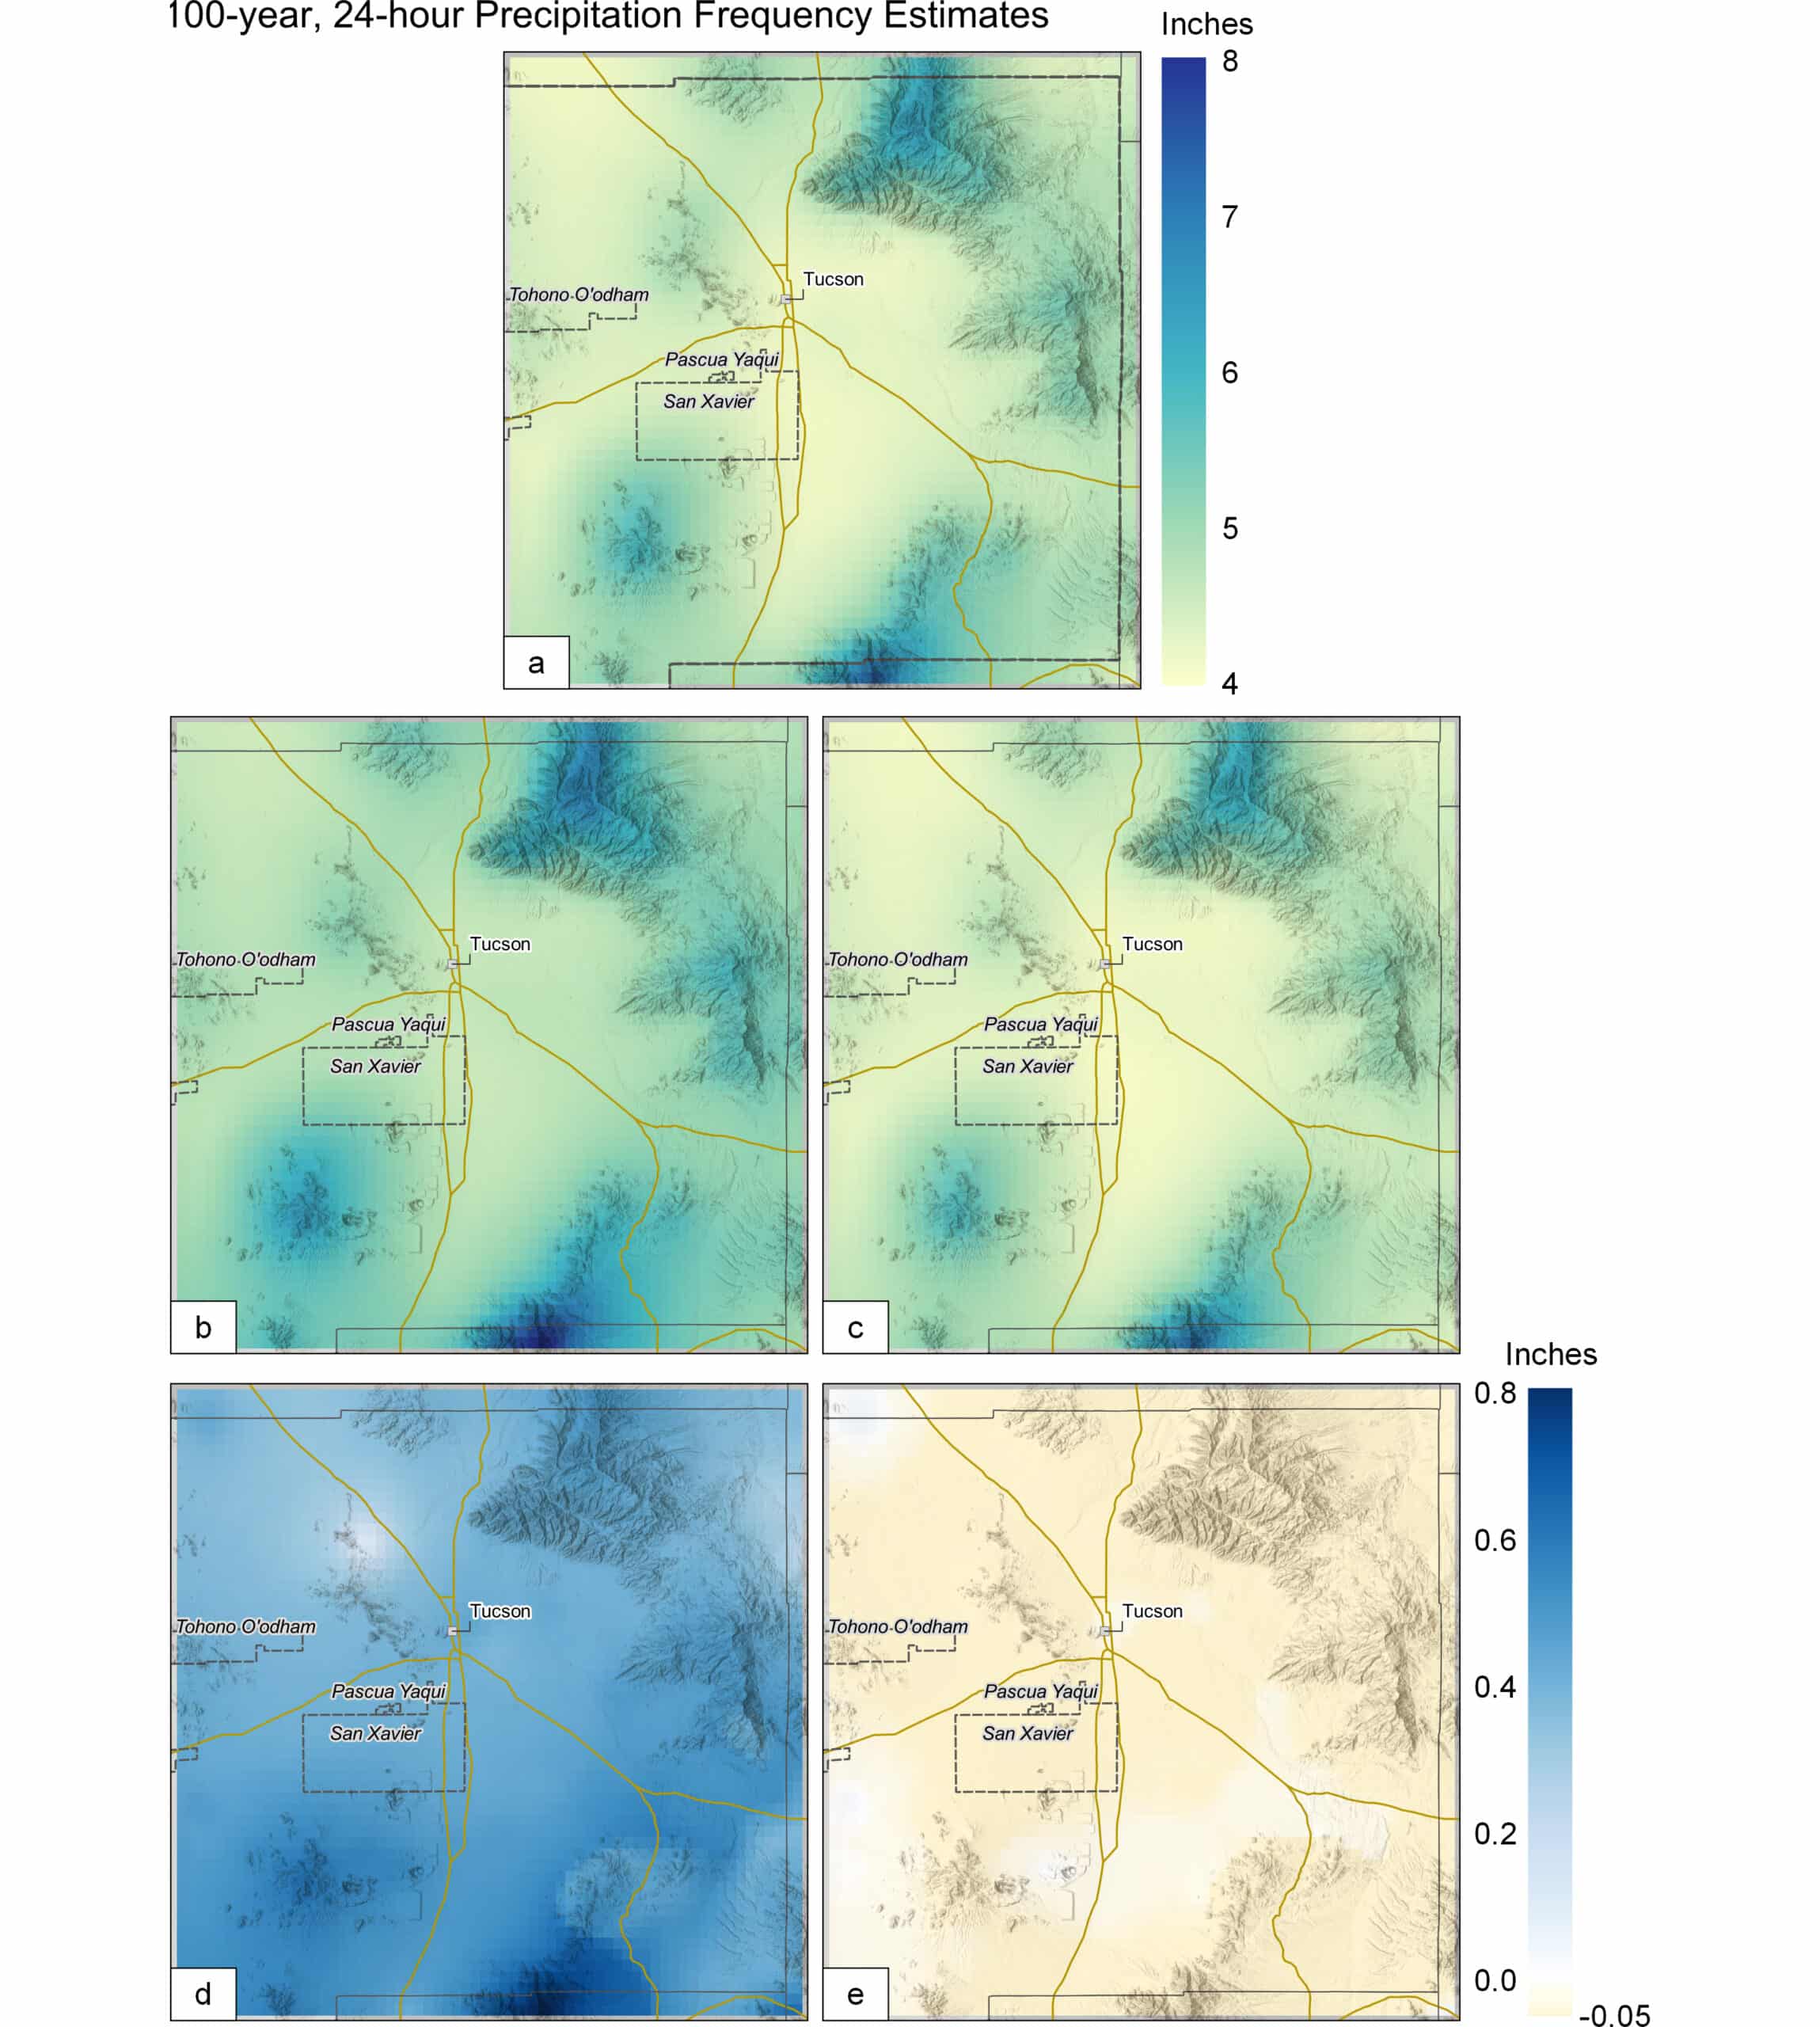
Figure 4. 100-year, 24-hour precipitation frequency estimates (PFEs) and difference plots. (a) NA14 upper 90% confidence interval, (b) SSP5 QS, (c) SSP5 NS, (d) Difference of (b)-(a) (future-projected QS results minus NA14 upper 90% CI), (e) Difference of (c)-(a) (future-projected NS results minus NA14 upper 90% CI).
Precipitation depths were evaluated for multiple return periods (2, 5, 10, 25, 50, 100, and 500 years) and time durations (1, 2, 3, 6, 12, and 24 hours). Figure 5 depicts the QS and NS future-estimated 24-hour rainfall depths for each return period for Tucson International Airport, compared to NA14. Results reveal very similar 24-hour rainfall totals between both scenarios (SSP2 and SSP5) for all return periods among each respective approach (i.e., QS and NS), suggesting that the differences in climate change assumptions between the two scenarios ultimately have little influence on extreme precipitation for this location and future time period. Additionally, the annual maxima of the climate models for this region could contain more noise (interannual variability) than signal (climate warming) resulting in very similar results between scenarios. Moreover, available moisture within EPC’s relatively dry climate may be an additional factor in the similarity between the SSP scenarios. The future-projected NS rainfall depths track closely with the NA14 upper 90% CI for SSP2 and SSP5. While NS results are lower than the QS results, they still represent an increase in future extreme precipitation, signifying that the current NA14 upper 90% confidence bound rainfall for each return period could become the new mean rainfall for each return period.
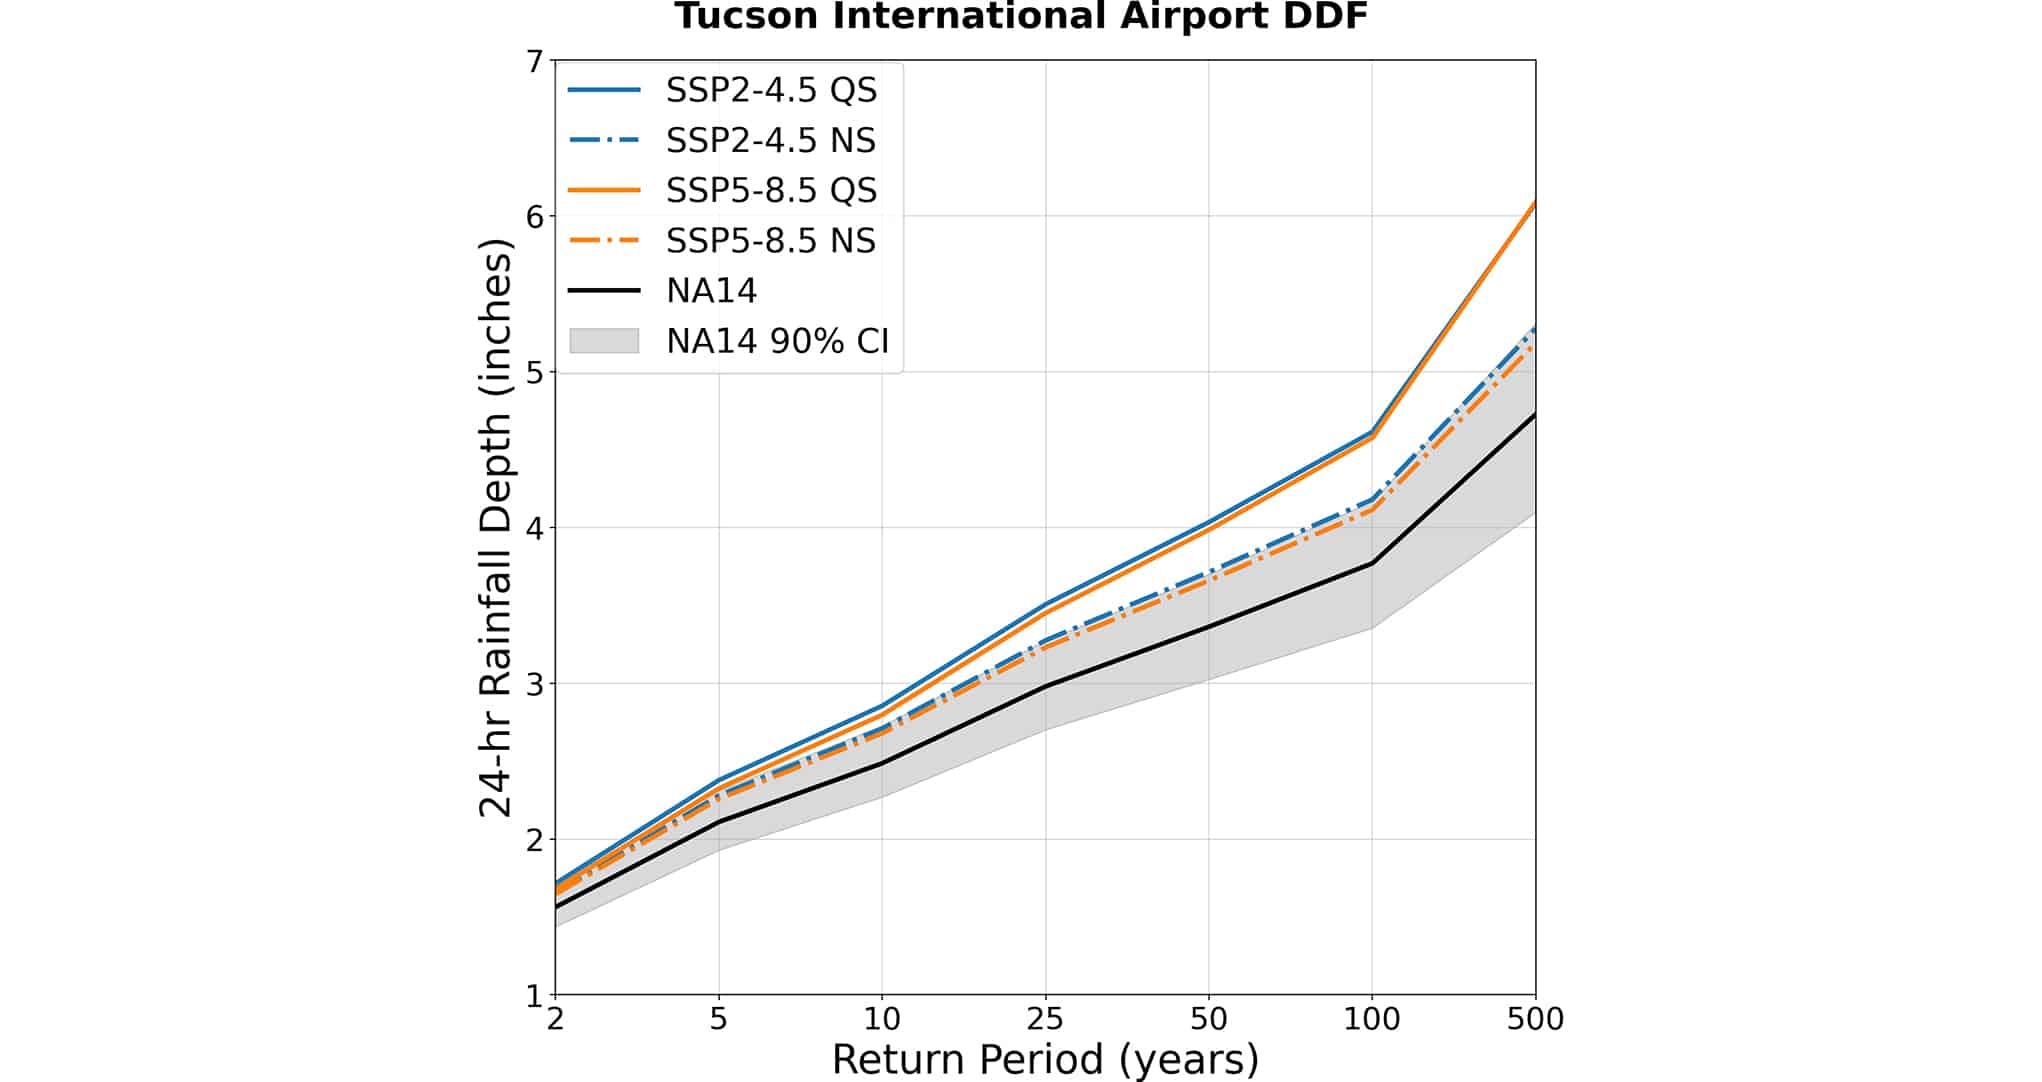
Figure 5. Future-projected Depth-Duration-Frequencies (DDFs) for 24-hour rainfall at Tucson International Airport.
Figure 6 depicts QS and NS future-estimated rainfall intensities (inches per hour) for each return period and time duration at the Tucson International Airport for the SSP5 scenario. Rainfall intensity estimates are fairly similar between both approaches for the 2-year return period across time durations, and diverge as the return period increases and time duration decreases.
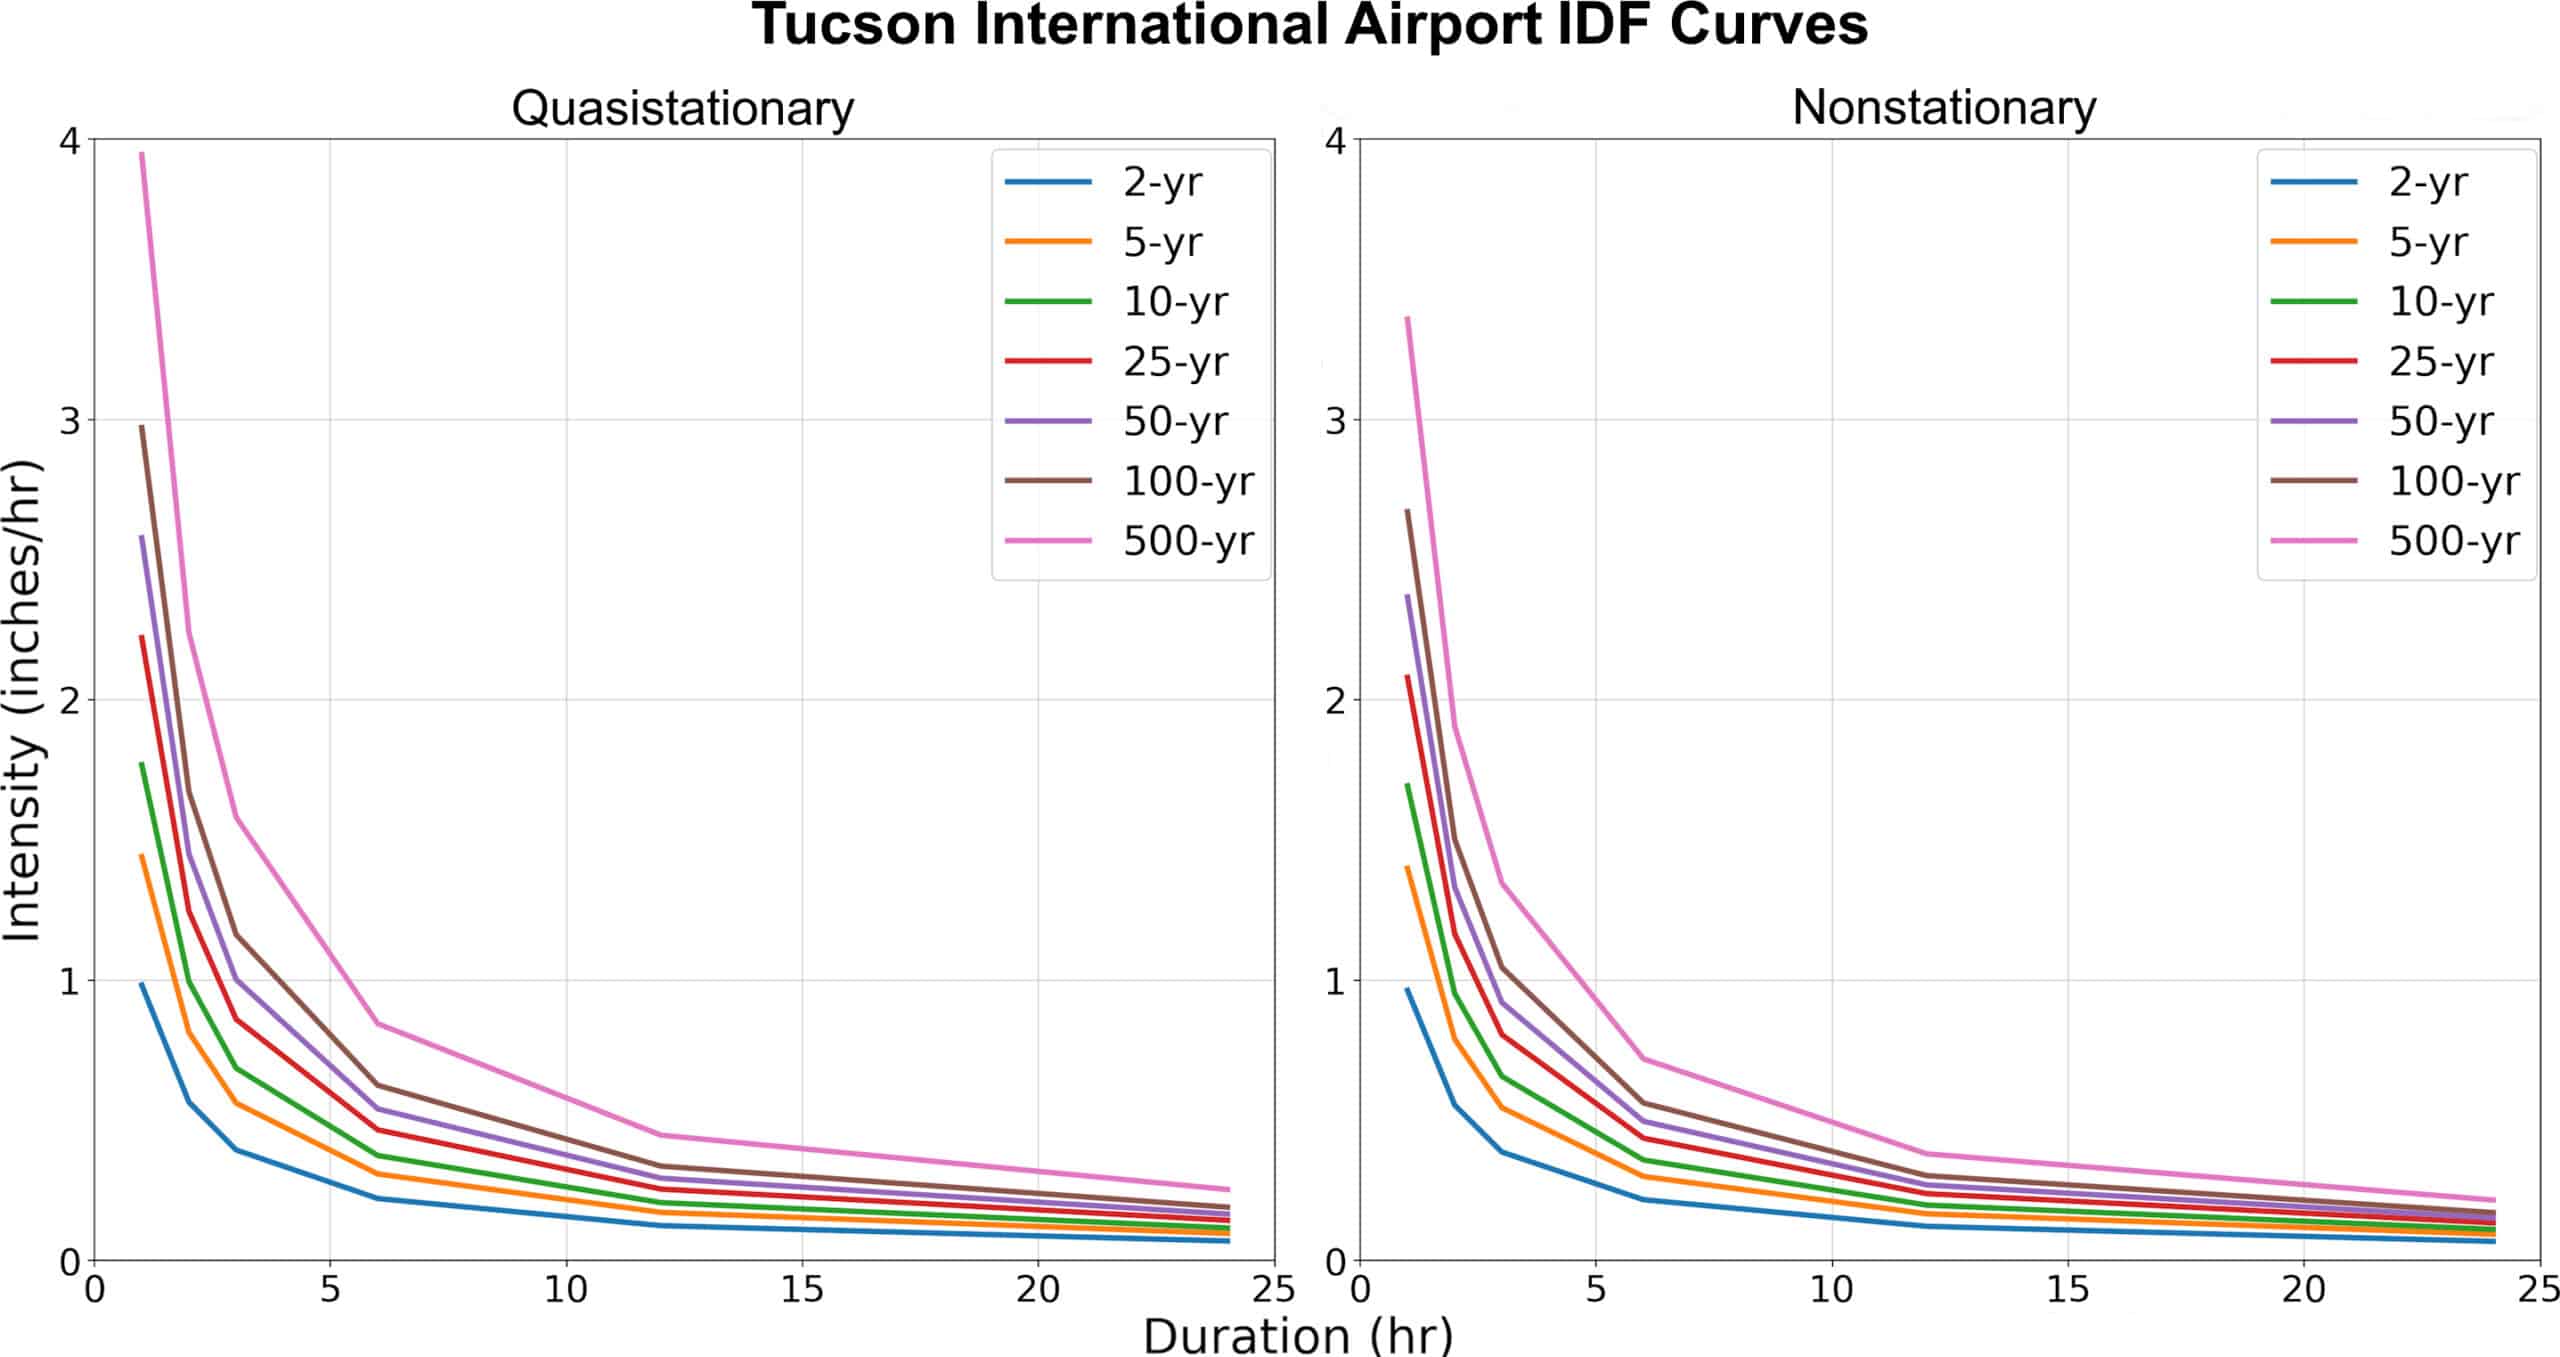
Figure 6. Future-projected Intensity-Duration-Frequency (IDF) curves at Tucson International Airport, SSP5. (a) QS, (b) NS.
A summary of the percent-change (compared to the NA14 upper 90% CI) in QS and NS future-estimated PFEs for both scenarios across EPC are summarized in Table 1. Across both scenarios, Woodwell QS results show an average of 9.9% additional rainfall above NA14 upper 90% CI totals for the future-estimated 100-year, 24-hour event. Additional increases in rainfall amounts range from as small as 2.3% to as large as 15.3% across EPC. The Woodwell NS approach projects 0.95% less rainfall than the NA14 upper 90% CI for the 100-year, 24-hour event for EPC when averaged across both scenarios. Percent-changes averaged over all return periods and time durations are also provided in the Table, with the QS approach estimating an average 4.15% more rainfall than the NA14 upper 90% CI. The NS approach estimates an average 3.4% less rainfall than the NA14 upper 90% CI across all return periods and time durations.
Table 1. Percent change in future-projected PFEs vs. NA14 upper 90% CI over Eastern Pima County.
Rainfall depths for each time duration for the 100-year event at Tucson International Airport are presented in Figure 6. Values for current NA14 and NA14 upper 90% CIs are included, as well as Woodwell future-projected QS and NS rainfall totals for both SSP2 and SSP5.
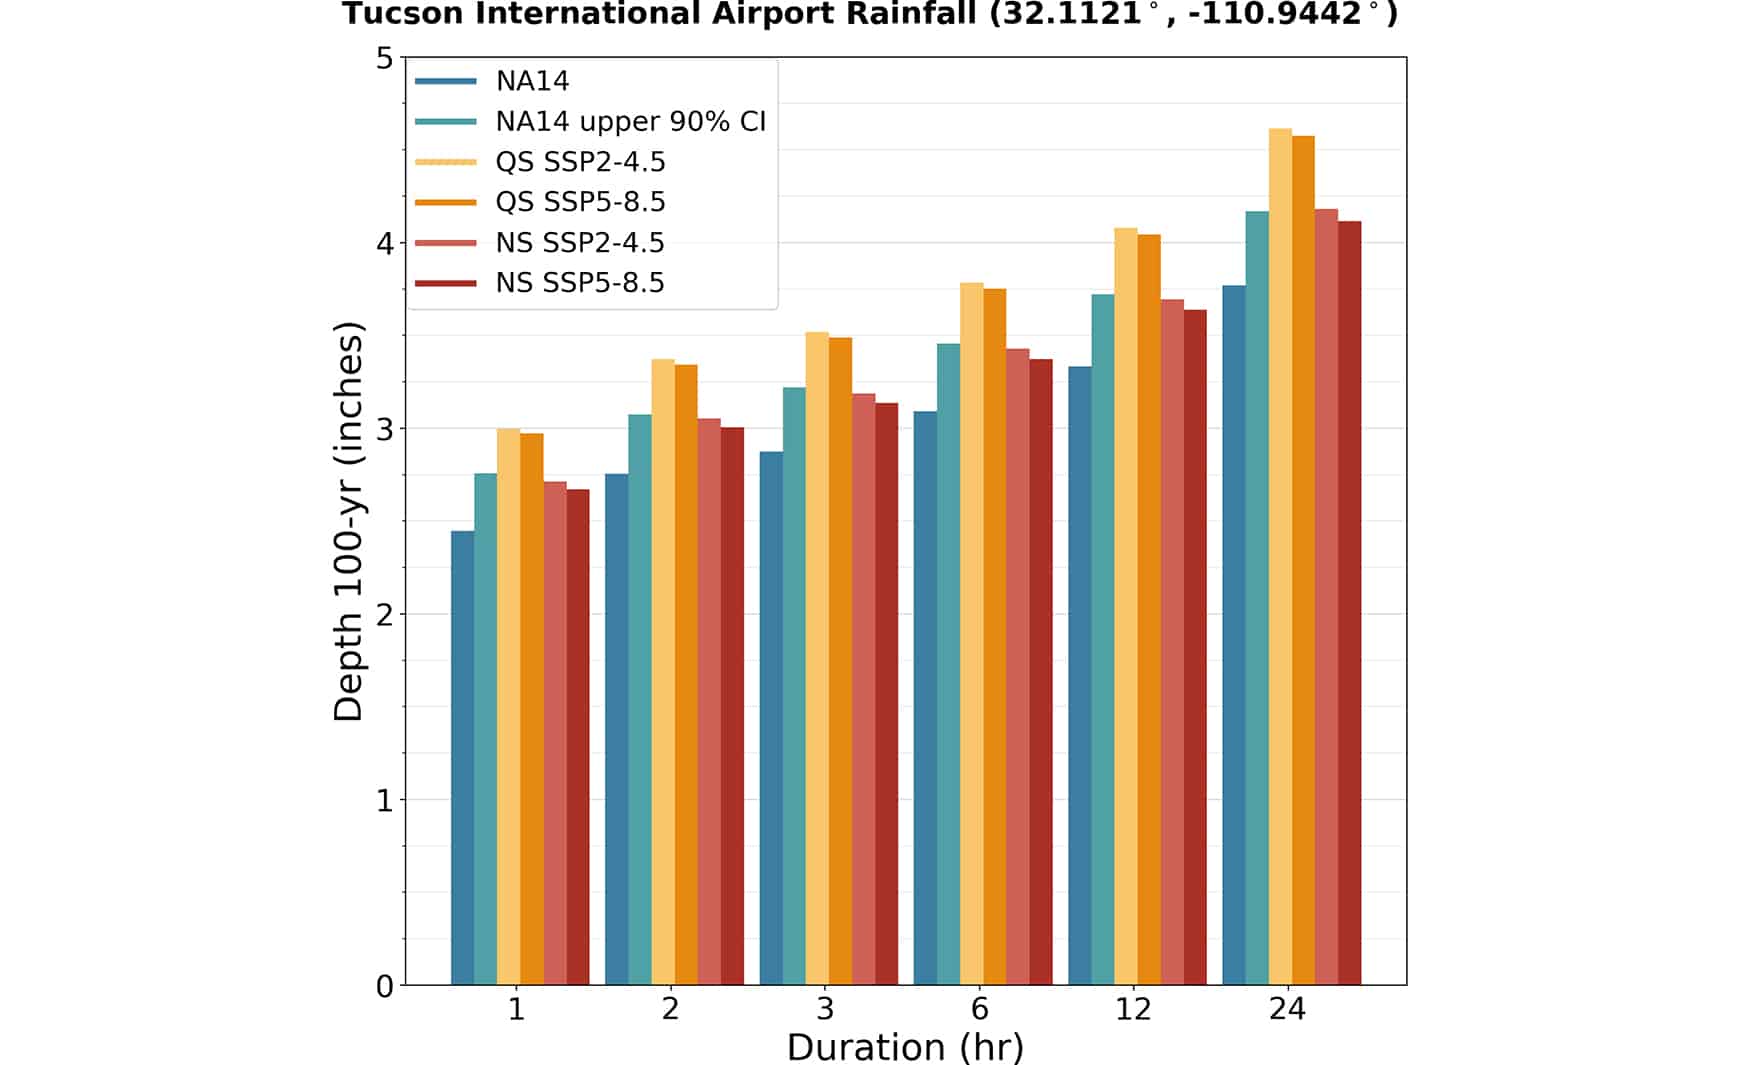
Figure 7. Rainfall depths (in inches) for the 100-year event for multiple time durations at Tucson International Airport.
Finally, we discuss the policy and planning implications of the differences between the QS and NS results. Pima County currently uses the NA14 upper 90% CI for flood control management. The NS method finds that mean future extreme precipitation will be essentially equivalent to current NA14 upper 90% CI estimates by 2050, while the QS analysis found evidence of extreme rainfall amounts greater than the current NA14 upper 90% CI by 2050. Based on these findings, Woodwell recommends increasing the current design storm amounts utilized by the Pima County Regional Flood Control District. Recommending the appropriate design storm amounts is beyond the scope of this work.
One method to utilize the differences of these two analyses is to view them as a model ensemble. Using an ensemble of climate models is commonly done to account for modeling uncertainty. Similarly, the QS and NS results can be thought of as a range of outcomes and implemented as such. For more risk-averse applications, the upper bound, QS, could be used, while for less risk-averse applications, the lower bound, NS, could be used. Additionally, the average of QS and NS can be used to incorporate information from both analyses into resilience planning. Flood defense infrastructure is generally utilized for decades past its expected lifetime. To accommodate changes in extreme precipitation beyond 2050, using the upper range of future extreme precipitation projections is a prudent approach for flood risk planning.
Hard-packed desert soil, asphalt, and other impervious surfaces commonly lead to localized flooding during extreme-precipitation events in Tucson and other areas of Pima County. In fact, some of Tucson’s busiest streets were designed to become temporary streams that direct stormwater to rivers and arroyos.19 In the face of continued drought coupled with the likelihood of increased extreme-precipitation and flooding events, local efforts are working to better utilize this stormwater by keeping the water in the region through reclaimed water programs, river restoration projects, and groundwater recharging. Tucson’s Storm to Shade3 program aims to reduce flooding by diverting water from roads and parking lots via Green Stormwater Infrastructure (GSI), such as basins filled with mulch, native trees, and other vegetation. These GSI practices are not novel to the region; they align with the traditions of the Indigenous Hohokam who inhabited the region roughly 500–2,000 years ago, and their descendants, including the Tohono O’odham, who reside in southern Arizona and northern Mexico.20 Continued expansion of these GSI practices, along with updates to design storm policy, are important climate adaptation strategies Pima County can take to limit property damage and other negative economic impacts associated with increased risk of extreme precipitation in the future.


