Flooding is a hallmark of the climate-changed world. Rising sea levels, extreme rainfall, and aging infrastructure systems have left communities across the U.S. facing increasing damages from flooding, making flood insurance an expensive necessity for more and more Americans.
But U.S. flood insurance policy was created on the assumption of a more stable and predictable climate and has struggled to keep up with the rapid pace of change. Two new papers led by Research Associate, Dominick Dusseau shine a light on vulnerabilities within the American flood insurance system that will only be exacerbated as climate change advances.
You may be paying for your neighbor’s discount
The National Flood Insurance Program (NFIP), a program of the Federal Emergency Management Agency (FEMA), was created to help property owners secure affordable flood insurance and encourage communities to manage their flood risk.
One of the ways the NFIP encourages floodplain management is through the Community Rating System. The system rewards communities with discounts on their premiums for implementing certain actions. These actions range from building up the elevation of ground within a floodplain to making local flood maps publicly accessible. Actions are assigned points and the number of points determines how much of a discount the community will receive.
This reduction in price is not a true discount however, because the NFIP adjusts state-wide premiums to make up the difference. The NFIP calculates the average percentage discount for the entire state and increases all premiums by that amount. This means policyholders in towns that are not even participating in the Community Rating System may be paying more than their risk level requires to subsidize their neighbor’s discounts.
“It’s basically a way for the NFIP to actuarially pay for the Community Rating System,” says Dusseau. “Because otherwise they’d be foregoing that revenue from the discounts. To recoup the lost income they do this cross-subsidization by putting it back into each policy by state. ”
Climate change will exacerbate inequalities
A study from Dusseau, published in the journal One Earth, shows that through the Community Rating System, roughly half of NFIP policy holders subsidize the discounts of the other half. In theory, subsidization ensures the NFIP is collecting enough revenue to pay out all their future obligations. But in reality, this framework presents two flaws. First, not all Community Rating System actions— publishing flood maps, for example— reduce damages. While the action may be beneficial to community awareness, it doesn’t translate directly to dollars saved.
Additionally, existing disparities between communities result in unequal distribution of the burden of subsidization.
“One of the big takeaways that we found was that it’s largely under-resourced rural counties that are subsidizing the more affluent, well-resourced urban counties,” says Dusseau.
Even though many rural communities would be eligible for discounts themselves, they may not have the capacity available to take advantage of them.
“There’s a bureaucracy involved here. There’s paperwork. You have to document all of these things that you’re doing. You have to submit the application. You need someone that’s a certified floodplain manager,” says Dusseau. “Not every town has that capacity, so it just falls through the cracks.”
This means that already resource-strapped communities may be paying more than required for their true risk level.
Dusseau’s study points out that these inequalities will be exacerbated by climate change. The NFIP has long underpriced policies. The rising sea levels and more extreme precipitation caused by climate change has only widened the gap between the program’s revenue and obligated pay-outs. In 2021, FEMA implemented a new framework, called Risk Rating 2.0, that takes the impacts of climate change to date into account, gradually raising premiums year over year to more closely align with the actual risk of damages.
“And what we see is that states with the greatest level of inequality now will experience even worse disparities in the future,” says Dusseau.
How accurate are flood models?
In addition to inequity, flood insurance suffers from a frustrating lack of transparency, with each company and the NFIP employing a proprietary combination of models to decide premium prices. A second paper led by Dusseau, published in the Journal of Catastrophe Risk and Resilience in February, generates some much needed transparency around the data underlying the insurance industries assumptions.
One type of model employed by insurers is called a catastrophe model. These models can estimate the likely damages from both natural and man-made hazard events like wildfires, terror attacks, and hurricanes. Dusseau’s study evaluated the accuracy of seven flood-specific catastrophe models, including three commonly used by the NFIP.
“Insurers rely heavily on these models that have historically been very ‘black-box’—nearly impossible to evaluate their methods,” says Assistant Scientist Zach Zobel, a co-author on the paper. “Without proper independent review of these models, insurers will continue to misrepresent the risk catastrophes pose on local communities.”
The study found that model accuracy varied widely. Some models overestimated flood losses, while others underestimated losses— by up to 13 times in the most extreme case. This has major implications for the ultimate cost of flood insurance.
“There is a non-trivial difference in the premiums that would be passed on to consumers based on these assumptions,” says Dusseau.
Catastrophe models are also still based upon historical data. Many have not been updated to account for the impacts of climate change, let alone cast forward to how flood risk may change in the future.
“The insurance industry drives using only the rearview mirror. Yesterday’s data to price tomorrow’s risks doesn’t work in a world of more extremes, says Vice President of Science, Dr. Christopher Schwalm who also contributed to the paper. “The past is no longer a reliable guide for the future. To stay ahead, we have to stop guessing based on what happened years ago and start modeling the ‘new extremes’ we are seeing right now.”
Informing policies that protect people
Dusseau along with Woodwell’s risk and policy experts have made science-backed contributions to conversations about improving flood insurance. Dusseau and Senior Policy Analyst Jamie Cummings authored a policy brief last April that advocates for NFIP reforms that help property owners access affordable flood protection, including the creation of a standard national catastrophe model. Dusseau has also briefed congressional staff, highlighting areas where Congress could play a role in bolstering the long-term resilience and insurability of communities.
However, aligning pricing more closely with the realities of climate change is much more complicated—and for many property owners, emotional—than simply incorporating the right data. The increases brought on by Risk Rating 2.0 have already pushed flood insurance out of the range of affordability for many policy holders, forcing them to drop their coverage. The pricing framework is a sticking point in lawmakers’ debates over reauthorizing the NFIP in the long term. The program is currently funded through September 30, 2026.
“How do you balance updating policies to reflect true climate risk with affordability, in a political context? Yes, you want people to know that they’re in a flood zone, but if you price them out of the market, are you really helping them?” says Woodwell Climate Vice President of Policy and Government Relations, Laura Uttley. “That’s why the work Woodwell’s risk team does is so vital. The science and modeling they provide adds context for the development and implementation of new policies. We are very pragmatic about the ways we recommend change.”
Additionally, federal policy changes happen much slower than climate ones, making it a challenge to build policy that is both durable and versatile.
“Policy change at the federal level can be incredibly slow. We need to consider policy proposals that build durable systems that enable adaptability, recognizing the urgency posed by rapidly changing conditions,” says Uttley.
Woodwell Climate has been involved in advocacy around the inclusion of flooding from extreme rainfall— called pluvial flooding— in FEMA’s regulatory maps. These maps identify “flood hazard zones” in which property owners are required to have flood insurance. Currently they only represent coastal and riverine flooding hazards. This has led many property owners to mistakenly believe their homes are not at risk.
Though improved data and transparency might ultimately translate to higher costs for some, Dusseau says the alternative, not knowing, hurts people in the long run.
“If people don’t know that they’re at high risk, they won’t know what to do about it so they won’t do anything about it,” says Dusseau.
Despite a warming climate, disruptive winter cold spells still invade the U.S., and a new study helps explain why. Researchers found that two specific patterns in the stratospheric polar vortex, a swirling mass of cold air high above the Arctic, can steer extreme cold to varying regions of the country. One pattern drives Arctic air into the northwestern U.S., and the other into central and eastern areas. Since 2015, the Northwest has experienced more of these cold spells owing to a shift in stratospheric behavior tied to a warming climate – more proof that what happens in the Arctic doesn’t stay in the Arctic.
As winters in the United States continue to warm on average, extreme cold snaps still manage to grip large swaths of the country with surprising ferocity. A new study offers a powerful clue: the answer may lie more than 10 miles above our heads, in the shifting patterns of the stratosphere.
The research reveals how two specific patterns in the stratospheric polar vortex—a high-altitude pool of frigid air over the Arctic encircled by a band of strong west winds—can contribute to bone-chilling weather events across regions of North America. The patterns are described as “stretched” because the vortex is elongated relative to its typical, more circular shape. One such pattern reinforces intense cold in the northwestern US, while the other variation takes aim at central and eastern states. Both patterns are associated with changes in how atmospheric waves, in both the stratosphere and lower atmosphere, can alter the jet stream and allow Arctic air to penetrate far southward.
“Understanding the stratosphere’s fingerprints on changing weather patterns–particularly the counterintuitive connections between a warming globe and extreme cold weather events–could improve long-range forecasting, allowing cities, power grids, and agriculture to better prepare for winter extremes,” said Dr. Jennifer Francis.
This year, Las Vegas, Nevada broke its all-time heat record, reaching 120° F.
The temperature was recorded at Harry Reid International Airport on July 7, 2024. That week, between July 6 and July 12, was the new hottest 7-day period on record, with an average high temperature of 117.5° F.
This is the daily reality for Vegas residents in the summer. Record-breaking temperatures are hard to bear, but so were all the hot days and nights that came before. Commuters frequently see temperatures above 120 flash on their vehicle dashboards, and outdoor workers struggle to do their daily tasks under the hot sun.
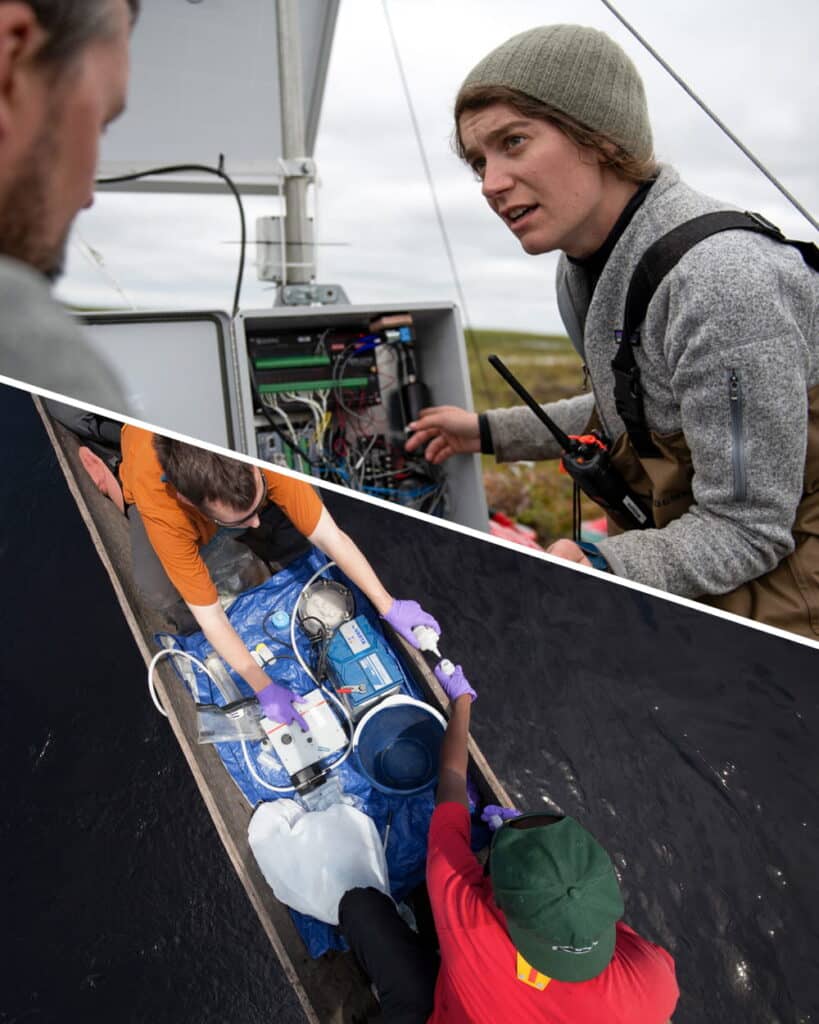
“There’s a disconnect between climate science and the people who live here,” says Woodwell Climate Research Associate, Monica Caparas. “Vegas residents know our summers are hot and unbearable. Understanding climate change is driving the extreme weather we’re experiencing is where the disconnect lies. ”
Caparas moved to Las Vegas as a child. She grew up there, left for college, and returned to settle into her adult life. Today, she works for Woodwell Climate’s Risk team remotely from her home in the city. Caparas knows the ins and outs of local life. These include Vegas’s rapid population expansion, the groups of people experiencing homelessness sheltering in underground stormwater infrastructure, and the heat that was unbearable before it started making headlines.
Experiencing climate change without shelter
Caparas’s work with the Risk team aims to provide communities like Las Vegas with an accurate picture of the climate-driven changes in their future. These “risk assessments” are provided through Woodwell Climate’s Just Access program, which uses the most accurate climate models, in collaboration with local knowledge, to anticipate future community safety threats. The analyses have brought to light growing threats from flooding, heat, storms, and more. The team provides assessments, free of charge, to states, cities, and countries across the world.
Just Access serves what Risk Program Director Christopher Schwalm calls “frontline communities.” The term describes groups of people who are over-exposed, under-resourced, underserved, historically marginalized, and therefore the most at-risk to the repercussions of climate change. In the risk assessment for Las Vegas, people experiencing homelessness are front and center.
“Between May 20th and the first week in July, about 20 people who were experiencing homelessness died of heat,” says Dr. Catrina Grigsby-Thedford, Executive Director of the Nevada Homeless Alliance (NHA) and community partner in Las Vegas.
The NHA estimates that almost 8,000 people are experiencing homelessness on any given night in southern Nevada. The number is only growing. Grigsby-Thedford says that this year’s unhoused population is up 1,300 people compared to 2023.
“Often our shelters are full,” Grigsby-Thedford says, “We’re limited by shelter beds and space.”
The NHA’s shelters do open all day in extreme heat, but so many people packed tightly together is still unsafe.
With nowhere to go, some seek shelter underground in Las Vegas’s stormwater infrastructure. While the tunnels are cooler out of the sun’s reach, they are at risk from flooding. Across the region, extreme precipitation is expected to increase by 12-14% by 2050, raising flood risk in the city and especially within the tunnels.
To combat lack of space and shelter, the NHA hosts 4-8 one-stop resource fairs per month. The events, called Project Homeless Connect, serve both people experiencing homelessness and low-income residents in Las Vegas. Grigsby-Thedford says these events “fill in gaps”—offering housing assistance, medical care, hygiene care, and other resources.
Despite all of this work, many unhoused people are hesitant to engage with organizations like the NHA. Grigsby-Thedford says “choice is often a challenge,” and that when people grow accustomed to the way things are, they often accept it and choose to stay.
Picturing risk
Building trust with communities, especially those predisposed to mistrust outside actors, is essential in this work. Which is why, Schwalm says, Woodwell Climate approaches risk work with the goal of “meet[ing] people where they are.”
That means “scoping,” the team’s word for listening to what community and government leaders want out of the risk analysis—what concerns they have, weak points they’ve identified, and what help might be needed post-analysis.
“Two-thirds of the time we spend from start to finish falls into this scoping idea, rather than doing analysis itself,” Schwalm says.
Scoping frames the data the risk team collects, as well as who their partners will be during the risk analysis process.
“We find people who are practical and recognize that there’s a problem,” Schwalm says, “We only work with communities who want to work with us.”
Following the scoping process, the Risk team compiles an analysis of extreme weather events and subsequent risks each community will face as climate change progresses.
“We perform a stress test of that particular geography to identify weak points,” Schwalm explains.
Then, the Risk team uses the most up-to-date climate models possible to predict changes in extreme weather and regional climate. By using predictive models, the team focuses efforts on what the future will hold, as opposed to using past strategies.
“We need to use the future to predict the future,” Schwalm says simply.
Making climate risk data accessible to all
Over the past three years, Just Access has provided 50 communities—that’s about a quarter billion people—with risk analyses. These communities span the U.S., Central and South America, Africa, Asia, and Oceania. They’ve worked with countries, like the Democratic Republic of Congo, where they helped update the country’s National Adaptive Plan, states like Chiapas in Mexico, groups like Cree Nation in Canada, and other communities, now including Las Vegas.
Despite all of this work, though, Schwalm says there is still room to grow.
“Fifty communities is kind of only a drop in the bucket,” he says, “We’re not going to make a huge dent in this unless we move beyond working community-by-community.”
Two major roadblocks for Just Access are finite resources: time and money. Individual risk analyses require a lot of time and communication to address risks in relatively small areas.
The other obstacle, money, is something climate research could always use more of. Grants and donations are crucial in order for analyses to remain free, and those sometimes come with limitations.
“There’s a tension from the funder to work in a specific geography sometimes,” Schwalm says, “It’s a juggling act.”
Climate change can also be a politicized topic. In order to meet people where they are, sometimes the Risk team implements changes in language used to communicate with community leaders. This can be a change as simple as using “extreme weather” instead of “climate change.” As long as everyone in the room is ready to confront what the future holds, they’re all working on the same page towards the same goal.
“We’ve done red states, blue states, rural, urban,” Schwalm continues. “We’ve learned how to read the room.”
Creating the foundations for change
Woodwell Climate’s involvement in Las Vegas brings to light the way justice issues, like homelessness, interact with growing threats from climate change.
“In the Las Vegas risk assessment, we are focusing on the disproportionate impacts of the climate crisis on communities already facing systemic socio-economic inequity,” says Caparas. “We must think about intersectionality in order to address climate justice.”
Not only does climate change represent a current crisis for those experiencing homelessness, communities with fewer resources are now at greater risk of being made homeless by future climate-related disasters. Accurate climate risk information can support organizations like NHA as they develop strategies to serve people experiencing homelessness in a more extreme future.
Grigsby-Thedford says that NHA members, especially those with lived experience of homelessness who work as Lived X Consultants, are always looking to be involved in projects like the one Caparas leads.
“We always talk about weather in our meetings,” she says, “So this is perfect, someone’s actually doing research about this. Anything that impacts [Las Vegas’s homeless population], we want to make sure we’re involved in that.”
For the Las Vegas risk assessment, Caparas is working with the NHA and Southern Nevada Lived X Consultants to understand climate risks around cooling stations in public buildings, which are a vital, air-conditioned shelter when the heat index is too high. Grigsby-Thedford says there were many more cooling stations in 2023 and 2024 compared to previous years.
Caparas also forged a connection with Miguel Dávila Uzcátegui, Southern Nevada’s Regional Transportation Commission (RTC) Senior Planner and board member of Help Hope Home. Together, they are developing a database of flooding infrastructure and updating the city’s flooding model with future climate projections. The RTC will integrate the Risk team’s model into regional planning work, updating Las Vegas’s flooding and transportation infrastructure for community safety.
None of this work would have been possible without Caparas’s diligent bridge building between the scientific resources of Woodwell Climate and the needs of people in her own community. Those connections allow science to be informed first and foremost by those most affected by climate change.
“The people closest to the problem are the people closest to the solution,” says Grigsby-Thedford.
A new study, published in Nature Communications Earth and Environment and co-authored by researchers at Atmospheric and Environmental Research, Inc. (AER) and Woodwell Climate Research Center, finds that abnormally warm temperatures in the Arctic are associated with a higher likelihood of severe winter weather including cold-air outbreaks and heavy snowfall in Northern Hemisphere continents.
“When the Arctic atmosphere is warmer than normal, we see a much higher likelihood of extreme winter weather across much of Canada, the northern U.S. and northern Eurasia,” remarked lead author, Dr. Judah Cohen at AER. “The relationship is especially strong in the northeastern sections of the continents.”
“Even though we’re seeing cold records being broken less often as the globe warms, we’ll still see debilitating spells of severe winter weather,” added co-author Dr. Jennifer Francis at Woodwell Climate. “There will be plenty of ice, snow, and frigid air in the Arctic winter for decades to come, and that cold can be displaced southward into heavily populated regions during Arctic heat waves.”
Recent disruptive extreme winter weather events—such as the deadly Texas cold spell of February 2021—have occurred and will continue to occur in the future, wreaking havoc on infrastructure, human wellbeing, and ecosystems, especially in areas unaccustomed to and ill-equipped for dealing with winter extremes.
“The Arctic may seem irrelevant and far away to most folks, but our findings say the profound changes there are affecting billions of people around the Northern Hemisphere,” added Dr. Francis. To reverse these trends, “it will take bold and rapid actions to reduce our burning of fossil fuels and the build-up of heat-trapping gasses in the atmosphere, but the tools exist if we can muster the will.”
According to Francis, recent studies have theorized that rapid Arctic warming, a pace three-to-four times faster than the globe as a whole, may increase the likelihood of extreme weather events owing to a reduced north/south temperature difference. In addition, slower westerly winds of the jet stream lead to more frequent convoluted jet-stream configurations, which lead to unusual weather.
“Disruptions in the typically stable stratospheric polar vortex may also occur more often in a warming climate,” noted Cohen, “and we know hazardous winter weather is more likely during these disruptions.”
Hurricane season in North America is underway. Already, the second storm of the year to earn a name, Beryl, has cut a destructive swath across the Caribbean and the United States. This year, the National Oceanic and Atmospheric Administration (NOAA) forecasted an extremely active hurricane season, anticipating between 17-25 named storms (the average is 14) and 4-7 major storms (average is 3). Major storms are category 3 and above with wind speeds exceeding 111 mph.
Intense seasons like this are likely to be a more common occurrence in a warmer world, as higher temperatures, rising seas, and changing weather patterns create the conditions for bigger, more destructive, longer lived, and more rapidly strengthening storms. Here’s how climate change is affecting the Atlantic hurricane season:
1. Higher temperatures mean more energy to form hurricanes
To understand how hurricanes are being affected by climate change, it’s important to understand how hurricanes are formed. They are essentially clusters of thunderstorms, building strength as they sweep westward using the energy from warm tropical waters. Under the right conditions, the Earth’s rotation will cause the cluster to spin into a cyclone shape. Because heat is energy, increases in sea surface temperatures play a critical role in strengthening these storms.
The ocean is a major heat sink for the planet, absorbing over 90% of the excess heat trapped by greenhouse gasses in the Earth’s atmosphere over the past few decades. Global sea surface temperatures have increased approximately 2.8F since the beginning of the 20th century, and ocean heatwaves — large areas of above-normal temperatures that can last for months-– are much more common and widespread. A hotter ocean means there is more energy available to fuel tropical storms, ultimately making it a more destructive event when it hits land.
2. The hotter the air, the more water it can hold
The second thing a hurricane needs to form is moisture. Water is evaporated and pulled up into the developing storm as it spins across warm waters of the tropical Atlantic. Hotter air temperatures mean more moisture can be held as vapor in the atmosphere, which allows storms to ingest greater amounts of water that will eventually condense into clouds and be released as rainfall. Condensation also releases heat into the storm, fueling its intensification. Models estimate that human-caused global warming has increased hurricane extreme hourly rainfall rates by 11%.
3. ENSO fluctuations are becoming more extreme
Climate change is also contributing to larger swings between the two phases of the El Niño Southern Oscillation (ENSO)—meaning stronger versions of both El Niño or La Niña patterns. Currently, the Atlantic is headed towards a La Niña, which favors hurricane formation because it lessens vertical wind shear. Differences in wind speeds at different heights in the atmosphere can tear a storm apart, while less shear (more consistency in wind speeds between altitudes) allows storms to stay together and build strength.
4. Tropical storms are undergoing rapid intensification more frequently
All these factors add up to more intense tropical storms in a world altered by climate change— meaning more category 3-5 storms and more big storms back-to-back. Since 1975 the number of category 4-5 cyclones has roughly doubled.
This doesn’t necessarily mean that there will be more hurricanes; however, the ones that do form can be bigger and cause more damage (on top of the already estimated $2.6 trillion in damages since 1980.) If anything, data shows a slight decrease in the number of storms, moving more slowly along their path, releasing their extreme wind and rain over a single location for longer periods.
5. Rising sea levels are making hurricanes more deadly
Sea level rise due to climate change has also made hurricanes a more dangerous threat for more people. As sea levels rise, coastlines are put at increased risk of flooding.
Sea levels have risen roughly 8 in since the late 19th century, and the rate of rise is accelerating as climate change worsens. When a hurricane makes landfall, water is pushed inland by high-speed winds in an event known as storm surge. Every additional inch of sea level rise allows the surge to travel farther inland, threatening a wider area and causing more damage, death, and injury— especially in areas where human development along the coast has exposed people and homes to greater risk.
As temperatures continue to rise, communities along the East and Gulf coasts can expect to be hit harder by destructive storms. Despite this, more and more people are choosing to live and build along the coasts, increasing the cost of damages when hurricanes do strike. Slowing warming temperatures and building adaptation measures to protect coastal communities will become more urgent as Atlantic hurricanes intensify.
We can all agree 2023 was a weird year for weather, right? The United States set a record for the number of billion dollar weather disasters. A major Amazon River tributary reached its lowest water levels in a century during extreme drought. Extreme rain in Libya caused two dams to break, destroying homes and killing over 4,000 people.
And then, of course, there was the heat. 2023 was the hottest year on record. Countries around the world saw heat records fall month after month. The Arctic was hot. The ocean was hot. And debates swirl on about whether we’ve already passed critical warming thresholds.
So how do we put 2023 in context of the greater trend of warming? Here’s what some of Woodwell Climate’s scientists have to say about last year’s record-breaking events.
Did the models predict this?
The dramatic scenes of heat and extreme weather last year prompted many to ask why temperatures had seemingly spiked way above the trend line. Was this unexpected? Was it out of the range of what scientists had modeled? Woodwell Senior Scientist, Dr. Jennifer Francis says not entirely.
“Almost exactly a year ago,” says Francis, “we had just come out of three years of La Niñas and we came close to breaking global temperature records then, even though La Niñas tend to be cooler than neutral or El Niño years. And then along came the strong El Niño of 2023.”
El Niño and La Niña are two extremes of a natural phenomenon that impacts weather patterns across the Pacific, and around the world. In an El Niño year, the prevailing trade winds that normally push warmer waters into the western tropical Pacific—allowing cooler water to well up along the western coast of the Americas—are reversed, resulting in hotter ocean surface temperatures in the eastern equatorial Pacific. When the ocean is hotter than the air above it, that heat is released into the atmosphere, often making El Niño years record breaking ones for global temperatures.
“Last year’s spike looks a lot like the last big El Niño event in 2015-2016. It’s just that now the whole system is warmer. So to me, it wasn’t at all a surprise that we smashed the global temperature record in 2023,” says Francis.
The spike put global temperatures far above the average of climate model simulations, but that doesn’t mean the models didn’t account for it. Risk Program Associate Director, Dr. Zach Zobel, says that averages tend to smooth out natural year-to-year fluctuations, when in fact the upper and lower ranges of model predictions do encompass temperatures like the ones seen in 2023.
“It was well within the margin of error that you would expect for natural variations,” says Zobel.
How does ocean heat impact the climate?
One element of last year’s heat, one that wasn’t necessarily forecasted, was the simultaneous appearance of several ocean heat waves around the globe. The ocean absorbs the vast majority of heat trapped by greenhouse gasses, and that heat can be released under the right conditions. El Niño is one example, but in 2023 it coincided with other not-so-natural marine heat waves across the world.
“In pretty much every single ocean right now there are heat waves happening, which is something quite new,” says Francis.
A couple of dynamics could be driving this. One possibility is that, after three years of La Niñas, in which equatorial Pacific ocean temperatures were generally cooler than the air, the ocean simply absorbed a lot of heat, which was then primed to be released in an El Niño year. Another, Zobel suggests, could be recent shipping laws that required shipping vessels to eliminate sulfate emissions by 2023. Sulfates are a pollutant that may have been helping bounce back solar radiation, hiding the true extent of warming.
“Usually when there’s an El Niño, the eastern tropical Pacific is very warm, but it doesn’t actually drive up ocean temperatures everywhere,” says Zobel. “That was the biggest surprise to me: how warm the northern hemisphere of the Atlantic and Pacific were for most of last year and into 2024.”
Ocean heat waves are typically long-lived phenomena, lasting many months, and so can be a useful tool for meteorologists looking to predict 2024’s extreme weather events.
“The good news is that it provides some kind of long-term predictability about weather patterns in the upcoming year,” says Francis. “The bad news is that they tend to be unusual weather patterns, because those ocean heat waves aren’t usually there.”
Will next year be hotter?
So are we in for another, hotter year after this one? Risk Program Director Dr. Christopher Schwalm says it’s likely.
“Warming predictions for 2024 from leading scientists all forecast a higher level of warming this year than last year,” says Schwalm.
Already, March 2024, was the 10th month in a row to break temperature records. Zobel says it’s typical for the year following an El Niño peak to maintain high temperatures.
“Because the ocean spent a good amount of the year last year warmer than average, that energy is typically dispersed throughout the globe in the following year,” says Zobel. “So even though the tropical Pacific might return to normal, that energy is still in the system.”
However, atmospheric scientists are already seeing signs that El Niño is slowing down and flipping to its counterpart, La Niña, adding another layer of complexity to predictions for 2024.
“The 2024 hurricane season is a large concern,” says Zobel. “La Niña is a lot more conducive to tropical cyclone development. If we combine above average numbers with the amount of energy that storms have to feed on, it’ll be a shock to the system.”
What does this mean for 1.5?
In the discussions around 2023’s temperatures, one number dominates the conversation: 1.5 degrees C. This is the amount of warming countries around the world agreed to try to avoid surpassing, in accordance with the United Nations’ 2015 Paris Climate Agreement. Estimates from Berkeley Earth say that 2023 may have been the first year spent above that threshold.
This assertion may take several years to verify— one year spent physically above 1.5 degrees of warming does not indicate the UN threshold has been permanently passed. What scientists are looking for is a clear average trend line rising above 1.5 degrees C without coming back down, and for that you need several years of data. That, regrettably, creates a lag time between climate impacts and updating climate policy. But, for many, the debate around the arbitrary 1.5 degree goal has become a distraction. Schwalm says scientists and policy-makers should be focusing on urgently combating climate change whatever the numbers say.
“We are already living in a post-Paris Agreement reality,” says Schwalm. “The sooner we admit that and reimagine climate policy, the better.”
“Actual real world impacts are going to be there, whether we’re at 1.48 or 1.52,” says Zobel.
And Francis agrees. “There are so many indicators telling us that big changes are underfoot, that we are experiencing major climate change, but reaching 1.5 isn’t going to all of a sudden make those things worse. It’s just one more reminder we’re still on the wrong track and we’d better hurry up and do something.”
Last month was hottest February ever recorded. It’s the ninth-straight broken record

For the ninth straight month, Earth has obliterated global heat records — with February, the winter as a whole and the world’s oceans setting new high-temperature marks, according to the European Union climate agency Copernicus.
The latest record-breaking in this climate change-fueled global hot streak includes sea surface temperatures that weren’t just the hottest for February, but eclipsed any month on record, soaring past August 2023’s mark and still rising at the end of the month. And February, as well the previous two winter months, soared well past the internationally set threshold for long-term warming, Copernicus reported Wednesday.
Continue reading on Associated Press News.
Study pinpoints links between melting Arctic ice and summertime extreme weather in Europe
New research shows how last year’s warming melted ice in Greenland that increased flows of fresh, cold water into the North Atlantic, upsetting ocean currents in ways that lead to atmospheric changes.
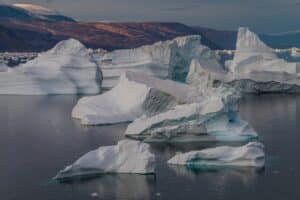
The Arctic Ocean is mostly enclosed by the coldest parts of the Northern Hemisphere’s continents, ringed in by Siberia, Alaska and the Canadian Arctic, with only a small opening to the Pacific through the Bering Strait, and some narrow channels through the labyrinth of Canada’s Arctic archipelago.
But east of Greenland, there’s a stretch of open water about 1,300 miles across where the Arctic can pour its icy heart out to the North Atlantic. Those flows include increasing surges of cold and fresh water from melted ice, and a new study in the journal Weather and Climate Dynamics shows how those pulses can set off a chain reaction from the ocean to the atmosphere that ends up causing summer heatwaves and droughts in Europe.
Read more on Inside Climate News.