


Crucial industries could be uncompetitive without renewable power


Background
Solar energy and battery storage costs have decreased dramatically as prices remain stagnant for natural gas, coal, and nuclear. Over the past decade, solar prices have decreased by 14% per year and battery prices have dropped 20% per year according to data from the International Renewable Energy Agency (IRENA)1. Energy forecasts, however, typically assume only minor improvements in renewable prices, causing now-infamous predictions of renewable capacity growth such as the International Energy Agency (IEA) projections, which over the past 15 years have repeatedly underestimated solar deployment2. As such, we project power prices from an alternate scenario that assumes future innovations allow the cost declines of the past 15 years to continue through 2050. Using this scenario, we demonstrate the risk to legacy power systems from potential cost improvements in solar and batteries.
As of 2025, it is cheaper to build a solar plant than a fossil or nuclear power plant for daytime power in most locations, but expensive batteries limit the cost-competitiveness of solar power outside of daylight hours. While utility-scale batteries are currently prohibitively expensive for use outside of peak hours, a continuation of recent price decreases would lead to solar and batteries being the cheapest source of power within a decade, creating major challenges for legacy power plants.
The combination of rapid improvements in renewables and stagnant prices for fossil energy sources also creates a challenge for manufacturers dependent on legacy power systems. This energy-price pressure causes large impacts on energy-intensive manufacturing, creating offshoring risk for strategically and economically important industries such as aluminum, data centers, and some advanced manufacturing.
Methodology
Electricity prices were calculated from 2025–2050 under four scenarios: Solar Ascendant, a solar and batteries heavy scenario in which 90% of power is generated from solar and 10% from hydropower, with battery storage equal to half of daily solar output to cover nighttime power needs; Current Mix, which assumes the current mix is used in future years; Coal Resurgent, a fossil-based scenario with 10% hydro, 10% nuclear, 40% coal, and 40% natural gas; and the IEA Current Policies Scenario3. Electricity demand is forecast to grow by roughly 50% by 2050, necessitating the construction of new power plants that have substantially higher effective operating prices than full depreciated legacy power plants. The Lazard Levelized Cost of Energy (LCOE) is 469%, 67%, and 155% higher for nuclear, coal, and natural gas, respectively. As such, in all scenarios the midpoint of the Lazard LCOE estimates4 for newly constructed and fully depreciated power was used for all sources except for solar and batteries, which are assumed to be entirely new and non-depreciated. To simplify analysis, wind and solar generation are grouped together in the IEA Current Policies Scenario forecasts. This simplifying assumption is partially motivated by current deployment trends, as wind capacity growth in 2025 was less than 1/4 of solar capacity growth5.
For solar, the Lazard LCOE for new solar was used as the starting estimate for 2024, with future prices projected following the observed 14% per year decline from IRENA. For batteries, Bloomberg BNEF’s 2024 price estimate6 was used as the starting value, with a 20% per year price decline calculated from historical IRENA data. For solar and batteries, the price of new construction rather than depreciation was used to allow for a conservative estimate of prices. A five-year average age of installed capacity was assumed, causing a five-year lag in price declines. For the manufacturing and services cost analysis, energy inputs and prices were gathered from a variety of sources and reflect constant 2025 efficiency and prices. Electricity inputs are taken from industry sources, with energy input prices for each of the four products calculated by multiplying the electricity required by the cost from each energy mix.
Results
Renewable technologies such as solar, wind, hydro, and batteries differ fundamentally from fossil fuel and nuclear sources in that power can be generated without the purchase of fuel, allowing for a far lower price floor. Solar is already the cheapest source of new power generation as of 2025, and our forecast finds this trend becomes more pronounced, with solar power more than 90% cheaper than coal, nuclear, or natural gas by 2050 (Figure 1). However, solar is only capable of producing power during daylight hours, necessitating a separate power source. Conventional fossil fuel and nuclear-based power plants generally struggle to operate intermittently or incur far higher costs, necessitating alternate nighttime-only sources such as batteries7.
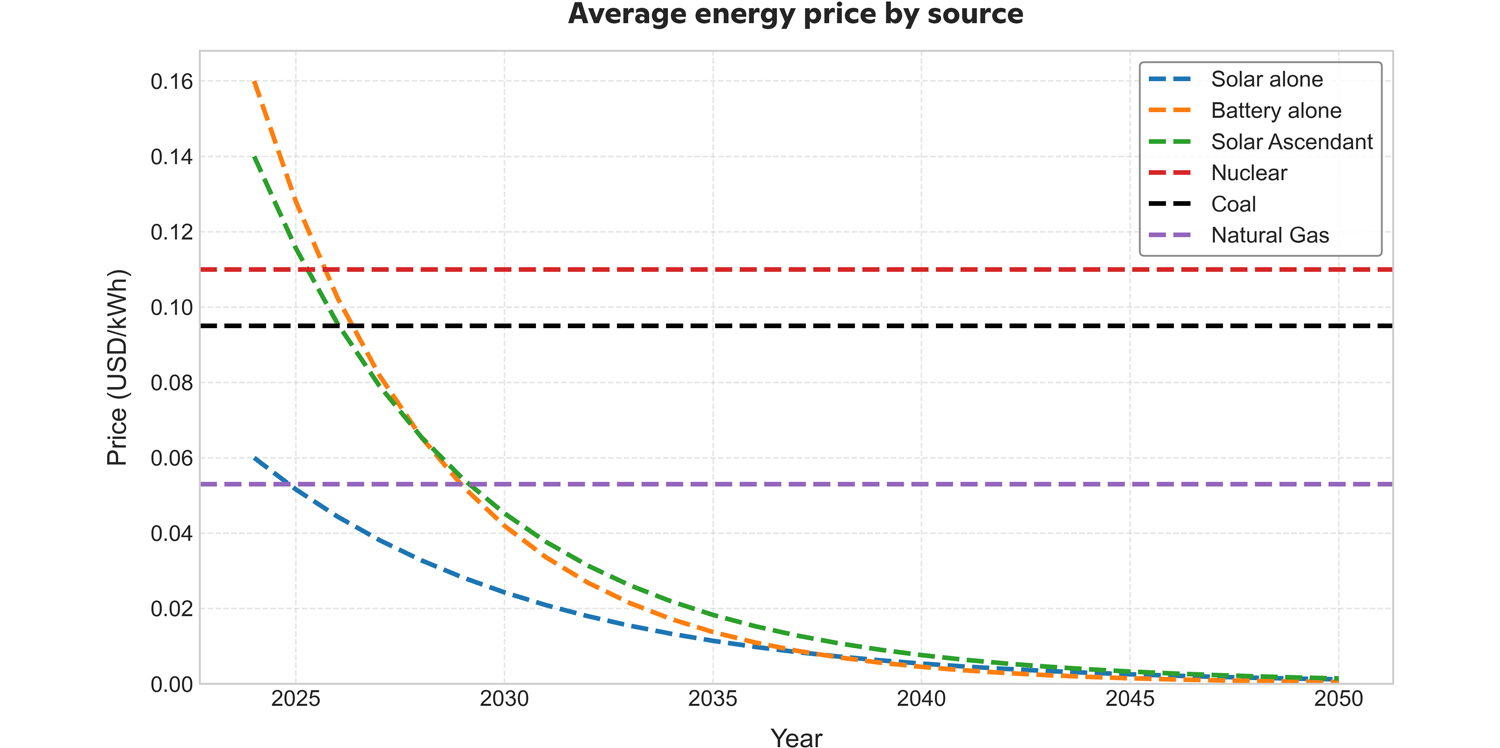
Figure 1. Energy prices for 1 kWh of electricity from modeled sources. Nuclear, coal, and natural gas assume an even mix of more expensive newly constructed power sources and cheaper fully depreciated legacy power sources, while other sources assume higher new construction prices.
Currently, utility-scale battery storage is prohibitively expensive outside of evening and morning windows of peak power prices. Nevertheless, global utility-scale battery capacity increased 90% annually from 2010–2023, with 92 GW or roughly 0.2% of global electricity generation installed in 2025 alone8. Our forecast finds that by 2029, battery prices will decrease enough that overnight storage of daytime solar is not only feasible, but cheaper than conventional energy sources. This major inflection point indicates the year when fossil fuel power generation, even from existing fully depreciated plants, will not be economically competitive with a mix of solar power and batteries. From 2030 onwards, existing natural gas and nuclear plants will operate at a higher price than renewables during both daylight and nighttime hours, leading to the shuttering of existing plants, similar to the decommissioning of coal plants, which have been undercut by cheaper natural gas in developed economies in the past few decades. Solar power requires no inputs and generates excess energy during peak daylight, which is purchased and stored at very low prices by utility-scale batteries and sold at night at higher rates. Continuous improvements in solar farm costs lower daytime power prices, while improvements in batteries lower prices of nighttime power. Meanwhile, fossil and nuclear input prices and operation costs remain static, causing legacy power plants to be wholly uncompetitive.
The economics of input-free renewable power are straightforward and global, but the rollout will vary substantially by country, creating cost-competitiveness challenges for domestic manufacturers. We model power prices from four energy mixes: solar with batteries; the global average 2025 energy mix; a mixture of 10% hydropower, 10% nuclear, 40% coal, and 40% gas; and the IEA Current Policies scenario (Figure 2). For the solar and batteries scenario, we assume the average power generation facility is five years old, meaning that the 2030 energy price reflects 2025 generation costs. We find that solar with batteries is the cheapest energy mix beginning in 2033 and costs only 0.4 cents per kWh in 2050, less than 10% of the costs from other energy mixes. While these prices are astonishingly low, moderate improvements in efficiency and substitution of cheaper materials are capable of achieving these dramatic price improvements9.
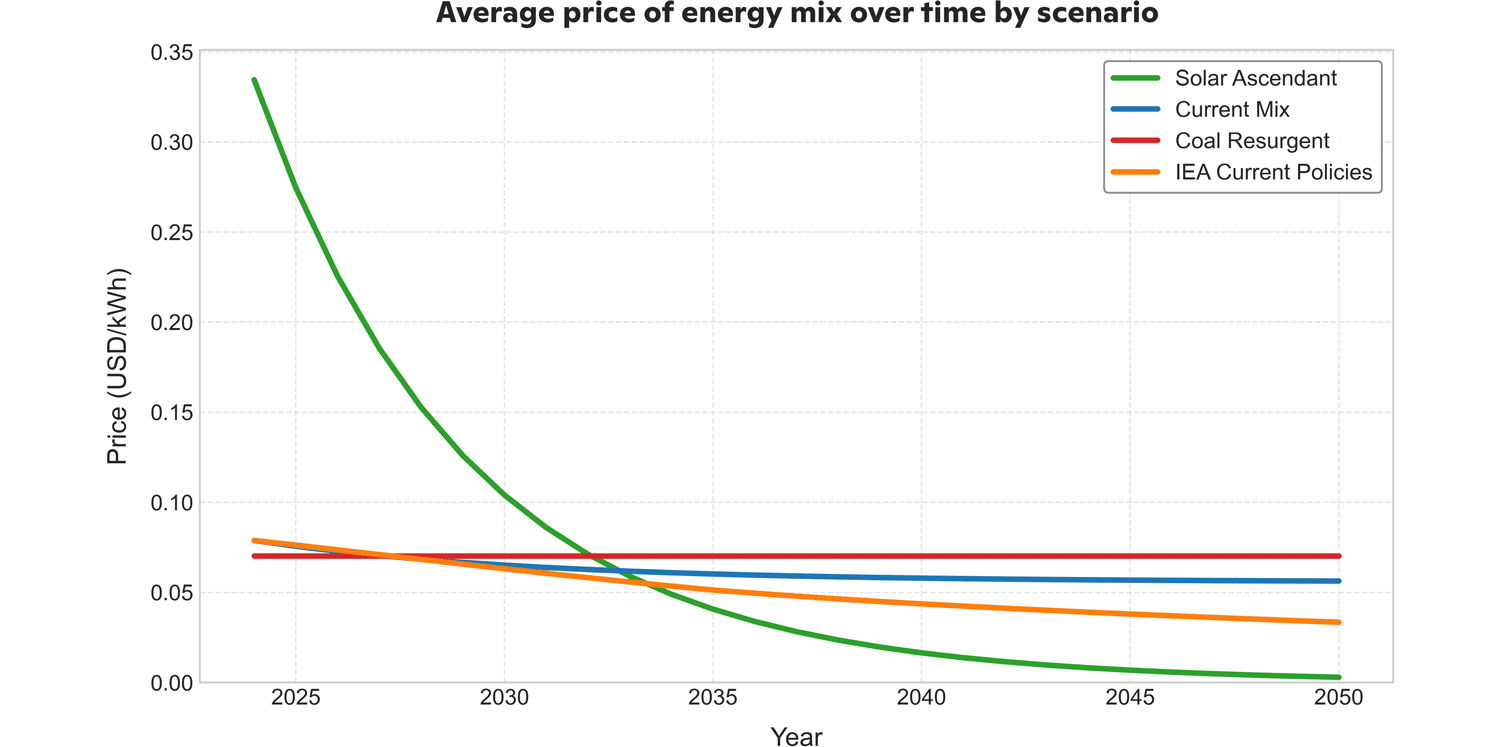
Figure 2. Energy prices from four energy mixes in price per kWh. Solar and batteries are assumed to be, on average, five years old, resulting in a five-year delay in price declines.
This tenfold divergence in domestic power prices creates large differences in energy input costs. Here, we calculate energy input costs in manufactured goods, both in absolute terms and as a percentage of the price of the finished good, demonstrating that impacts are largest in goods that are energy-intensive and low-margin (Figure 3). Aluminum production is particularly impacted, with 8% lower manufacturing margins from the current energy mix compared to the solar and batteries mix in 2035, increasing to 20% lower margins in 205010. The strategic importance of aluminum production for military use, combined with the inability to be cost-competitive, creates an interesting conundrum for policymakers with legacy power systems: either allow cost-pressures to offshore manufacturing to potential adversaries, or pursue expensive subsidies to maintain domestic production. Similar issues are seen in data centers, which represent a major economic and technological opportunity, as well as a growing strategic resource due to defense applications. However, following projected cost improvements in renewable power, data centers will face cost pressures leading to relocation to countries that have pursued cheaper renewable power, creating domestic shortages and leverage for host countries with cheap power. Manufacturing margins for steel production and vehicles are much less affected, though a 1–2% decrease in margins could still shutter some domestic facilities. As such, higher-margin specialty manufacturing is likely to be less impacted, though there is a minor increase in offshoring pressure.
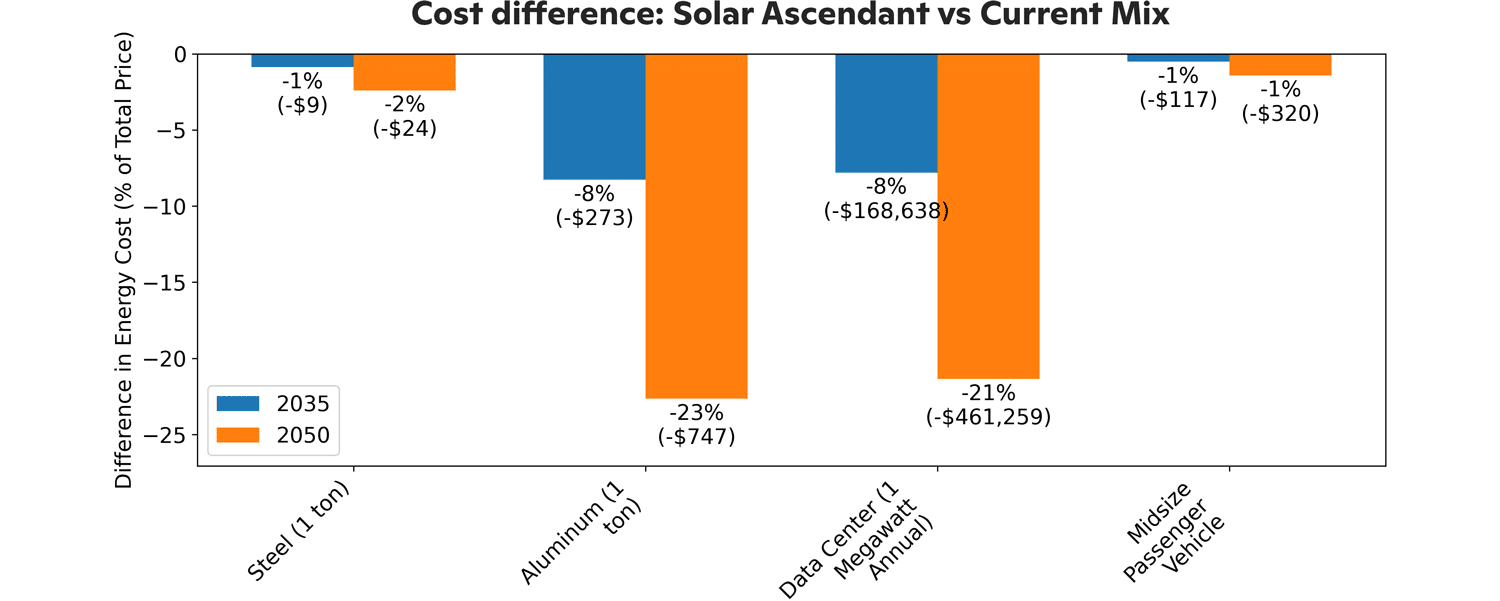
Figure 3. Cost differences between solar and battery energy mix and 2025 energy mix for four products in 2035 (blue) and 2050 (orange). Percent value represents difference in percent of sale price, with the difference in absolute price of energy in parentheses. Energy costs are calculated based on current energy inputs for the four products multiplied by energy prices from the two energy mixes.
Conclusion
A continuation of observed price declines for solar and batteries results in solar and batteries being the cheapest power mix for most locations by 2033, with 90% lower costs from solar and batteries compared to other power mixes by 2050. The sharp decrease in battery prices will allow stored excess daytime solar energy to be cheaper than fossil sources for nighttime power needs by 2030. Given these rapid battery price declines, policymakers should plan for solar overcapacity to power future battery storage. Countries that lag in deployment of solar and batteries risk uncompetitive power prices, creating offshoring risk for strategically and economically important industries such as aluminum production and data centers, as well as other low-margin, high-energy processes.
Forecasts of solar and battery deployment have consistently underestimated growth by projecting minor decreases in costs, despite consistent observed exponential cost declines. Recent forecasts continue to underestimate cost improvements, with an early 2025 forecast somehow managing to project 2050 battery prices would be higher than observed prices later that year, despite forecasting price declines11. Rather than assuming limited technological improvements, we choose to model a scenario where innovation continues at the observed annual rate. Because batteries and solar are still relatively early in development and remain far from perfected, we believe that continued innovation is a more reasonable assumption than stagnation for the next few decades, motivating this modeling exercise.
Solar power, and to a lesser degree batteries, require only free inputs, leaving materials, manufacturing, shipping, installation, and upkeep as the only costs. Each of these costs can be lowered with further improvement, with materials in particular showing promise as both solar and batteries are being developed with increasingly cheap and ubiquitous resources. Currently, battery and solar production require substantial fossil inputs from mining, shipping, and manufacturing. As renewable electricity becomes cheaper, these processes will electrify, further lowering prices. Similarly, developments in battery technology and manufacturing processes, as well as improvements in utility-scale deployment, present opportunities for massive price declines. Taken together, a continuation of observed decreases in renewable power generation costs is well within the realm of possibility, requiring a sober analysis of the economic and security challenges for countries that lag in deployment of renewable power generation.
1 Data is from the IRENA Renewable Power Generation Costs in 2024 report (https://www.irena.org/Publications/2025/Jun/Renewable-Power-Generation-Costs-in-2024)