Natural climate solutions are identified and designed with full consideration of risks from climate extremes, natural disturbances, and socioeconomic events.

Prepared by Zach Zobel and Dave McGlinchey


Summary

Many natural climate solutions will take time to reduce net greenhouse gas emissions, exceptions being reducing deforestation and forest degradation, delaying harvest, and reducing emissions from agricultural soils. If benefits are expected to accrue decades into the future, the solutions must consider that climate and other factors will likely be very different and so the expected benefits may not be as great as predicted by current conditions.

Description and Rationale

The impacts of climate change are already being felt and will only worsen, with direct ramifications on natural systems throughout the United States. These impacts will then affect the ability of those natural systems—forests, grasslands, wetlands, and soils—to store carbon and mitigate climate change.

While developing NCS policies, risks should be considered for several climate change perils: drought, precipitation extremes, flooding, hurricanes, heat stress, invasive species, and wildfire. These hazards were identified as the prevalent risks in the United States out to mid-century—a timeframe that is relevant for both mitigation efforts and near-term policymaking. This information should be understood and internalized by policymakers to avoid implementing or investing in NCS that will not remain viable after 20 or 30 years, though some activities like reducing forest degradation could help guard against future hazards. For example, climate risk modeling could help avoid incentives for reforestation in areas that will become more prone to drought in coming decades.

Changing climate conditions will also shift ecological zones. For example, climate change is projected to alter the distribution of tree species as a result of environmental changes that will affect growth, mortality, reproduction, disturbances, and biotic interactions (Rogers et al. 2016). A region that currently sustains certain tree species could become inhospitable, or overrun by invasive species that outcompete native species, or could become warm enough for migrating pests. These projected changes will affect the net greenhouse gas balance of ecosystems in the future and could result in less net emissions reductions than expected.

A mid-century focus requires the use of global climate models (or Earth system models) and we use a ‘business as usual’ scenario for this purpose—RCP8.5 in the vernacular of climate scientists. This scenario is within 1% of total carbon dioxide emissions from 2005 to 2020—even after accounting for a worst case COVID-19 lockdown—and is the closest match out to mid-century as compared to the World Energy Outlook 2019 forward scenarios from the International Energy Agency (Schwalm et al., 2020).

How the principle may be applied to specific climate risks—drought and wildfire

1. Drought

Since the 1980s, droughts have been the second-most costly weather/climate disaster in the United States, generating an average $9.4 billion loss per event (NCEI NOAA). California and much of the western United States are arid regions, historically prone to drought (Bolinger 2019). The 2012–2016 California drought, driven primarily by record high temperatures and less than normal precipitation, was by some measures the state’s most extreme drought of the past century with the 2014 peak the driest period over the last 1200 years (Griffin & Anchukitis 2014). The drought caused a shocking widespread mortality event of 48.9% of the state’s trees across 102 million acres of forests in 2014–2017 in the central and southern Sierra Nevadas, which may lead to forest type conversion of even a long-term shift to grassland (Fettig et al. 2019).

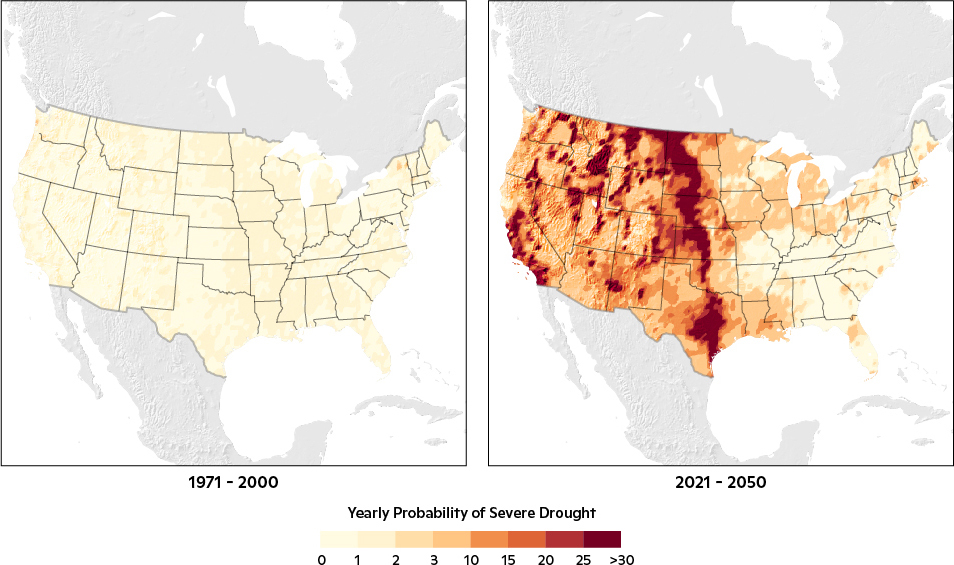
In the future, drought frequency and severity is expected to worsen as global temperatures increase and precipitation becomes more variable (Cook et al. 2015; Huang et al. 2017). By 2021–2050, the probability of extended severe drought at least doubles to 20% across most of the US. Such widespread drought would affect all ecosystems including those essential to sustain food supplies, and could severely impact efforts to reduce net GHG emissions by enhancing carbon sequestration in forests and soils.

Drought in the US: comparison of 1981-2010 to 2021-2050 probability
Figure 1. Yearly Probabilities of a Severe Drought in 1981-2010 and 2021-2050. A severe drought is defined as a 6-month average sc-PDSI value of -4 or less. The sc-PDSI is calibrated in 1951-1980, which serves as a reference period. The sc-PDSI is corrected for CO2 fertilization from increasing CO2 concentrations, which enhances plant water retention and decreases drought risk (Swann et al. 2016).


2. Wildfire

Fire is a natural process in healthy forest ecosystems but a longer fire season, hotter and drier conditions, and a century of fire suppression and exclusion to reduce infrastructure loss, has led to a trend toward more and larger wildfires.

The average acreage burned per year in the United States more than doubled from 2000–2019 relative to 1980–1999. Wildfire size has also increased in most of the western United States (Center for Climate and Energy Solutions). The total acreage burned in the United States during the 2010s alone (68.5 million acres) is about the size of the state of Colorado. The 2020 fire season in California toppled the state’s record for acres burned, at 4.1 million acres, by mid September—months before the end of the fire season (Cal Fire). Three of the top four largest wildfires in recorded history burned in 2020; notably, the first, third and fourth largest burned concurrently in the absence of seasonal winds (Cal Fire). These trends reflect a reduction in wildfire incidence throughout the 20th century caused in part by successful fire suppression leading to a buildup of fuel (Marlon et al. 2012).

The wildfire season will increase throughout much of the western United States, with varying degrees of regional change. In the areas of Idaho, Oregon, and Wyoming where the fire season was historically longest, the number of high fire danger days increases by more than 10 days, with greatest increases exceeding two weeks in southeastern Oregon, southern Oregon and much of Wyoming. The wildfire season increases on average by two weeks in the southwestern United States, with increases exceeding a month in parts of Arizona, southern Nevada, and southern California. By 2021–2050 if these trends continue, the wildfire season will increase by three or four weeks to nearly 5 months in California along the Sierra Nevadas and Transverse Ranges, north of Los Angeles where Santa Ana winds occur. Even just an extra few fire danger weeks increases the likelihood that fire-friendly conditions exist during weather events capable of starting fires and promoting rapid spread (Fire Weather Research Laboratory; Guzman-Morales et al. 2016).

maps comparing fire season length of 1971-2000 to 2021-2050 probability
Figure 2. Change in fire danger days in 2021-2050 relative to 1971-2000 in the northwestern and southwestern US.


References

Bolinger, B. (2019, August 18). How Drought Prone Is Your State? A Look at the Top States and Counties in Drought Over the Last Two Decades. Drought.Gov.

Cal Fire. (2021). State of California.

Center for Climate and Energy Solutions. (2020, September 11). Wildfires and Climate Change. Center for Climate and Energy Solutions.

Cook, B. I., Ault, T. R., & Smerdon, J. E. (2015). Unprecedented 21st century drought risk in the American Southwest and Central Plains. Science Advances, 1(1), e1400082. DOI: 10.1126/sciadv.1400082

Fettig, C. J., Mortenson, L. A., Bulaon, B. M., & Foulk, P. B. (2019). Tree mortality following drought in the central and southern Sierra Nevada, California, U.S. Forest Ecology and Management, 432, 164–178. DOI: 10.1016/j.foreco.2018.09.006

Fire Weather Research Laboratory. (n.d.). Diablo Winds. Fire Weather Research Laboratory. from

Griffin, D., & Anchukaitis, K. J. (2014). How unusual is the 2012–2014 California drought? Geophysical Research Letters, 41(24), 9017–9023. DOI: 10.1002/2014GL062433

Guzman‐Morales, J., Gershunov, A., Theiss, J., Li, H., & Cayan, D. (2016). Santa Ana Winds of Southern California: Their climatology, extremes, and behavior spanning six and a half decades. Geophysical Research Letters, 43(6), 2827–2834. DOI: 10.1002/2016GL067887

Huang, S., Leng, G., Huang, Q., Xie, Y., Liu, S., Meng, E., & Li, P. (2017). The asymmetric impact of global warming on US drought types and distributions in a large ensemble of 97 hydro-climatic simulations. Scientific Reports, 7. DOI:  10.1038/s41598-017-06302-z

NCEI NOAA. (n.d.). DROUGHT: Monitoring Economic, Environmental, and Social Impacts. NCEI NOAA.

Rogers, B. M., Jantz, P., & Goetz, S. J. (2017). Vulnerability of eastern US tree species to climate change. Global Change Biology, 23(8), 3302–3320. DOI: 10.1111/gcb.13585

Schwalm, C. R., Glendon, S., & Duffy, P. B. (2020). RCP8.5 tracks cumulative CO2 emissions. Proceedings of the National Academy of Sciences, 117(33), 19656–19657. DOI: 10.1073/pnas.2007117117

Swann, A. L. S., Hoffman, F. M., Koven, C. D., & Randerson, J. T. (2016). Plant responses to increasing CO2 reduce estimates of climate impacts on drought severity. Proceedings of the National Academy of Sciences, 113(36), 10019–10024. DOI: 10.1073/pnas.1604581113