Unequal heat
A visit to Worcester, Massachusetts in the heat of summer highlights the inequities of rising temperatures
(above) Ph.D. candidate, Arman Bajracharya, points to our location on a heat index map of Worcester.
photo by Sarah Ruiz
It’s a hot, humid day in late August and we’re all already sweating as Arman Bajracharya begins to tell us about his project.
Bajracharya is a second year Ph.D. student in the geography department at Clark University in Worcester, MA, where we’re standing now. He pulls out a green and orange map of the city and points to our location on one of the orange blocks that signals industrial land use and impervious land cover.
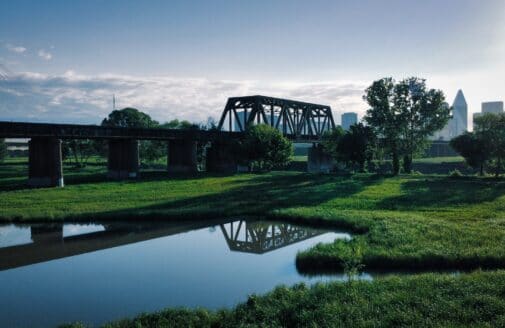
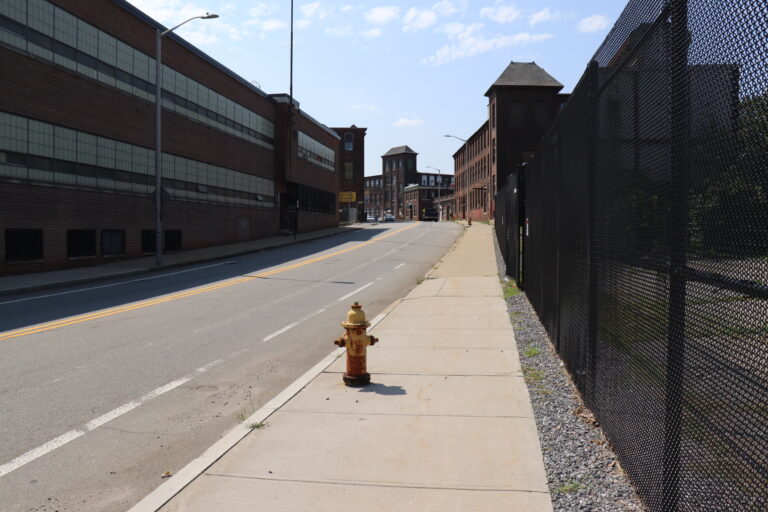
We’re standing in the sparse shade of some trees ringing the edge of an old millpond, but we had to walk across a hot, cracked parking lot to access it. The neighborhood is called Webster Square. It is located in the southern reaches of Worcester, which was once a vibrant epicenter of the industrial revolution.
That industrial heritage is evident both on the maps Bajracharya shows us as well as in our surroundings. Truck beds and spare pvc piping and gravel piles rest at the edge of the water. It’s also scorching hot.
Temperature varies with land cover. In cities, the presence of impervious surfaces like asphalt, concrete, and metal trap heat, while natural surfaces—water or vegetation—can help buffer it. The distribution of these hotspots and heat buffers in Worcester, as in many cities, is not equal. Some neighborhoods endure much higher temperatures than others during the summer months.
Bajracharya’s research during the Summer of 2021, made possible by the Edna Bailey Sussman Fund, employed remote sensing and census data to determine what features make a neighborhood more susceptible to extreme heat. He mapped temperature, land cover, and land use onto areas of greatest social vulnerability in Worcester, as well as two other post-industrial cities in Massachusetts— Haverhill and New Bedford. The results show that as climate change warms cities, the communities that have already experienced environmental inequities are likely to face more.
A Gateway to the American Dream
Worcester, Haverhill, and New Bedford are designated as historic gateway cities. These places, often important centers of the industrial revolution, served as “gateways to the American dream,” offering job opportunities and housing for many who immigrated to the region.
Worcester began its industrial life as a mill town, but soon grew into a manufacturing center for a variety of goods. It was also a crossroads of canal, and later rail, thoroughfares connecting the rest of Massachusetts with Providence and New York. Today, at the edge of the millpond in Webster Square, the remnants of an old rail bridge are still visible, and active trains can be heard traveling the present day rail lines in the distance.
(audio) Dr. Rinku Roy Chowdhury explains Worcester’s industrial past. The city is still an important transportation center, evidenced by the active rail lines.
Industrial neighborhoods built to serve mills and factories later filled in with minority populations, and over time, wealthier families moved to quieter and more suburban areas of town. In the case of Haverhill, some communities also suffered the consequences of redlining, a discriminatory Federal Housing policy during the post-Depression era that limited financial services available to people— overwhelmingly African-American and people of color— deemed “hazardous to investment,” which limited social mobility and enforced racial housing segregation. These factors often intensified the overlap between areas of high social vulnerability and industrial infrastructure.
“In the 1930s, these practices delineated which areas were defined to be good for financial services like loans,” Bajracharya says. “Which is why there is a historical divide between which areas are favorable and which areas are not. That can impact how we see the land being used today, especially where the greenspaces are.”
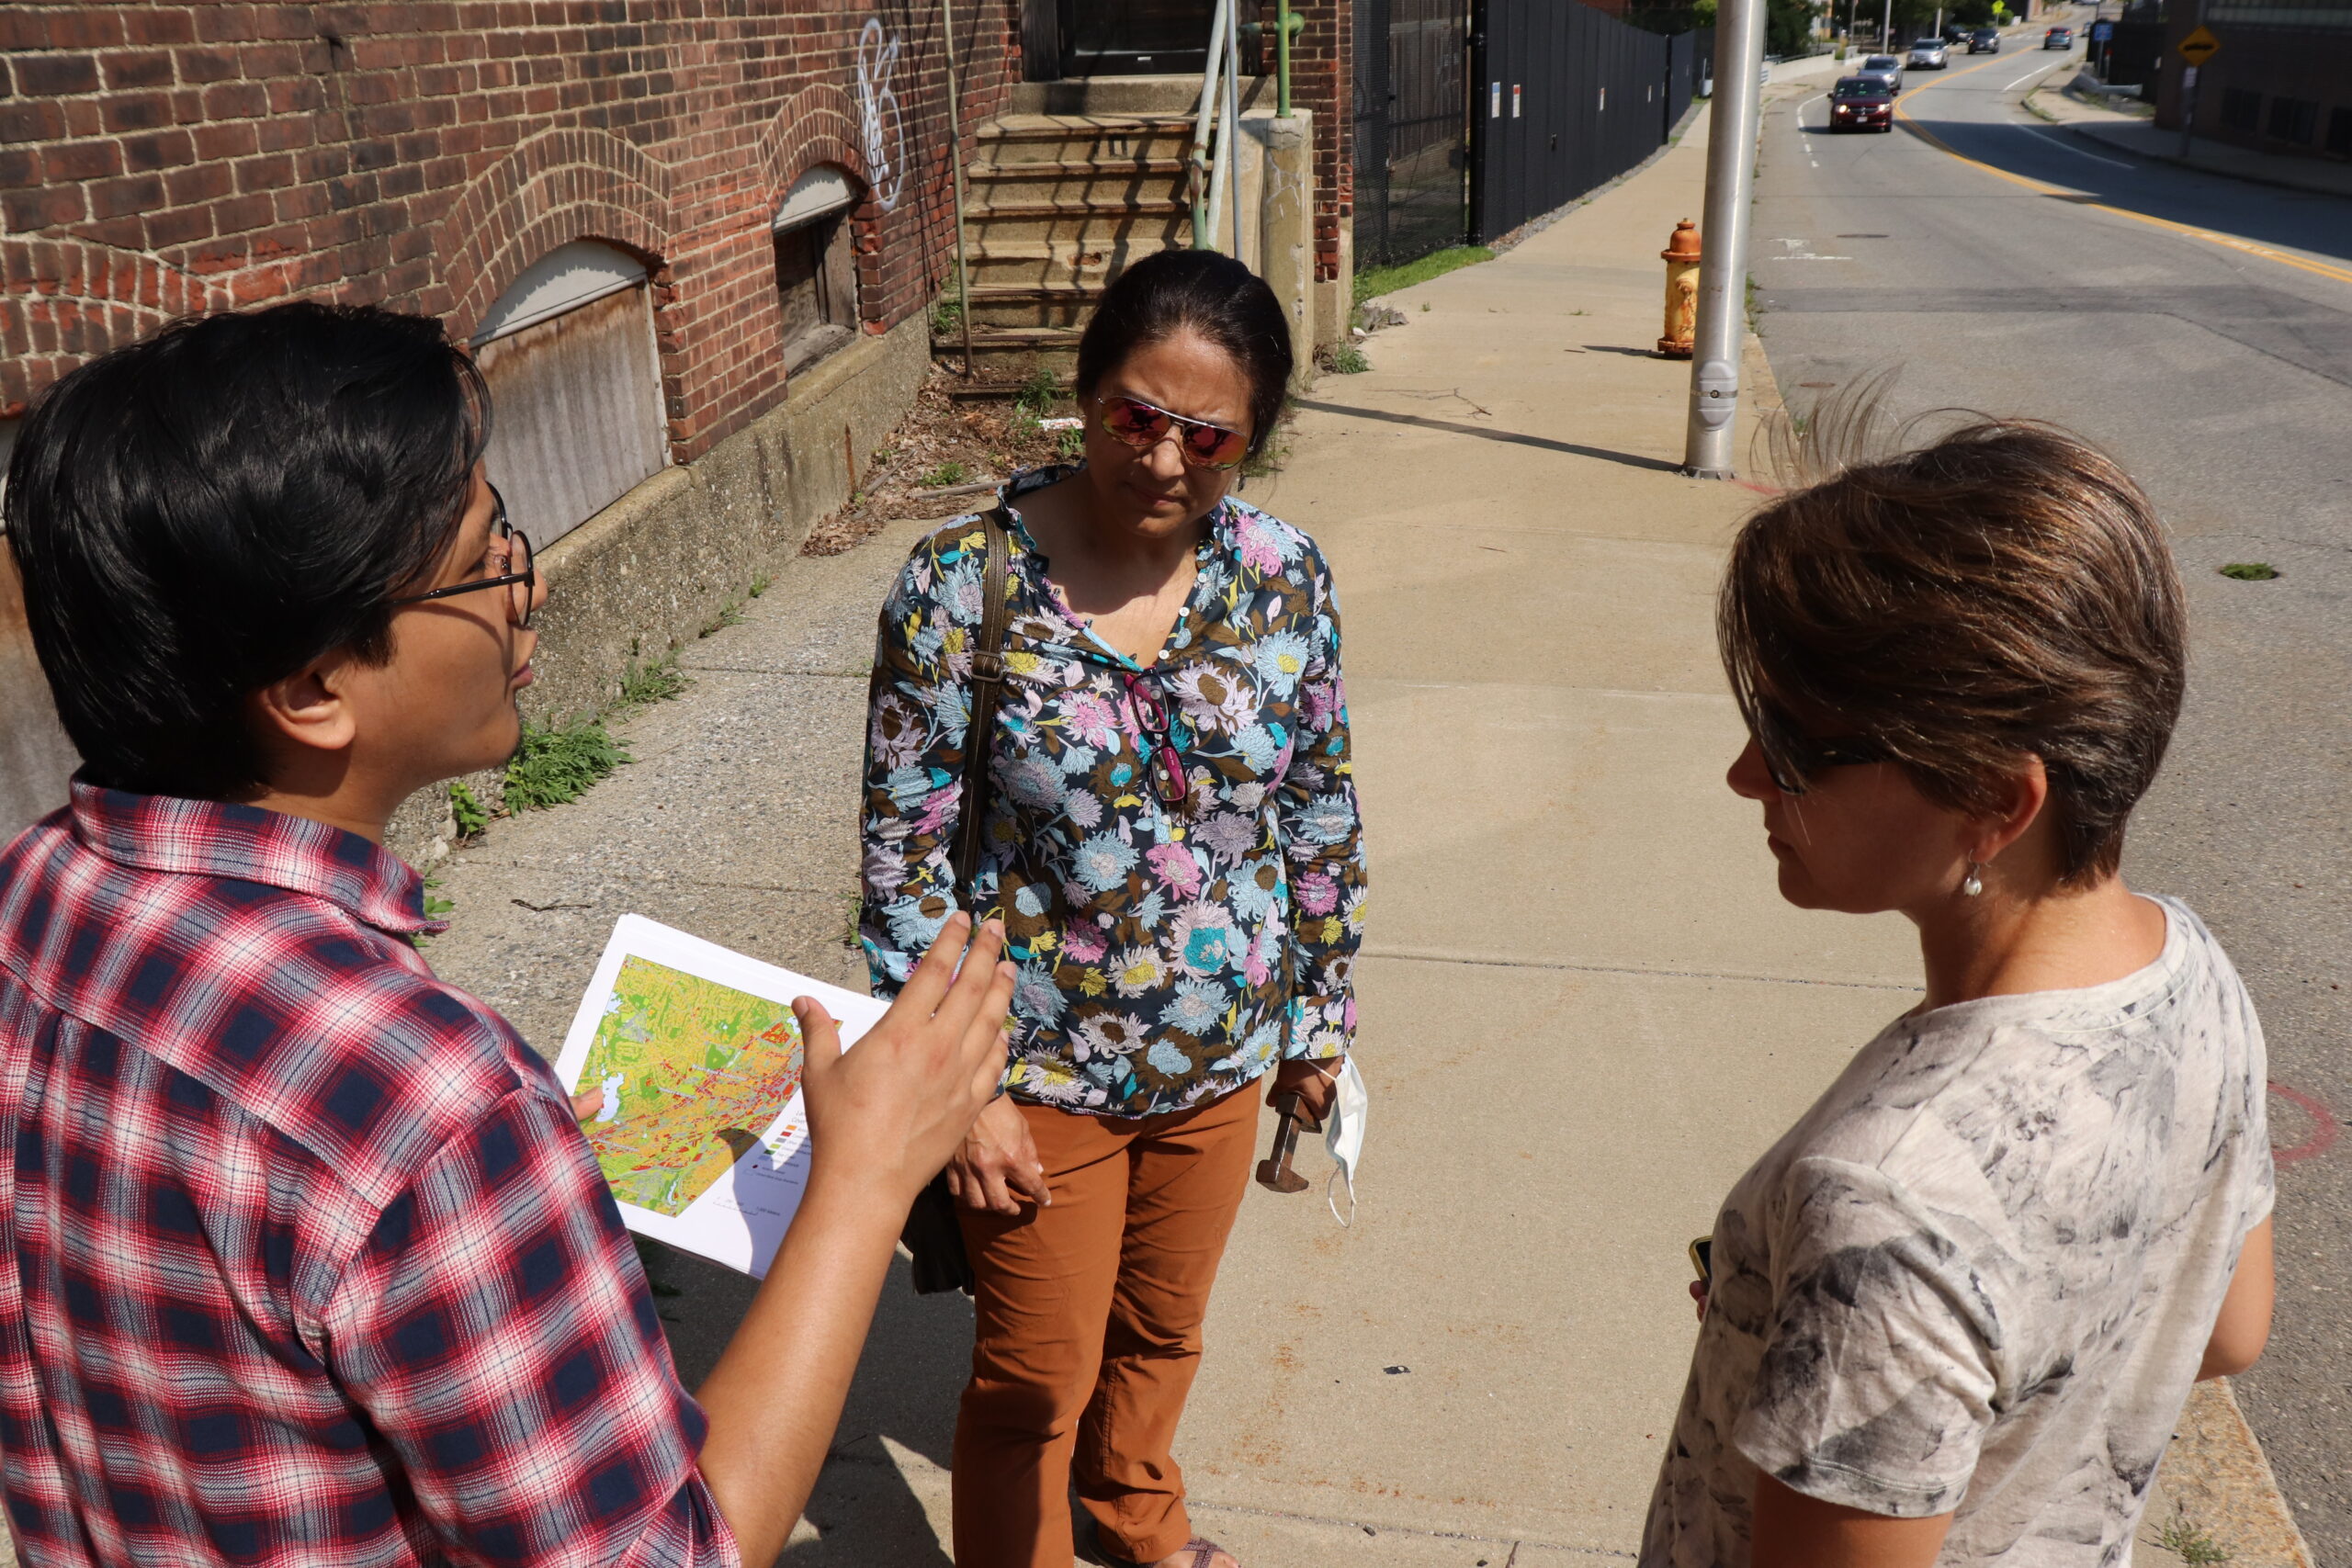
Arman Bajracharya and Dr. Rinku Roy Chowdhury (center) walk Woodwell’s Chief Communications Officer Dr. Heather Goldstone (right) through the dynamics affecting heat risk in Worcester.
photo by Sarah Ruiz
Mapping the Heat
Bajracharya used available satellite data to show the relationship between land cover and social vulnerability. Examining the imagery, he created an index of relative heat in the city. Areas with high tree cover correlated with lower land surface temperatures. He then overlaid social vulnerability and environmental justice datasets that index communities in Massachusetts based on socioeconomic status, minority status, primary language, and other demographic information.
“Throughout many or most U.S. cities, neighborhoods facing greater environmental risks (like heat waves, urban flooding, and hazardous wastes) were historically settled by poorer families or racial and ethnic minorities,” Bajracharya says. “And there really is a lot of evidence for communities of color, or low-income communities, continuing to be disproportionately exposed to risk.”
According to Bajracharya, the analysis showed a startling overlap between the hottest areas of the city and the most vulnerable. Neighborhoods classified as Environmental Justice Communities tended to have a lower percentage of green vegetation (especially tree cover), with higher average temperatures. The most vulnerable areas are clustered in the core of the city.
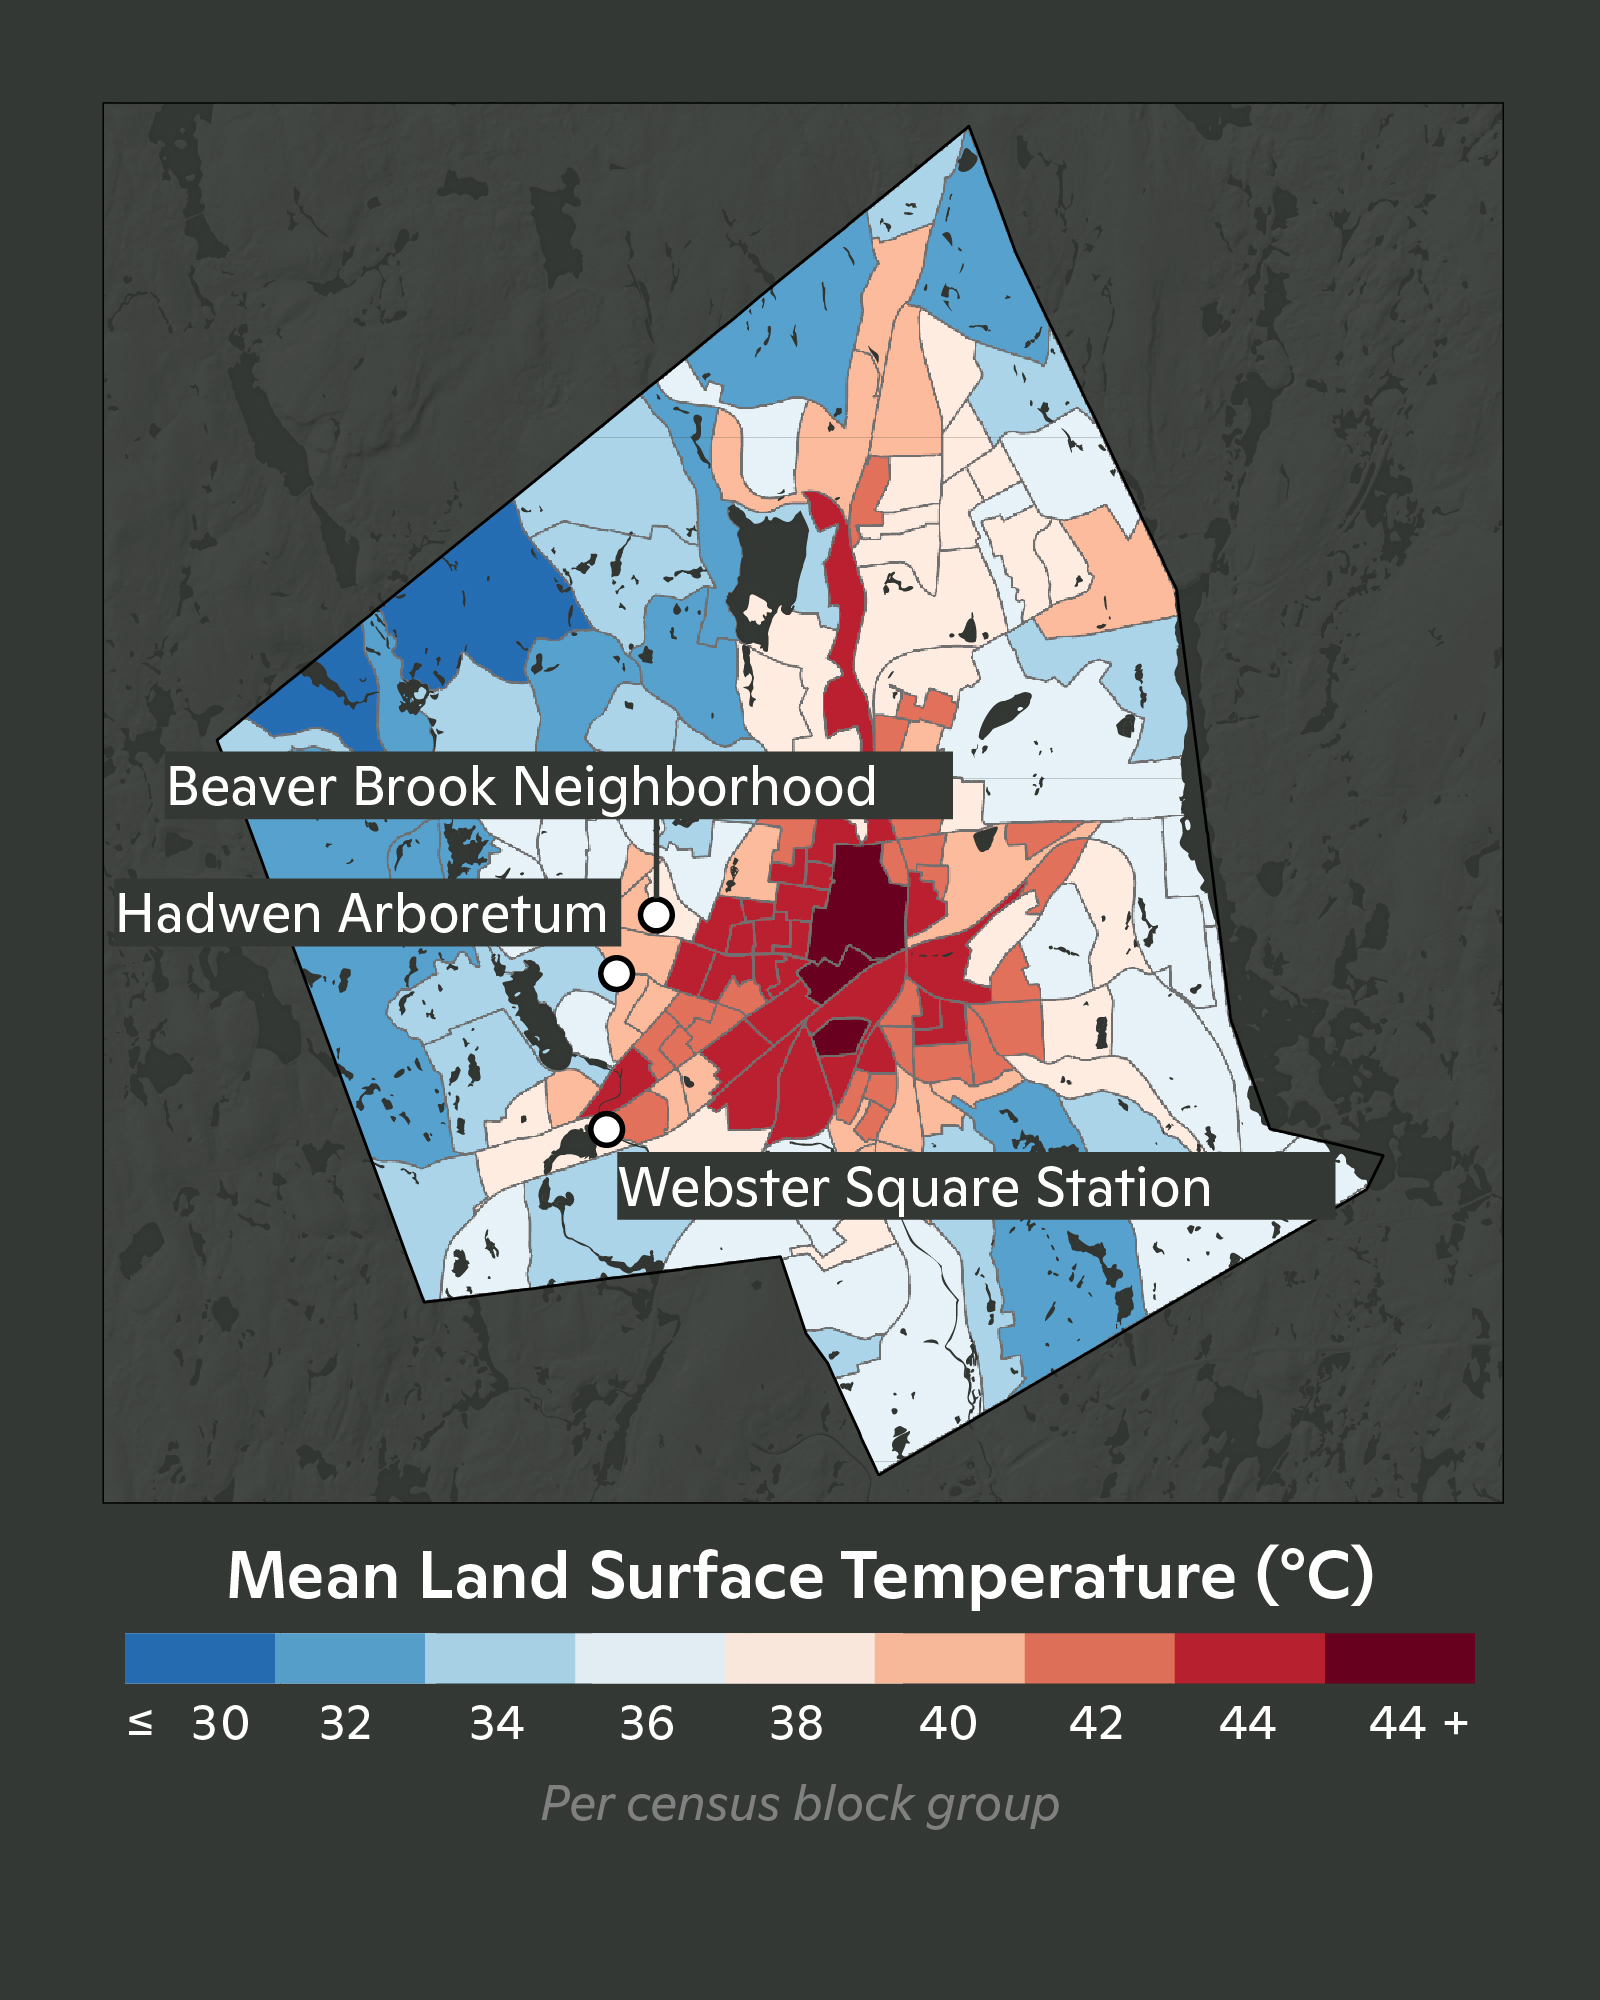
Land surface temperature by census block in Worcester. Bajracharya overlaid this data with data on land cover, land use, and social vulnerability to assess the city’s heat risk.
map by Arman Bajracharya and Carl Churchill
The satellite maps only tell part of the story, however, which is why Bajracharya and his advisor Dr. Rinku Roy Chowdhury have brought us out onto the streets of Worcester. A few blocks away from the millpond, a grassy field rolls out behind a chain-link fence. In Bajacharya’s maps, this appears as a patch of vegetation interspersed among the developed land uses. The field sits under metal towers belonging to a nearby power station.
Often, Dr. Roy Chowdhury reminds us, the “green” and “blue” spaces that do exist in vulnerable areas may be inaccessible to residents, either cordoned off as private property or unsuitable for use due to safety concerns or an absence of trails or paths. The sign on the chain-link fence here warns of danger from high voltage.
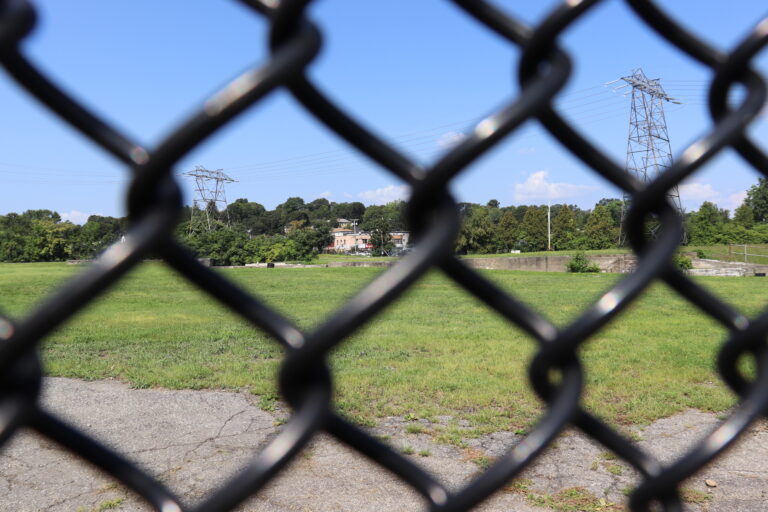

A patch of grassy landcover is locked behind a fence. The land belongs to a nearby powerplant.
photos by Sarah Ruiz
This is where the distinction between land cover and land use becomes important. Land cover refers to what is currently on the land—whether that’s forest, grassland, or concrete. Land use data shows how humans are interacting with an area of land. For example, an area of grassy land cover could be used for conservation, residential or commercial purposes.
When natural land covers such as trees and water bodies are present but inaccessible, it limits potential social co-benefits that green and blue spaces can offer. Beyond regulating temperature, these spaces can reduce air pollution and provide recreational opportunities. Bajracharya and Dr. Roy Chowdhury emphasize the importance of field trips like this one, along with more in-depth work to ground truth satellite image analyses in the local reality.
“There’s a really interesting mix of industrial and commercial uses interspersed with areas important for conservation and recreation that could also potentially help in bringing down surface temperatures,” Dr. Roy Chowdhury says. “Tree cover and water are really helpful for buffering against the urban heat island, but so much more needs to be done to understand and steward such ‘ecosystem services,’ especially in underserved areas of cities.”
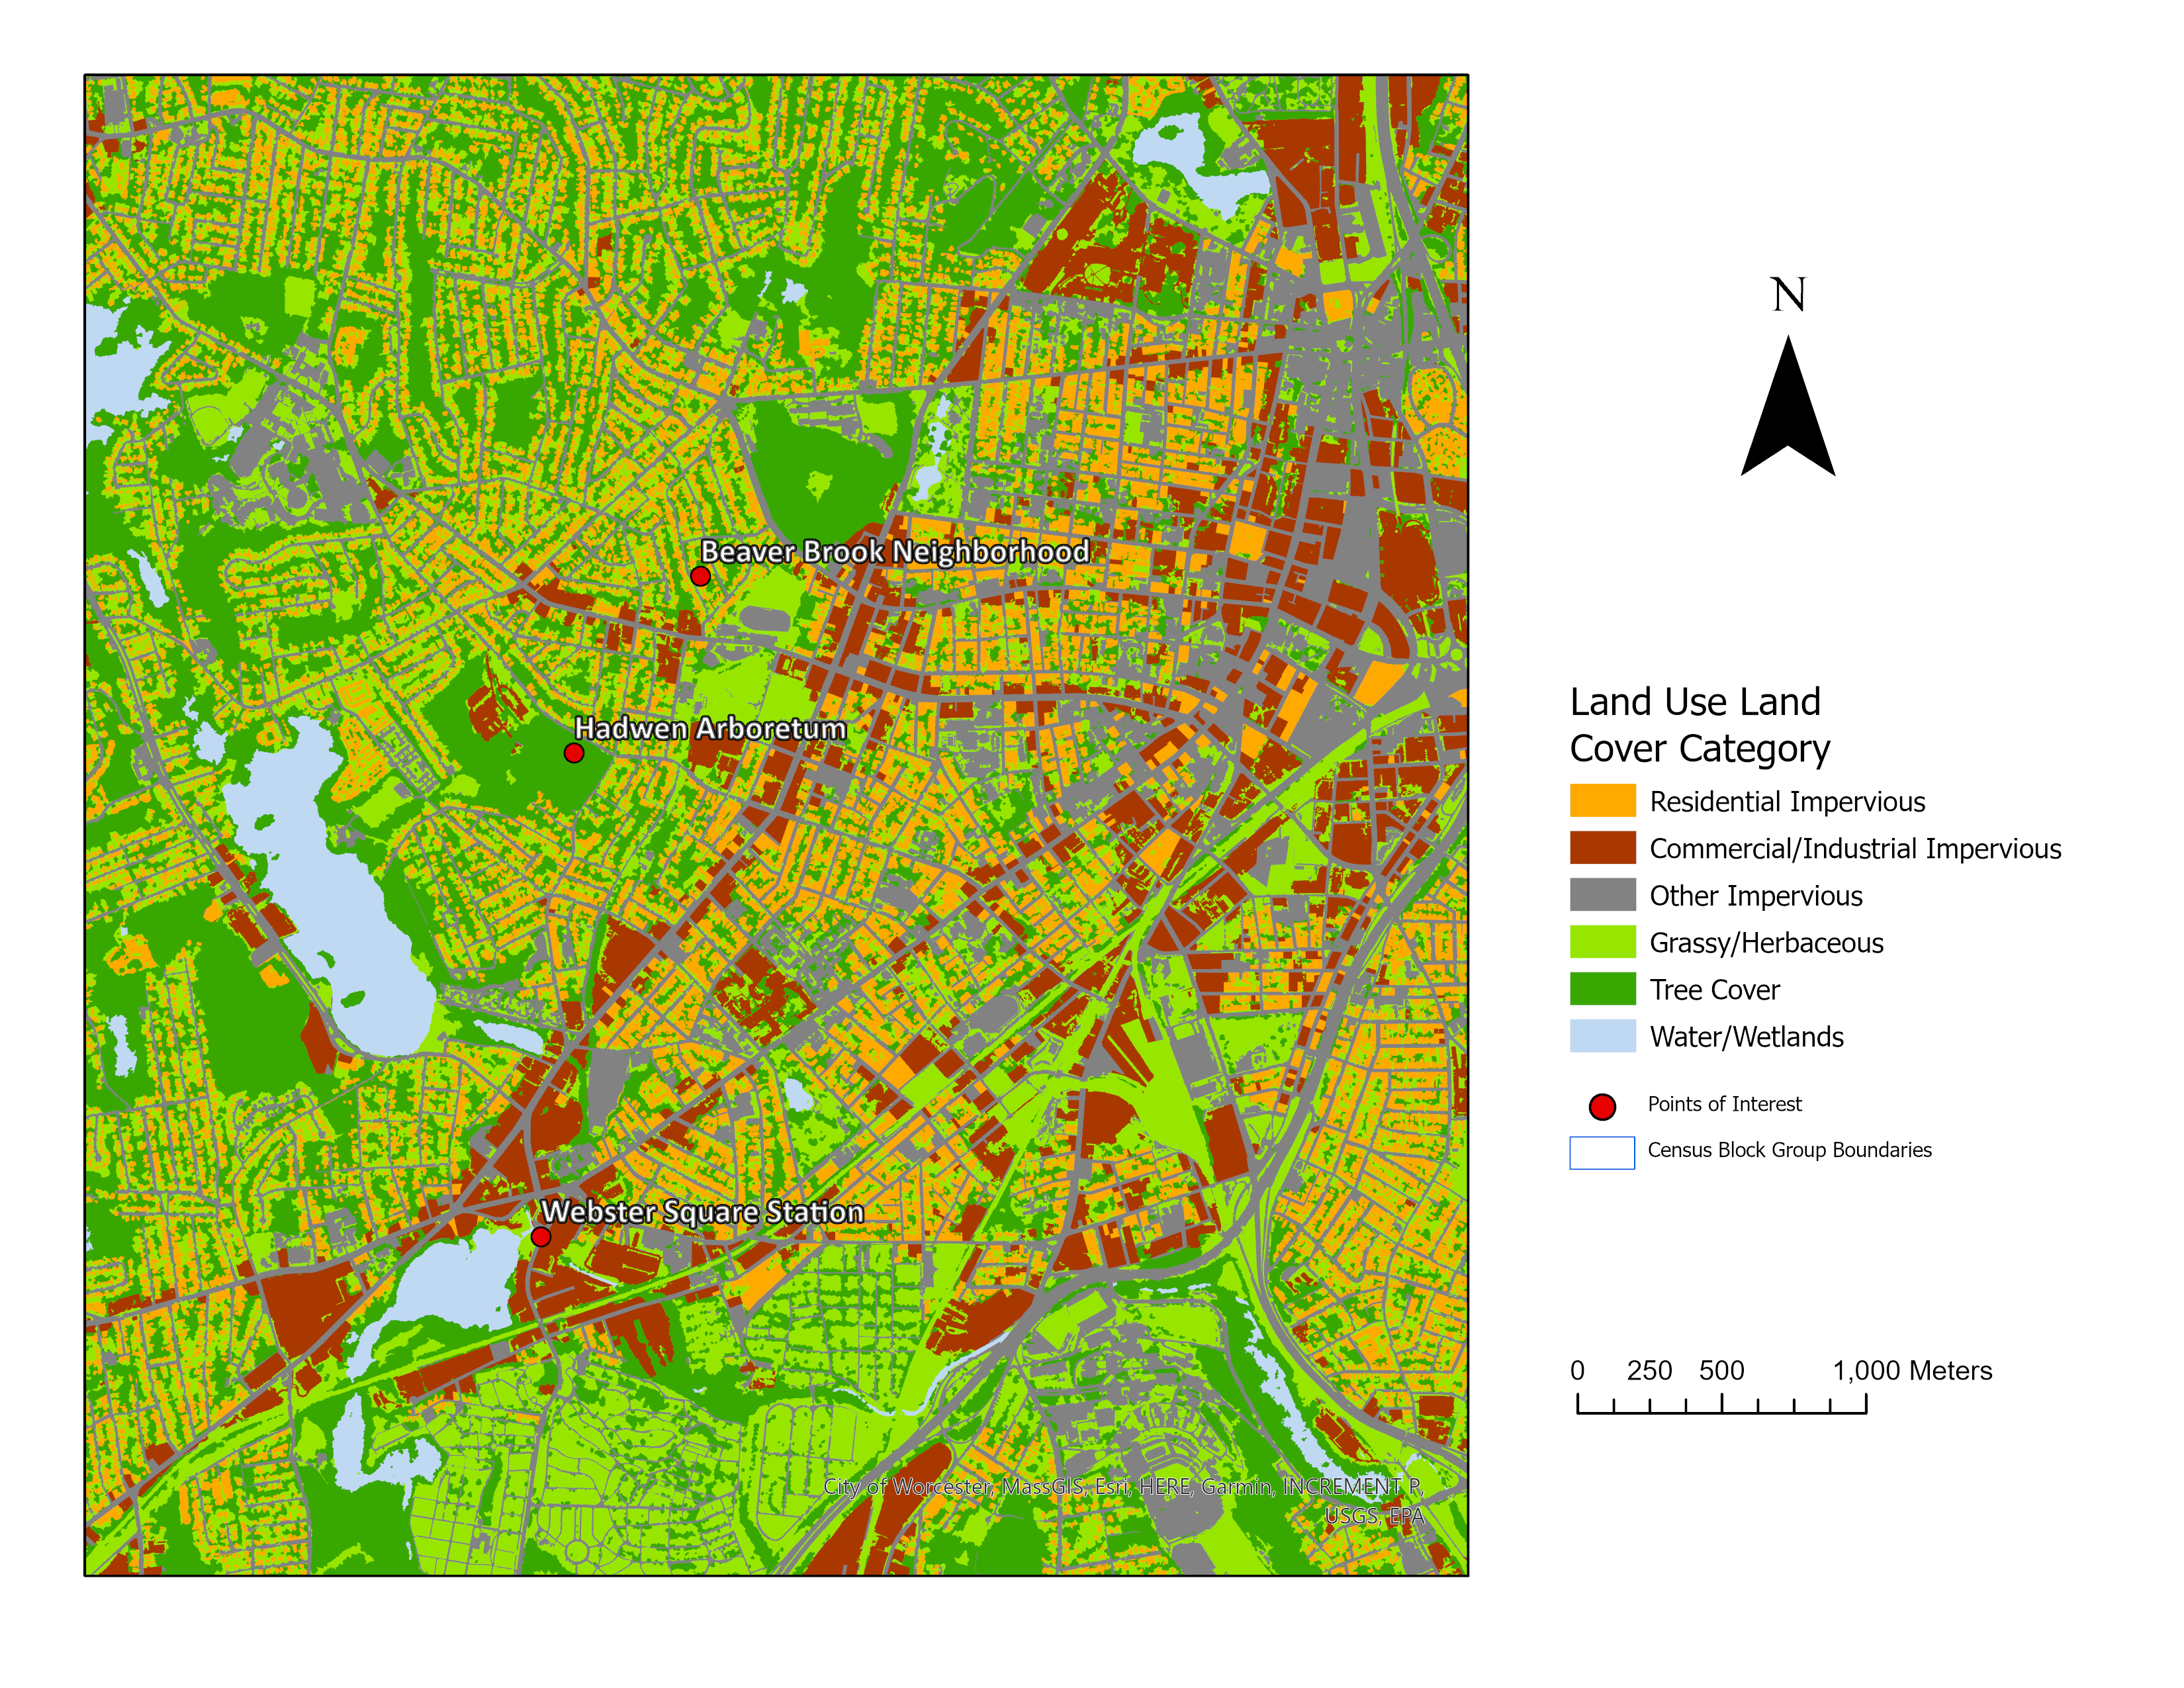
Land use and land cover in central Worcester.
map by Arman Bajracharya
Building an Emerald City
With climate change accelerating, every patch of green and blue on the map will become indispensable in regulating city temperatures. To prevent a crisis of infrastructure failures, heat-related illnesses, and even deaths from unfolding during brutal summers, cities like Worcester are going to have to get greener, faster—and do so in a way that benefits residents equitably.
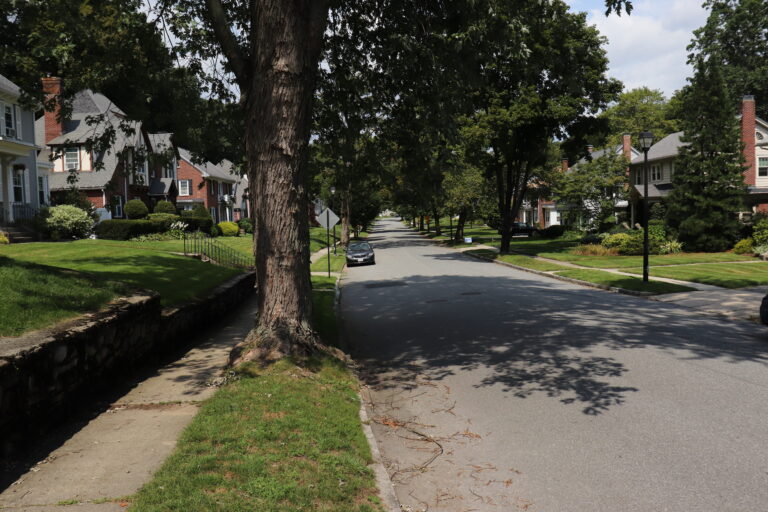
The presence of tree cover can make a huge difference in the temperature of a neighborhood and often correlates with social vulnerability. Here a wooded, affluent street contrasts with the hot pavement of Webster Square.
photos by Sarah Ruiz
Dr. Roy Chowdhury and Bajracharya are interested in investigating further to figure out the most promising pathways towards greener, more equitable cities. Questions still remain around finding the best proportion and distribution of land cover and implementation strategies that will improve environmental equity and encourage citizen participation. Woodwell’s Dr. Chris Neill has been collaborating with Dr. Roy Chowdhury and Clark University over the last decade to analyze land cover and ecological structure of urban vegetation in several US cities.
“Every tree makes a difference, but there are scale effects as well. What is the minimum threshold to make a difference? What’s the mix in different cities or neighborhoods? What do local residents value and want? These are really interesting and important questions to ask,” says Dr. Roy Chowdhury.
Research into the interactions between these green spaces and rising temperatures could help city planners make more conscious decisions about climate adaptation. Bajracharya says his future projects may also examine flooding risk in cities, which adds another dimension to potential inequities in climate risk. Future research could also incorporate social interviews in different neighborhoods to understand residents’ concerns regarding their environment, climate change, and quality of life.
The last stop on our Worcester tour is Beaver Brook Park—an example of what’s possible when a city decides to reinvest in its natural spaces. The neighborhood surrounding the park was a primary destination for Black Americans moving north after the Civil War and has a history as a vibrant minority community. The titular brook had been paved over years ago, running in darkness under the city until 1990, when it was daylighted again to serve as a central feature of the park.
Mural on a structure in Beaver Brook Park depicting the city’s East-West trail.
photo by Sarah Ruiz
The area is now a green haven for recreation in the neighborhood and a stop on Worcester’s East-West trail, which Dr. Roy Chowdhury describes as “an emerald necklace” running through Worcester—one of the ways the city and numerous environmental stewardship organizations are working towards broader greenspace protections and access.
The feel of the air here contrasts sharply with where we started the day—a hint of the power urban greenspaces hold. Despite the heat warping off the street pavement, in the shade of old oak trees by the gurgling brook, it’s easy to stop sweating for a moment and just feel the breeze.