Climate change is a massive problem, with far-reaching effects that touch every aspect of society. It’s also already here. The impacts long forecast by scientists—heat waves, droughts, encroaching sea levels, thawing Arctic ground, frequent storms, and wildfires—are being felt now by communities from Alaska to the Amazon. But these communities, throughout the hardships being thrown their way, are learning to adapt. While national and international climate efforts take small steps, towns and cities are striding forward, building resilience through community engagement, urban planning, and advocacy.
What resilience looks like is different in every community. It is defined by each place’s unique challenges and ways of life. It requires creativity, trial and error, and unwavering persistence. These five community leaders share lessons learned from lives spent anticipating oncoming obstacles, finding and inventing solutions to each new challenge, and cultivating resilience in the face of climate change.
Resilience is… Proactive planning and learning from others.
Dale Morris
Former Chief Resilience Officer for the City of Charleston, SC and Climate Adaptation Consultant.
Charleston is a coastal city that floods on average 70 days in the year. When Woodwell Climate reached out to offer a free climate risk analysis as part of the Just Access project, Charleston was in the midst of their own comprehensive water plan. Morris recognized the need for expanded risk modeling for the wider County of Charleston, which encompasses three of the four largest cities in South Carolina, and whose upstream flooding risks were less understood but already impacting downstream communities. He facilitated the project, which modeled flood risks out to 2080.
“In the City of Charleston we weren’t at all surprised, but when we shared the results with the other cities, everyone was like ‘whoa, this is worse than we thought.’ Floodplain inundation from rainfall was a big part of it. And when you factor in sea level rise at the outfall of creeks and rivers, there’s less drainage capacity. Where does the water go?”
For Morris, understanding risk is a crucial first step towards building a resilient community. The next is putting that knowledge to use. In Charleston, city and county officials have used the Woodwell report to apply for grant funding to further improve stormwater management.
Though the risks can sometimes seem daunting, Morris says learnings from other communities, even those many thousands of miles away, can offer inspiration and guidance. Earlier in his career, Morris managed outreach for the Dutch government in the United States, helping apply learnings from the Netherlands to community flood programs.
“The Dutch, by necessity, have to know how to live well with water, with the use of different approaches—hard engineering, soft engineering, good spatial planning.”
Morris was at the Dutch Embassy when Hurricane Katrina hit New Orleans in 2005. Seeing the devastation there affirmed his belief that planning and governance also play a huge role in how well a community can recover from a disaster.
“I saw very clearly this was a failure of government and governance at all levels. The economic disruption, the family disruption, the devastation across wide swaths of New Orleans and along the Mississippi coast, it made me mad, and it motivated me to do more.”
“More” means more planning, more foresight, tackling future risks before they happen, and pursuing projects that produce multiple benefits.
“These are generational kinds of recoveries. We should think about proactive investments, not reactive responses.”
A resilient Charleston looks like: Clear future flood risk assessment, adaptive management plans for residents in flood zones, smart new development that can receive moving residents, city infrastructure planning that adapts to changing future conditions
Resilience is….Changing mindsets and changing economies.
Ben Robinson
Martha’s Vineyard Commission member and founder of the MVC Climate Action Task Force.
The island of Martha’s Vineyard can be a place of strong contradictions. Transient vacation-goers share the beaches with life-long residents. Multimillion dollar homes are being constructed while local workers struggle to find affordable housing. Rural fields border suburban neighborhoods which, in turn, border both forests and salt marshes.
These complex dynamics are what Robinson grapples with as he leads the island’s climate adaptation planning efforts. As a member of the Martha’s Vineyard Commission, he aided the creation of a climate action plan to identify areas of work across sectors, from food security to transportation. Woodwell Climate worked with the Commission to produce an assessment of the Vineyard’s drought, precipitation, and wildfire risks, as well as a study of existing carbon stores on the Island.
According to Robinson, the Vineyard faces not only increasing climate risks but also challenges in creating the needed social changes for adaptation.
“The social change piece is the one that’s really been the most frustrating, because it entails sacrifice. It entails recognizing the privileges that we’ve had and we still have and taking on a global responsibility.”
One of the trickiest areas to tackle has been the island’s main economic driver: tourism. Summer months are extremely popular with wealthy tourists, and much of the island’s infrastructure is built to serve this influx of temporary residents.
“The Vineyard is really catering more and more every year to a wealthier and wealthier constituency. And they demand more services, more things, a different feel. And that level of over-consumption is one of the primary drivers of climate change.”
It has also made life harder for ordinary residents, driving up property values to an untenable degree, forcing much of the labor force to live off-island and commute.
“Those are really poor trends for a community that wants to be resilient.”
Additionally, reliance on imports undermines food security for residents. Currently, close to 95% of food has to be imported from the mainland.
“Right now there’s no way we would survive without the supply chain to the island, which has just become more and more intertwined with our everyday lives.”
The Vineyard is working to improve its food security by producing more on-island through agriculture and foraging. And despite the challenges in other areas, Robinson reminds himself that the best thing he can do is just keep chipping away at the problem.
“It’s easy to be frustrated in this kind of work, but this is a multi-generational change. I’m only going to see one period of it, and then somebody else is going to pick it up. This is just going to be a slow process of evolving our community. If we can do it right, we’ll be better off in the future.”
A resilient Martha’s Vineyard looks like: A robust, electrified public transit system, a diversified economy with a non-extractive tourism industry, locally produced food, offshore wind
Resilience is…A holistic approach to conservation.
Alexis Bonogofsky
Director of the Sustainable Ranching Initiative for World Wildlife Fund and Yellowstone County Planning Board member.
Being a rancher on the Northern Great Plains can be challenging. Profit margins can be low. Markets can be uncertain. And then there’s the increasing droughts and unpredictability of precipitation caused by climate change. As a resident of Billings, Montana who runs her own family sheep and goat ranch, Bonogofsky is acutely aware of these challenges.
“The larger Northern Great Plains is definitely experiencing impacts from climate change already. Our winters are getting warmer, so we have less snow pack, and we have less water going into the growing season and into the summer.”
Bonogofsky works on programs at World Wildlife Fund (WWF) that provide funding support and guidance for ranchers pursuing regenerative grazing practices which can make ranches more resilient to climate change. Woodwell Climate partners with WWF to analyze ecological data that can help inform those practices and model future outcomes based on changes in land management. When properly managed, grazing animals can actually help mitigate climate change as well, promoting the growth of native plant species that lock away carbon in their deep roots.
“When you think about iconic Western wildlife, grassland ecosystems are where they thrive and where their best habitat is. Ranchers are managing a lot of grass, and the healthier the grasslands are, the more wildlife we have and the cleaner water we have. Grasslands also sequester a lot of carbon, so healthy grasslands that stay intact are necessary to help mitigate the effects of climate change.”
To improve management practices and achieve healthy grasslands, Bonogofsky says, you have to employ solutions that address the entire system holistically— and that includes the people.
“For resilient communities and ecosystems, you can’t separate the people from the land.
For the land and wildlife to be healthy, the people in those communities have to be healthy too.”
That means conservation work isn’t always just protecting plants or animals. It’s also working with community groups to improve housing options in nearby towns or setting up daycare services for ranching families. Strengthening communities, Bonogofsky says, makes people more likely to stay and invest in a place, to do their part in making it better.
“I do this work because it matters. I have a niece and nephew and I want to say to them that I did everything I could to try to make the place better—a place where people can thrive in the future. I’m surrounded by people every day that are making a difference in their communities. And I think if we all do that where we’re from, we actually have an impact.”
Resilient rangeland communities look like: Diverse and intact native grasslands, ranches that are profitable while storing carbon and maintaining ecosystem services, rural communities with services like daycare, housing, and healthcare
Resilience is… Getting creative with your resources.
Sean Hogan
Environmental Sustainability Manager for Barnstable, MA
Hogan’s job is to care about everything climate change, energy, and emissions-related in the town of Barnstable, Massachusetts. He works with the municipal government to identify and pursue funding for projects that could help the town adapt. Barnstable, the largest town on Cape Cod, is one of several Massachusetts communities for which Woodwell Climate conducted a risk assessment, modeling flood risk and stormwater system vulnerability.
Because of his position, Hogan has a clear view into the challenges faced by municipalities in regards to climate resilience. Funding is often short, offices understaffed, and public opinion hard to sway. Hogan has found the best way through is to chase opportunities that combine immediate positive impacts with long-term climate benefits.
“So far, I’ve found in municipal work you have to work opportunistically as to where grants might be available or where there’s institutional interest. We have a finite amount of resources, and if we can husband those resources appropriately, we can spend them in ways that serve the public good.”
Hogan uses the example of electric vehicles, which reduce emissions from transportation, contributing to long-term climate mitigation as well as reducing air pollution for residents in the near term.
“[Climate change is] a problem that’s uniquely designed to foil humans, because we have a hard time grasping those kinds of slow-moving crises. So you either have to change people’s minds, or you find projects that fit into a more favorable psychology.”
Funding opportunities for adaptation projects of all kinds have also become more uncertain with a federal administration slashing climate programs.
“We’re having to come to terms with the change in administration and the financing landscape. We’re gonna have to navigate this period by being a little bit cautious and we’re going to have to become more creative and keep a closer eye on the bottom line so we can create the savings necessary to fund more.”
Resilience will also involve building positive relationships, which for Hogan have been crucial to moving work forward.
“Relationships are important for everything— for building political support, access to resources, expertise, and different perspectives.”
A resilient Barnstable looks like: Electrified systems that don’t depend on fossil fuels, loan programs to help homeowners install solar and resources for renters looking to lower energy bills, public projects that offer both immediate and long-term benefits, dedicated staff time to pursue climate and sustainability solutions.
Resilience is… An uphill battle with a wildfire behind you.
Brooke Woods
Climate Adaptation Specialist for Permafrost Pathways and Tribal Citizen of Rampart, AK.
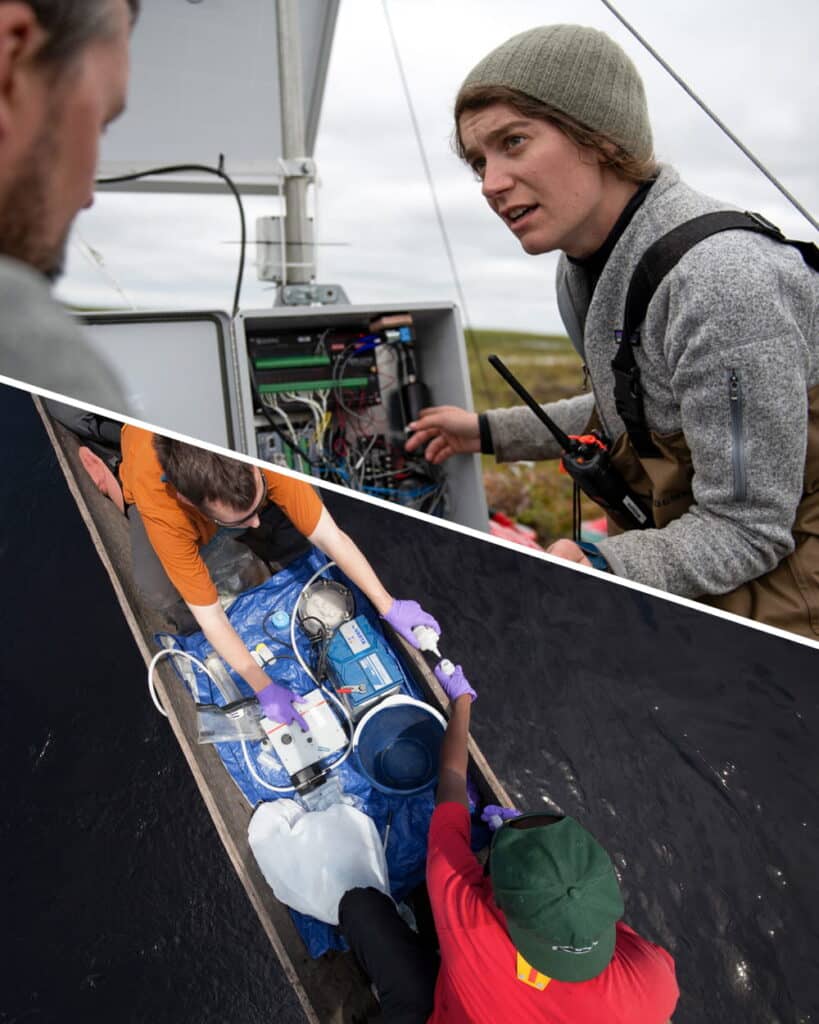
Woods’ hometown of Rampart, Alaska is a small fishing village on the Yukon River. Here, Alaska Native residents practice a subsistence lifestyle of hunting, fishing, and living off the land. Rampart, like many communities in interior Alaska—and across the Arctic—is feeling the impacts of the warming climate now.
The Arctic is one of the fastest warming places on the planet, and as it heats up, permafrost, or perennially frozen ground, upon which many villages are built, is thawing. This can lead to erosion, ground collapse, and infrastructural damage. Woods’s role on Woodwell Climate’s Permafrost Pathways project is to use her policy expertise to help Tribal partners navigate the tricky landscape of federal and state agencies and funding, as well as uplift tribal sovereignty.
On the Yukon River, one of the biggest concerns is the complete collapse of multiple salmon species. Salmon are suffering heat stress from increased water temperatures, changes in the marine environment, overharvest from bycatch in federal and state fisheries, and competition from hatchery-produced fish.
“We have not been able to fish for five years with an expectation that we will not fish for seven more, and that is a climate and cultural crisis.”
Losing access to these fish cuts off Tribes from a traditional cultural practice as well as a critical food source. Both state and federal agencies are involved in managing fisheries in Alaska, and while there are options for consultation, there is no deference to Tribes in decision making.
Additionally, the threat of permafrost thaw places Tribes in an emotionally challenging position. Community members must decide whether to relocate their villages or stay and shore up crumbling infrastructure, with little guidance or support from government agencies.
“There is no adaptation framework for the crisis tribes are in when it comes to relocation. One big hope of this project and working with our Tribal liaisons is developing that [framework] in any stage. That would be a big success.”
The fight for deference, respect, and resources has not been an easy one. Woods compares it to escaping a wildfire to face an uphill climb. But her people’s history of resilience—of maintaining their connection to the land over 10,000 years in Alaska—gives her strength.
“You get out of the wildfire and you make your way up, and it’s a constant fight. Our ways of life are so connected to our ability to hunt, fish, and gather that Tribes are willing to continue this good fight. When it comes to advocating for our ways of life, our people are so humble and working tirelessly.”
A resilient Yukon River community looks like: Healthy salmon populations, stable permafrost, legal deference to Tribes in decisionmaking around natural resources, federal and state support for relocation, continued traditional ways of life
This year, Las Vegas, Nevada broke its all-time heat record, reaching 120° F.
The temperature was recorded at Harry Reid International Airport on July 7, 2024. That week, between July 6 and July 12, was the new hottest 7-day period on record, with an average high temperature of 117.5° F.
This is the daily reality for Vegas residents in the summer. Record-breaking temperatures are hard to bear, but so were all the hot days and nights that came before. Commuters frequently see temperatures above 120 flash on their vehicle dashboards, and outdoor workers struggle to do their daily tasks under the hot sun.
“There’s a disconnect between climate science and the people who live here,” says Woodwell Climate Research Associate, Monica Caparas. “Vegas residents know our summers are hot and unbearable. Understanding climate change is driving the extreme weather we’re experiencing is where the disconnect lies. ”
Caparas moved to Las Vegas as a child. She grew up there, left for college, and returned to settle into her adult life. Today, she works for Woodwell Climate’s Risk team remotely from her home in the city. Caparas knows the ins and outs of local life. These include Vegas’s rapid population expansion, the groups of people experiencing homelessness sheltering in underground stormwater infrastructure, and the heat that was unbearable before it started making headlines.
Experiencing climate change without shelter
Caparas’s work with the Risk team aims to provide communities like Las Vegas with an accurate picture of the climate-driven changes in their future. These “risk assessments” are provided through Woodwell Climate’s Just Access program, which uses the most accurate climate models, in collaboration with local knowledge, to anticipate future community safety threats. The analyses have brought to light growing threats from flooding, heat, storms, and more. The team provides assessments, free of charge, to states, cities, and countries across the world.
Just Access serves what Risk Program Director Christopher Schwalm calls “frontline communities.” The term describes groups of people who are over-exposed, under-resourced, underserved, historically marginalized, and therefore the most at-risk to the repercussions of climate change. In the risk assessment for Las Vegas, people experiencing homelessness are front and center.
“Between May 20th and the first week in July, about 20 people who were experiencing homelessness died of heat,” says Dr. Catrina Grigsby-Thedford, Executive Director of the Nevada Homeless Alliance (NHA) and community partner in Las Vegas.
The NHA estimates that almost 8,000 people are experiencing homelessness on any given night in southern Nevada. The number is only growing. Grigsby-Thedford says that this year’s unhoused population is up 1,300 people compared to 2023.
“Often our shelters are full,” Grigsby-Thedford says, “We’re limited by shelter beds and space.”
The NHA’s shelters do open all day in extreme heat, but so many people packed tightly together is still unsafe.
With nowhere to go, some seek shelter underground in Las Vegas’s stormwater infrastructure. While the tunnels are cooler out of the sun’s reach, they are at risk from flooding. Across the region, extreme precipitation is expected to increase by 12-14% by 2050, raising flood risk in the city and especially within the tunnels.
To combat lack of space and shelter, the NHA hosts 4-8 one-stop resource fairs per month. The events, called Project Homeless Connect, serve both people experiencing homelessness and low-income residents in Las Vegas. Grigsby-Thedford says these events “fill in gaps”—offering housing assistance, medical care, hygiene care, and other resources.
Despite all of this work, many unhoused people are hesitant to engage with organizations like the NHA. Grigsby-Thedford says “choice is often a challenge,” and that when people grow accustomed to the way things are, they often accept it and choose to stay.
Picturing risk
Building trust with communities, especially those predisposed to mistrust outside actors, is essential in this work. Which is why, Schwalm says, Woodwell Climate approaches risk work with the goal of “meet[ing] people where they are.”
That means “scoping,” the team’s word for listening to what community and government leaders want out of the risk analysis—what concerns they have, weak points they’ve identified, and what help might be needed post-analysis.
“Two-thirds of the time we spend from start to finish falls into this scoping idea, rather than doing analysis itself,” Schwalm says.
Scoping frames the data the risk team collects, as well as who their partners will be during the risk analysis process.
“We find people who are practical and recognize that there’s a problem,” Schwalm says, “We only work with communities who want to work with us.”
Following the scoping process, the Risk team compiles an analysis of extreme weather events and subsequent risks each community will face as climate change progresses.
“We perform a stress test of that particular geography to identify weak points,” Schwalm explains.
Then, the Risk team uses the most up-to-date climate models possible to predict changes in extreme weather and regional climate. By using predictive models, the team focuses efforts on what the future will hold, as opposed to using past strategies.
“We need to use the future to predict the future,” Schwalm says simply.
Making climate risk data accessible to all
Over the past three years, Just Access has provided 50 communities—that’s about a quarter billion people—with risk analyses. These communities span the U.S., Central and South America, Africa, Asia, and Oceania. They’ve worked with countries, like the Democratic Republic of Congo, where they helped update the country’s National Adaptive Plan, states like Chiapas in Mexico, groups like Cree Nation in Canada, and other communities, now including Las Vegas.
Despite all of this work, though, Schwalm says there is still room to grow.
“Fifty communities is kind of only a drop in the bucket,” he says, “We’re not going to make a huge dent in this unless we move beyond working community-by-community.”
Two major roadblocks for Just Access are finite resources: time and money. Individual risk analyses require a lot of time and communication to address risks in relatively small areas.
The other obstacle, money, is something climate research could always use more of. Grants and donations are crucial in order for analyses to remain free, and those sometimes come with limitations.
“There’s a tension from the funder to work in a specific geography sometimes,” Schwalm says, “It’s a juggling act.”
Climate change can also be a politicized topic. In order to meet people where they are, sometimes the Risk team implements changes in language used to communicate with community leaders. This can be a change as simple as using “extreme weather” instead of “climate change.” As long as everyone in the room is ready to confront what the future holds, they’re all working on the same page towards the same goal.
“We’ve done red states, blue states, rural, urban,” Schwalm continues. “We’ve learned how to read the room.”
Creating the foundations for change
Woodwell Climate’s involvement in Las Vegas brings to light the way justice issues, like homelessness, interact with growing threats from climate change.
“In the Las Vegas risk assessment, we are focusing on the disproportionate impacts of the climate crisis on communities already facing systemic socio-economic inequity,” says Caparas. “We must think about intersectionality in order to address climate justice.”
Not only does climate change represent a current crisis for those experiencing homelessness, communities with fewer resources are now at greater risk of being made homeless by future climate-related disasters. Accurate climate risk information can support organizations like NHA as they develop strategies to serve people experiencing homelessness in a more extreme future.
Grigsby-Thedford says that NHA members, especially those with lived experience of homelessness who work as Lived X Consultants, are always looking to be involved in projects like the one Caparas leads.
“We always talk about weather in our meetings,” she says, “So this is perfect, someone’s actually doing research about this. Anything that impacts [Las Vegas’s homeless population], we want to make sure we’re involved in that.”
For the Las Vegas risk assessment, Caparas is working with the NHA and Southern Nevada Lived X Consultants to understand climate risks around cooling stations in public buildings, which are a vital, air-conditioned shelter when the heat index is too high. Grigsby-Thedford says there were many more cooling stations in 2023 and 2024 compared to previous years.
Caparas also forged a connection with Miguel Dávila Uzcátegui, Southern Nevada’s Regional Transportation Commission (RTC) Senior Planner and board member of Help Hope Home. Together, they are developing a database of flooding infrastructure and updating the city’s flooding model with future climate projections. The RTC will integrate the Risk team’s model into regional planning work, updating Las Vegas’s flooding and transportation infrastructure for community safety.
None of this work would have been possible without Caparas’s diligent bridge building between the scientific resources of Woodwell Climate and the needs of people in her own community. Those connections allow science to be informed first and foremost by those most affected by climate change.
“The people closest to the problem are the people closest to the solution,” says Grigsby-Thedford.
We can all agree 2023 was a weird year for weather, right? The United States set a record for the number of billion dollar weather disasters. A major Amazon River tributary reached its lowest water levels in a century during extreme drought. Extreme rain in Libya caused two dams to break, destroying homes and killing over 4,000 people.
And then, of course, there was the heat. 2023 was the hottest year on record. Countries around the world saw heat records fall month after month. The Arctic was hot. The ocean was hot. And debates swirl on about whether we’ve already passed critical warming thresholds.
So how do we put 2023 in context of the greater trend of warming? Here’s what some of Woodwell Climate’s scientists have to say about last year’s record-breaking events.
Did the models predict this?
The dramatic scenes of heat and extreme weather last year prompted many to ask why temperatures had seemingly spiked way above the trend line. Was this unexpected? Was it out of the range of what scientists had modeled? Woodwell Senior Scientist, Dr. Jennifer Francis says not entirely.
“Almost exactly a year ago,” says Francis, “we had just come out of three years of La Niñas and we came close to breaking global temperature records then, even though La Niñas tend to be cooler than neutral or El Niño years. And then along came the strong El Niño of 2023.”
El Niño and La Niña are two extremes of a natural phenomenon that impacts weather patterns across the Pacific, and around the world. In an El Niño year, the prevailing trade winds that normally push warmer waters into the western tropical Pacific—allowing cooler water to well up along the western coast of the Americas—are reversed, resulting in hotter ocean surface temperatures in the eastern equatorial Pacific. When the ocean is hotter than the air above it, that heat is released into the atmosphere, often making El Niño years record breaking ones for global temperatures.
“Last year’s spike looks a lot like the last big El Niño event in 2015-2016. It’s just that now the whole system is warmer. So to me, it wasn’t at all a surprise that we smashed the global temperature record in 2023,” says Francis.
The spike put global temperatures far above the average of climate model simulations, but that doesn’t mean the models didn’t account for it. Risk Program Associate Director, Dr. Zach Zobel, says that averages tend to smooth out natural year-to-year fluctuations, when in fact the upper and lower ranges of model predictions do encompass temperatures like the ones seen in 2023.
“It was well within the margin of error that you would expect for natural variations,” says Zobel.
How does ocean heat impact the climate?
One element of last year’s heat, one that wasn’t necessarily forecasted, was the simultaneous appearance of several ocean heat waves around the globe. The ocean absorbs the vast majority of heat trapped by greenhouse gasses, and that heat can be released under the right conditions. El Niño is one example, but in 2023 it coincided with other not-so-natural marine heat waves across the world.
“In pretty much every single ocean right now there are heat waves happening, which is something quite new,” says Francis.
A couple of dynamics could be driving this. One possibility is that, after three years of La Niñas, in which equatorial Pacific ocean temperatures were generally cooler than the air, the ocean simply absorbed a lot of heat, which was then primed to be released in an El Niño year. Another, Zobel suggests, could be recent shipping laws that required shipping vessels to eliminate sulfate emissions by 2023. Sulfates are a pollutant that may have been helping bounce back solar radiation, hiding the true extent of warming.
“Usually when there’s an El Niño, the eastern tropical Pacific is very warm, but it doesn’t actually drive up ocean temperatures everywhere,” says Zobel. “That was the biggest surprise to me: how warm the northern hemisphere of the Atlantic and Pacific were for most of last year and into 2024.”
Ocean heat waves are typically long-lived phenomena, lasting many months, and so can be a useful tool for meteorologists looking to predict 2024’s extreme weather events.
“The good news is that it provides some kind of long-term predictability about weather patterns in the upcoming year,” says Francis. “The bad news is that they tend to be unusual weather patterns, because those ocean heat waves aren’t usually there.”
Will next year be hotter?
So are we in for another, hotter year after this one? Risk Program Director Dr. Christopher Schwalm says it’s likely.
“Warming predictions for 2024 from leading scientists all forecast a higher level of warming this year than last year,” says Schwalm.
Already, March 2024, was the 10th month in a row to break temperature records. Zobel says it’s typical for the year following an El Niño peak to maintain high temperatures.
“Because the ocean spent a good amount of the year last year warmer than average, that energy is typically dispersed throughout the globe in the following year,” says Zobel. “So even though the tropical Pacific might return to normal, that energy is still in the system.”
However, atmospheric scientists are already seeing signs that El Niño is slowing down and flipping to its counterpart, La Niña, adding another layer of complexity to predictions for 2024.
“The 2024 hurricane season is a large concern,” says Zobel. “La Niña is a lot more conducive to tropical cyclone development. If we combine above average numbers with the amount of energy that storms have to feed on, it’ll be a shock to the system.”
What does this mean for 1.5?
In the discussions around 2023’s temperatures, one number dominates the conversation: 1.5 degrees C. This is the amount of warming countries around the world agreed to try to avoid surpassing, in accordance with the United Nations’ 2015 Paris Climate Agreement. Estimates from Berkeley Earth say that 2023 may have been the first year spent above that threshold.
This assertion may take several years to verify— one year spent physically above 1.5 degrees of warming does not indicate the UN threshold has been permanently passed. What scientists are looking for is a clear average trend line rising above 1.5 degrees C without coming back down, and for that you need several years of data. That, regrettably, creates a lag time between climate impacts and updating climate policy. But, for many, the debate around the arbitrary 1.5 degree goal has become a distraction. Schwalm says scientists and policy-makers should be focusing on urgently combating climate change whatever the numbers say.
“We are already living in a post-Paris Agreement reality,” says Schwalm. “The sooner we admit that and reimagine climate policy, the better.”
“Actual real world impacts are going to be there, whether we’re at 1.48 or 1.52,” says Zobel.
And Francis agrees. “There are so many indicators telling us that big changes are underfoot, that we are experiencing major climate change, but reaching 1.5 isn’t going to all of a sudden make those things worse. It’s just one more reminder we’re still on the wrong track and we’d better hurry up and do something.”
If the summer of 2023 felt abnormally hot to you, that’s because it was. With heat waves making headlines month after month, this year saw a spike in temperatures that broke global records.
September 2023 followed in the footsteps of both August and July as the hottest each month has been since temperature record-keeping began, making the late summer of 2023 Earth’s hottest yet. Here’s how 2023’s sweltering heat compares to past years:
- Global average surface air temperature reached a record high in the summer of 2023.
- July 24th, 2022 was the hottest day of last year, at 62.5 degrees F.
- July 3rd, 2023 was the first day that was hotter than the hottest day in 2022.
- July 6th, 2023 was Earth’s hottest day on record.
- 42 days this year were hotter than the hottest day in 2022.
Record-breaking heat in 2023
In North America alone, 78 all time records for hottest temperature were broken over the course of June, July and August. In New Iberia, Louisiana, the temperature record was broken four times, peaking at 109 degrees F. Places as far north as Wainwright Airport in Alaska saw temperatures as high as 84 degrees.
Humidity makes the heat deadly
Extreme heat events like these present a serious danger to human health. That threat is multiplied when instances of high temperature coincide with high humidity— interrupting the ability of the human body to cool off through evaporating sweat. A recent paper, co-authored by Woodwell Climate Risk Program director, Dr. Christopher Schwalm, defines “lethal heat” as a wet bulb temperature (a measure combining heat and humidity) of 35 degrees C (95 degrees F). Prolonged exposure— over 6 hours— to temperatures exceeding this can result in death even for a healthy person keeping hydrated in the shade
According to the paper, instances of deadly heat waves are increasing with climate change. Already, with over a degree of warming, parts of Northern India are seeing annual heat events. By just two degrees of warming— a milestone we are currently on track to hit by mid-century— a quarter of the world is expected to experience a lethal heat event at least once in a decade. A significant subset of the world, particularly regions of India, Africa, South America, and the Southeastern US, can expect deadly heat conditions at least once a year at that point, and the area will expand wider with each half degree of warming.
It’s a forecast that highlights the urgency of acting to mitigate warming and developing local and regional strategies to prepare communities to handle high heat and humidity events when they do come.
“It puts this past year’s heat waves into somber perspective,” says Dr. Schwalm. “Without action, we put a lot more, potentially billions, of people at risk of heat stress or death on an annual basis. It’s a significant public health concern.”
Fires, heatwaves get an early start this year
In some places, an extreme summer has already begun

Springtime in the Northern hemisphere is a momentary respite for many places—a pause before the heat of summer and potential for drought and fire. This year, however, summer arrived early, bringing with it scorching temperatures and out-of-control fires that have made national and international headlines.
Record March-April heatwave sweeps India and Pakistan
Portions of India and Pakistan already have experienced record-setting heat. Unseasonably warm weather began in March, when India recorded the hottest monthly temperatures that the country has seen in the past 122 years—hitting an average maximum of 33.1 degrees Celsius (91.6 Fahrenheit). The heatwave continued with the third hottest April on record. The hottest time for India is typically May and June, before the monsoon season begins.
In addition to the early start of summer temperatures, this heat wave is particularly concerning for its scope. The heat has settled over most of India as well as parts of neighboring Pakistan for two months.
“The most shocking part for me has been the geographical extent and the duration,” said Woodwell Assistant Scientist, Dr. Zach Zobel in an interview with CNBC.
The heat-related death toll in Maharashtra state, the second-most populous state in India, has already reached 25. Heat waves like this one become particularly dangerous when humidity is high—preventing the human body from cooling itself through sweat and evaporation.
Earlier and more intense heat waves also have the potential to disrupt India’s crop yields, particularly heat, which is vulnerable to hot, dry weather. As climate change progresses unchecked, extreme heat waves like this one will become more and more common.
Megafires in New Mexico forcing evacuations
On the other side of the globe, rising temperatures have resulted in a rash of destructive fires well before the usual summer season. The state of New Mexico is currently fighting 20 separate fires in 16 counties. Two, the Hermit’s Peak and Calf Canyon fires, recently merged into the state’s second-largest wildfire on record, which has been burning now for more than a month.
The merged “megafire” has destroyed at least 276 structures and forced the evacuation of nearly 13,000 residences.
New Mexico is used to a fire season that starts in May or June. Climate change is making out-of-season fires more common and big fires were seen this year in Colorado and California as early as December and January. The United Nations declared a global wildfire crisis in February.
Climate change is warming and drying out western U.S. states, increasing the number of “fire weather days.” This has made fire management harder, limiting the possible timeframe for prescribed burns that reduce fuel loads. Intense winds also played a large role in fanning the New Mexico fires, one of which began as a prescribed burn that escaped.
Heat rising, summers lengthening with climate change
As temperatures rise, the risks from deadly heatwaves and wildfire are growing. Fire seasons and extreme heat seasons are lengthening, frequently starting earlier and ending later, giving the land no time to recover from dry winters or the prior year’s heat. The response to both the fires in New Mexico and heat in India and Pakistan is the same—rapidly reducing global emissions by 15% every year to hit the IPCC target of 1.5 degrees of warming.
“There is no question that heat waves are made worse by fossil fuels and climate change everywhere in the globe,” said Dr. Zobel. “India and Pakistan are two of the hottest places in the world and will likely continue to see heat waves of this magnitude and worse over the next several decades.”
Unequal heat
A visit to Worcester, Massachusetts in the heat of summer highlights the inequities of rising temperatures
It’s a hot, humid day in late August and we’re all already sweating as Arman Bajracharya begins to tell us about his project.
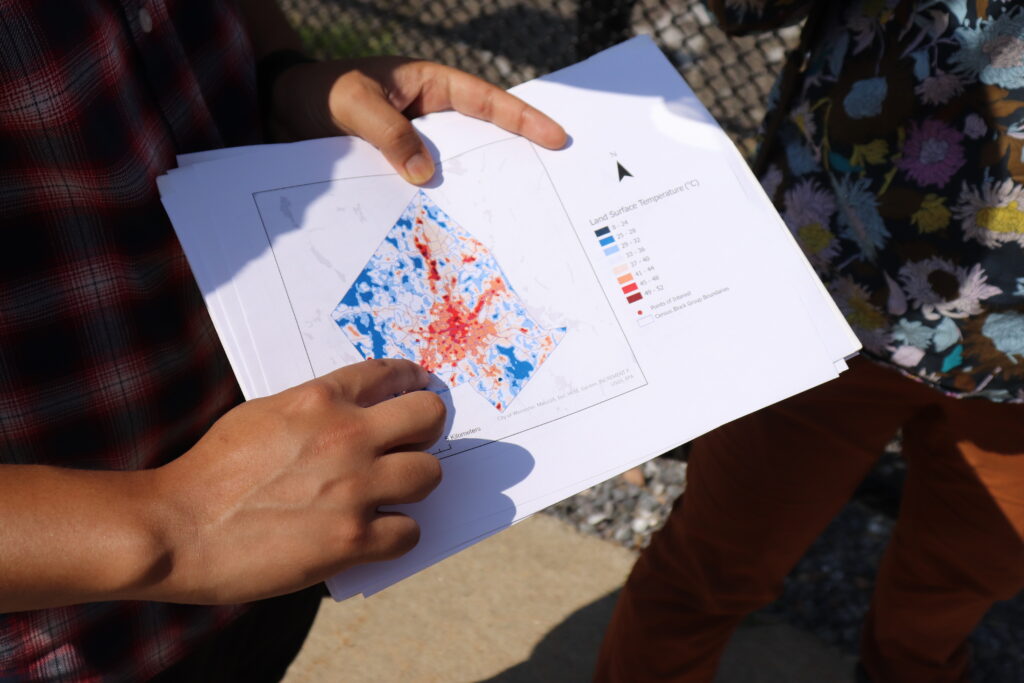
Bajracharya is a second year Ph.D. student in the geography department at Clark University in Worcester, MA, where we’re standing now. He pulls out a green and orange map of the city and points to our location on one of the orange blocks that signals industrial land use and impervious land cover.
We’re standing in the sparse shade of some trees ringing the edge of an old millpond, but we had to walk across a hot, cracked parking lot to access it. The neighborhood is called Webster Square. It is located in the southern reaches of Worcester, which was once a vibrant epicenter of the industrial revolution.
That industrial heritage is evident both on the maps Bajracharya shows us as well as in our surroundings. Truck beds and spare pvc piping and gravel piles rest at the edge of the water. It’s also scorching hot.
Temperature varies with land cover. In cities, the presence of impervious surfaces like asphalt, concrete, and metal trap heat, while natural surfaces—water or vegetation—can help buffer it. The distribution of these hotspots and heat buffers in Worcester, as in many cities, is not equal. Some neighborhoods endure much higher temperatures than others during the summer months.
Bajracharya’s research during the Summer of 2021 made possible by the Edna Bailey Sussman Fund employed remote sensing and census data to determine what features make a neighborhood more susceptible to extreme heat. He mapped temperature, land cover, and land use onto areas of greatest social vulnerability in Worcester, as well as two other post-industrial cities in Massachusetts, Haverhill and New Bedford. The results show that as climate change warms cities, the communities that have already experienced environmental inequities are likely to face more.
A gateway to the American dream
Worcester, Haverhill, and New Bedford are designated as gateway cities. These places, often important centers of the industrial revolution, have served as “gateways to the American dream,” offering job opportunities and housing for many who immigrated to the region.
Worcester began its industrial life as a mill town but soon grew into a manufacturing center for a variety of goods. It was also a crossroads of canal, and later, rail thoroughfares connecting the rest of Massachusetts with Providence and New York. Today, at the edge of the millpond in Webster Square, the remnants of an old rail bridge are still visible and active trains can be heard traveling the present day rail lines in the distance.
Industrial neighborhoods built to serve mills and factories often filled in with minority populations, and over time, wealthier families moved to quieter and more suburban areas of town. In the case of Haverhill, some communities also suffered the consequences of redlining, a discriminatory Federal Housing policy during the post-Depression era that limited financial services available to people, overwhelmingly African-American and people of color, deemed “hazardous to investment,” limiting social mobility and enforcing racial housing segregation. These factors often intensified the overlap between areas of high social vulnerability and industrial infrastructure.
“In the 1930s, these practices delineated which areas were defined to be good for financial services like loans,” Bajracharya says. “Which is why there is a historical divide between which areas are favorable and which areas are not. That can impact how we see the land being used today, especially where the greenspaces are.”
Mapping the heat
Bajracharya used available satellite data to show the relationship between land cover and social vulnerability. Examining the imagery, he created an index of relative heat in the city. Areas with high tree cover correlated with lower land surface temperatures. He then overlaid social vulnerability and environmental justice datasets that index communities in Massachusetts based on socioeconomic status, minority status, primary language, and other demographic information.
“Throughout many or most U.S. cities, neighborhoods facing greater environmental risks (such as from heat waves, urban flooding, and hazardous wastes) were historically settled by poorer families or racial and ethnic minorities,” Bajracharya says. “And there really is a lot of evidence for communities of color, or low-income communities, continuing to be disproportionately exposed to risk.”
According to Bajracharya, the analysis showed a startling overlap between the hottest areas of the city and the most vulnerable. Neighborhoods classified as Environmental Justice Communities tended to have a lower percentage of green vegetation (especially tree cover), with higher average temperatures. The most vulnerable areas are clustered in the core of the city.
The satellite maps only tell part of the story, however, which is why Bajracharya and his advisor Dr. Rinku Roy Chowdhury have brought us out onto the streets of Worcester. A few blocks away from the millpond, a grassy field rolls out behind a chain-link fence. In Bajacharya’s maps, this appears as a patch of vegetation interspersed among the developed land uses. The field sits under metal towers belonging to a nearby power station.
Often, Roy Chowdhury reminds us, the “green” and “blue” spaces that do exist in vulnerable areas may be inaccessible to residents, either cordoned off as private property or unsuitable for use due to safety concerns or an absence of trails or paths. The sign on the chain-link fence here warns of danger from high voltage.
This is where the distinction between land cover and land use becomes important. Land cover refers to what is currently on the land— whether that’s forest, grassland, or concrete. Land use data shows how humans are interacting with an area of land. For example, an area of grassy land cover could be used for conservation, residential or commercial purposes.
When natural land covers such as trees and water bodies are present but inaccessible, it limits potential social co-benefits that green and blue spaces can offer. Beyond regulating temperature, these spaces can reduce air pollution and provide recreational opportunities. Bajracharya and Dr. Roy Chowdhury emphasize the importance of field trips like this one, along with more in-depth work to ground truth satellite image analysis in local realities.
“There’s a really interesting mix of industrial and commercial uses interspersed with areas important for conservation and recreation, that could also potentially help in bringing down surface temperatures,” Dr. Roy Chowdhury says. “Tree cover and water are really helpful for buffering against the urban heat island, but so much more needs to be done to understand and steward such ‘ecosystem services,’ especially in underserved areas of cities.”
Building an Emerald City
With climate change accelerating, every patch of green and blue on the map will become indispensable in regulating city temperatures. To prevent a crisis of infrastructure failures and heat-related illnesses and even deaths from unfolding during brutal summers, cities like Worcester are going to have to get greener, faster—and do so in a way that benefits residents equitably.
Dr. Roy Chowdhury and Bajracharya are interested in investigating further to figure out the most promising pathways towards greener, more equitable cities. Questions still remain around finding the best proportion and distribution of land cover and implementation strategies that will improve environmental equity and encourage citizen participation. Woodwell’s Dr. Chris Neill has been collaborating with Dr. Roy Chowdhury and Clark University over the last decade to analyze land cover and ecological structure of urban vegetation in several US cities.
“Every tree makes a difference, but there are scale effects as well. What is the minimum threshold to make a difference? What’s the mix in different cities or neighborhoods? What do local residents value and want? These are really interesting and important questions to ask,” says Dr. Roy Chowdhury.
Research into the interactions between these green spaces and rising temperatures could help city planners make more conscious decisions about climate adaptation. Baracharya’s future projects may also examine flooding risk in cities, which adds another dimension to potential inequities in climate risk. Future research could also incorporate social interviews in different neighborhoods to understand residents’ concerns regarding their environment, climate change, and quality of life.
The last stop on our Worcester tour is Beaver Brook Park— an example of what’s possible when a city decides to reinvest in its natural spaces. The neighborhood surrounding the park was a primary destination for Black Americans moving north after the Civil War and has a history as a vibrant minority community. The titular brook had been paved over years ago, running in darkness under the city until 1990, when it was daylighted again to serve as a central feature of the park.
The area is now a green haven for recreation in the neighborhood and a stop on Worcester’s East-West trail, which Dr. Roy Chowdhury describes as “an emerald necklace” running through Worcester—one of the ways the city and numerous environmental stewardship organizations are working towards broader greenspace protections and access.
The feel of the air here contrasts sharply with where we started the day—a hint of the power urban greenspaces hold. Despite the heat warping off the street pavement, in the shade of old oak trees by the gurgling brook, it’s easy to stop sweating for a moment and just feel the breeze.
Imagining Earth’s most probable futures
New climate education initiative portrays the warmer worlds we are likely to see this century, in hopes of preventing them
One point five—most readers will recognize that number as the generally accepted upper limit of permissible climate warming. With current temperatures already hovering at 1.1 degrees Celsius above the historical average, the race is on to hit that target, and the likelihood that we will surpass it is growing. Even if we do manage a 1.5 degree future, that’s still warmer than today’s world, which is already seeing devastating climate impacts.
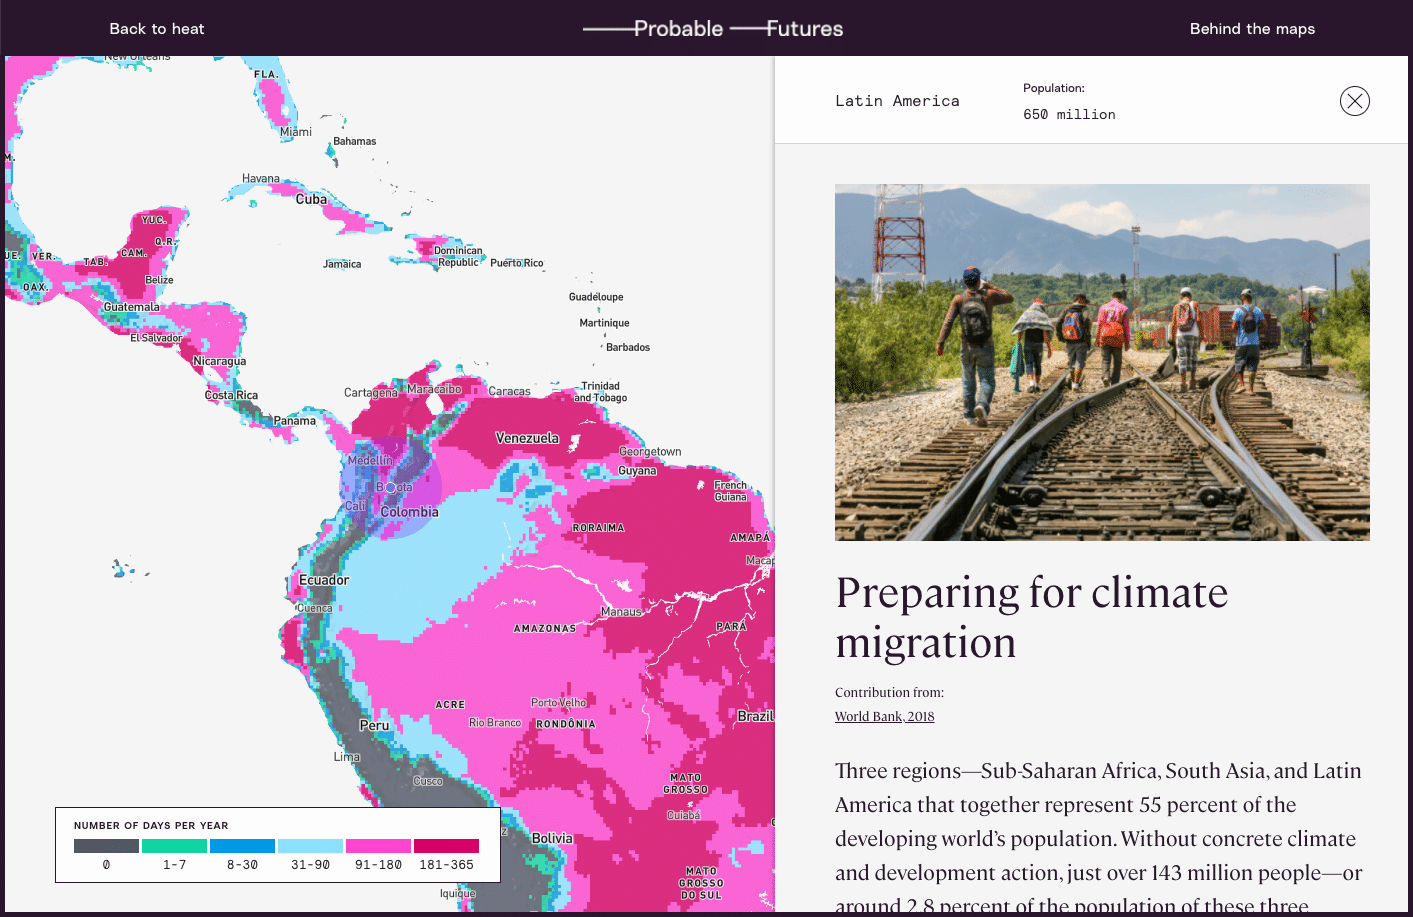
So what will it actually feel like to live in a 1.5 degree world—or a 2 degree one, or even 3? The Probable Futures initiative has built a tool to help everyone imagine.
Building a bridge between science and society
Probable Futures is a newly launched climate literacy initiative with the goal of reframing the way society thinks about climate change. The initiative was founded by Dr. Spencer Glendon, a senior fellow with Woodwell Climate who, after investigating climate change as Director of Research at Wellington Management, noticed a gap in need of bridging between climate scientists and, well… everyone else.
According to Dr. Glendon, although there was an abundance of available climate science, it wasn’t necessarily accessible to the people who needed to use it. The way scientists spoke about climate impacts didn’t connect with the way most businesses, governments, and communities thought about their operations. There was no easy way for individuals to pose questions of climate science and explore what the answers might mean for them.
In short, the public didn’t know what questions to ask and the technical world of climate modeling wasn’t really inviting audience participation. But it desperately needed to. Because tackling climate change requires everyone’s participation.
“The idea that climate change is somebody else’s job needs to go away,” Dr. Glendon says. “It isn’t anybody else’s job. It’s everybody’s job.”
So, working with scientists and communicators from Woodwell, Dr. Glendon devised Probable Futures—a website that would offer tools and resources to help the public understand climate change in a way that makes it meaningful to everybody. The site employs well-established models to map changing temperatures, precipitation levels, and drought through escalating potential warming scenarios. The data is coupled with accessible content on the fundamentals of climate science and examples of it playing out in today’s world.
According to the initiative’s Executive Director, Alison Smart, Probable Futures is designed to give individuals a gateway into climate science.
“No matter where one might be on their journey to understand climate change, we hope Probable Futures can serve as a trusted resource. This is where you can come to understand the big picture context and the physical limits of our planet, how those systems work, and how they will change as the planet warms,” Smart says.
Storytelling for the future
As the world awakens to the issue of climate change, there is a growing group of individuals who will need to better understand its impacts. Supply chain managers, for example, who are now tasked with figuring out how to get their companies to zero emissions. Or parents, trying to understand how to prepare their kids for the future. Probable Futures provides the tools and encouragement to help anyone ask good questions about climate science.
To that end, the site leans on storytelling that encourages visitors to imagine their lives in the context of a changing world. The maps display forecasts for 1.5, 2, 2.5, and 3 degrees of warming—our most probable futures, with nearly 3 degrees likely by the end of the century on our current trajectory. For the warming we have already surpassed, place-based stories of vulnerable human systems, threatened infrastructure, and disruptions to the natural world, give some sense of the impacts society is already feeling.
According to Isabelle Runde, a Research Assistant with Woodwell’s Risk Program who helped develop the maps and data visualizations for the Probable Futures site, encouraging imagination is what sets the initiative apart from other forms of climate communication.
“The imagination piece has been missing in communication between the scientific community and the broader public,” Runde says. “Probable Futures provides the framework for people to learn about climate change and enter that place [of imagination], while making it more personal.”
Glendon believes that good storytelling in science communication can have the same kind of impact as well-imagined speculative fiction, which has a history of providing glimpses of the future for society to react against. Glendon uses the example of George Orwell who, by imagining unsettling yet possible worlds, influenced debates around policy and culture for decades. The same could be true for climate communication.
“I’m not sure we need more science fiction about other worlds,” Glendon says. “We need fiction about the future of this world. We need an imaginative application of what we know.” Glendon hopes that the factual information on Probable Futures will spark speculative imaginings that could help push society away from a future we don’t want to see.
For Smart, imagining the future doesn’t mean only painting a picture of how the world could change for the worse. It can also mean sketching out the ways in which humans will react to and shape our new surroundings for the better.
“We acknowledge that there are constraints to how we can live on this planet, and imagining how we live within those constraints can be a really exciting thing,” Smart says. “We may find more community in those worlds. We may find less consumption but more satisfaction in those worlds. We may find more connection to human beings on the other side of the planet. And that’s what makes me the most hopeful.”