map by Greg Fiske


Producing climate knowledge is only part of the challenge. It also has to be translated into information people can explore, understand, and use. Woodwell develops practical ways to make complex climate science more accessible and actionable.
map by Christina Shintani
Climate research generates enormous amounts of information. Satellite observations, field measurements, models, and datasets can reveal how our planet is changing. But that information is only useful if people can understand it and put it to work.
Woodwell brings these different sources of information together in practical tools designed for use beyond the research community.
map by Greg Fiske
Climate research can produce enormous datasets, model outputs, satellite observations, maps, and field measurements. Woodwell brings those pieces together in tools that help people do something with the information—explore risk in a particular place, compare locations, monitor changes across landscapes, measure environmental conditions, or support a specific decision.
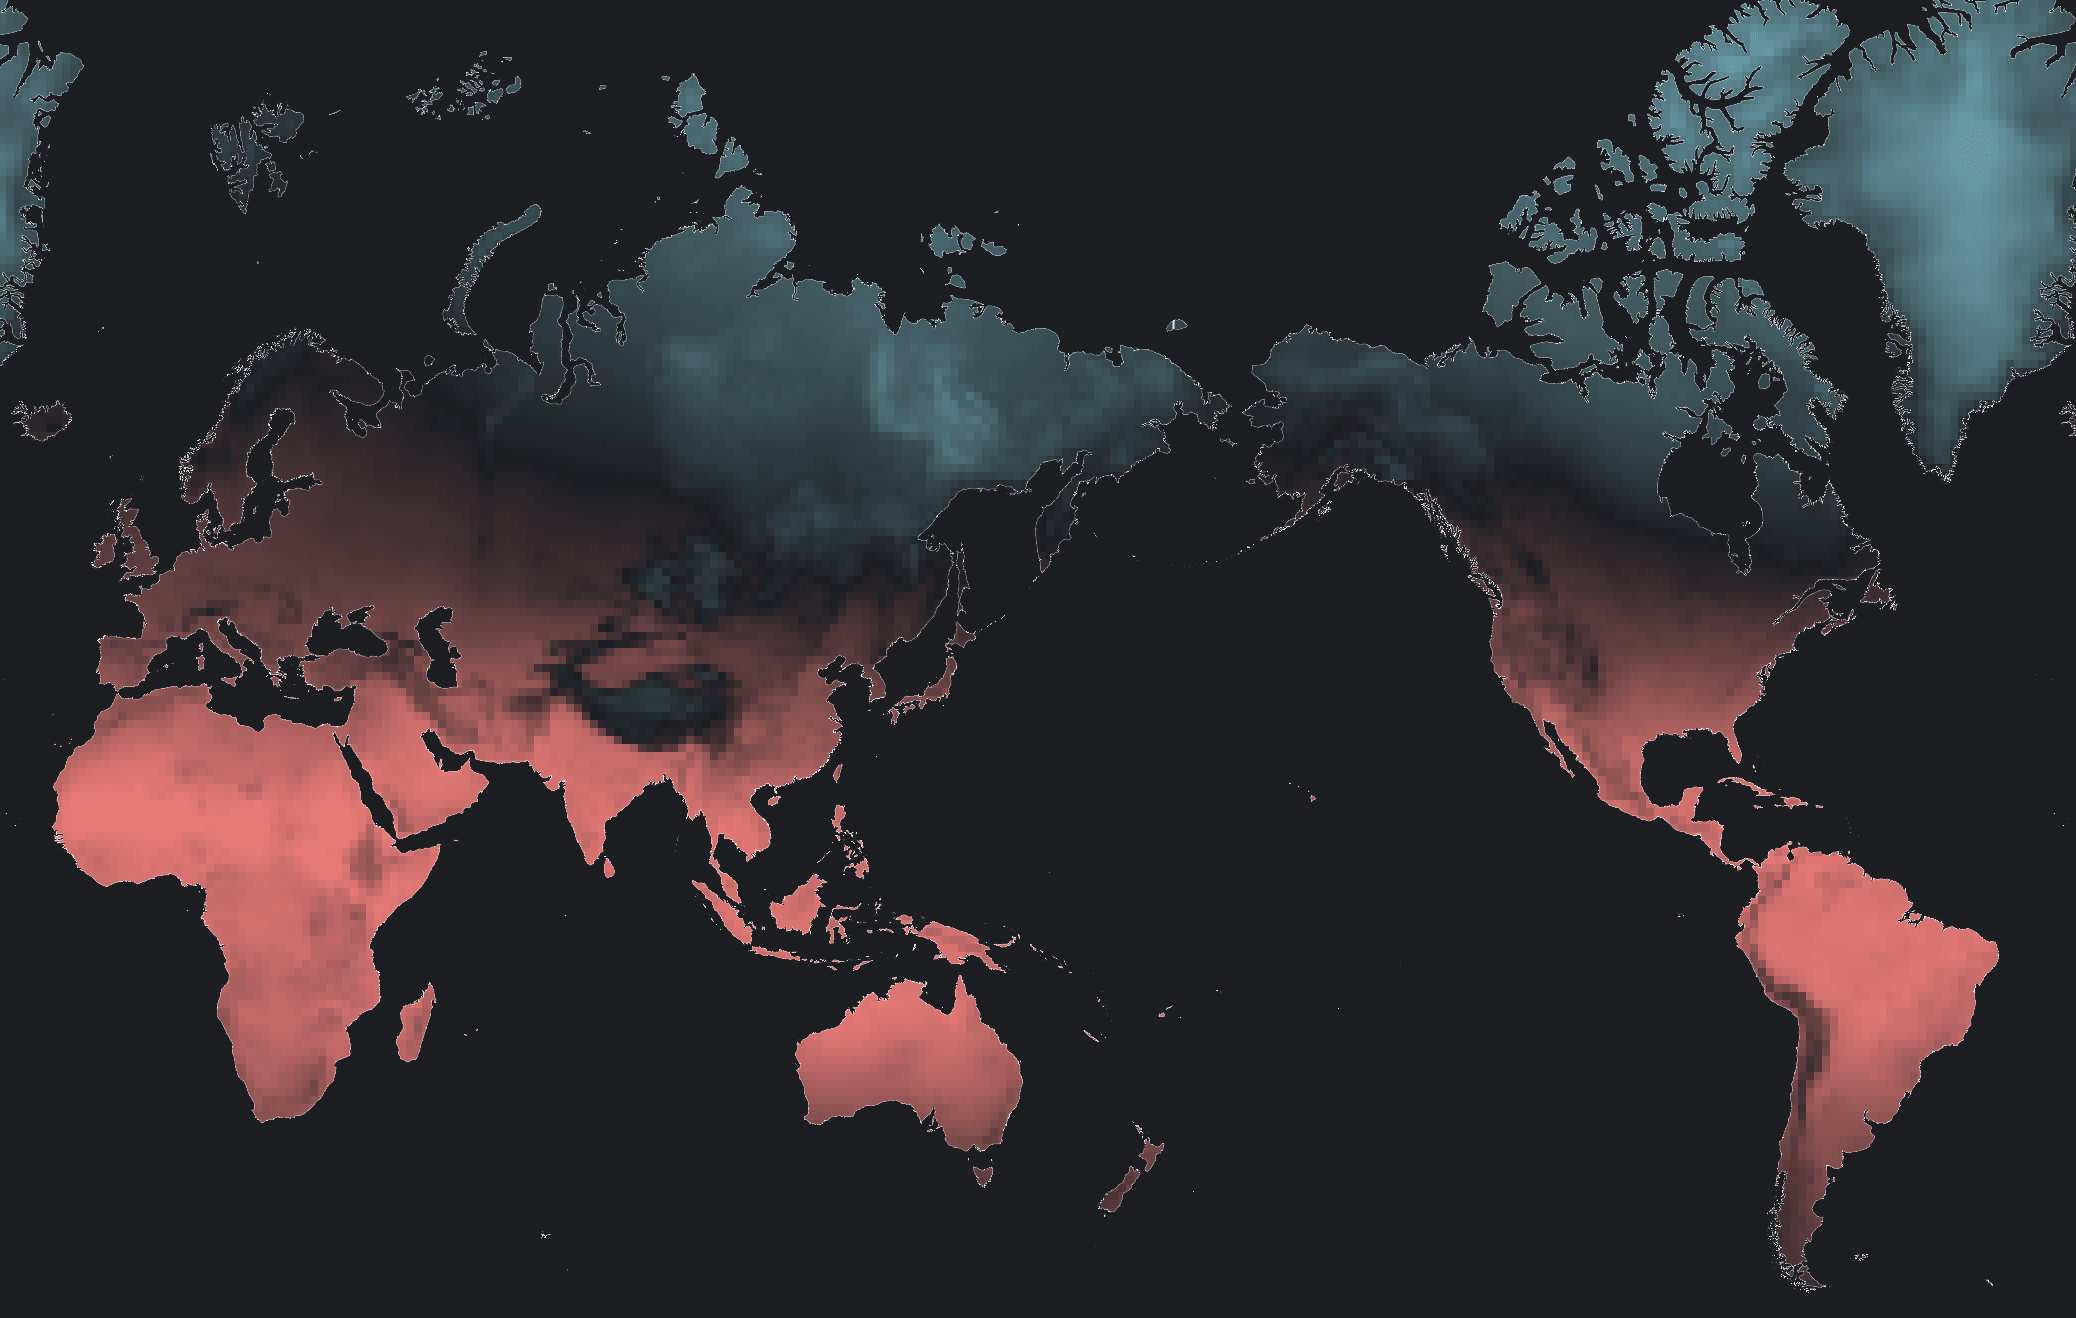
The Climate Risk Viewer turns Woodwell’s climate-risk modeling into an interactive map that allows users to explore how hazards such as extreme heat, drought, wildfire, annual precipitation, and sea-level rise may vary across places and levels of warming. The broader climate-risk platform is also designed to support assessment of multiple locations or assets, helping translate complex model results into information that can inform risk analysis, infrastructure and resilience planning, and investment decisions.
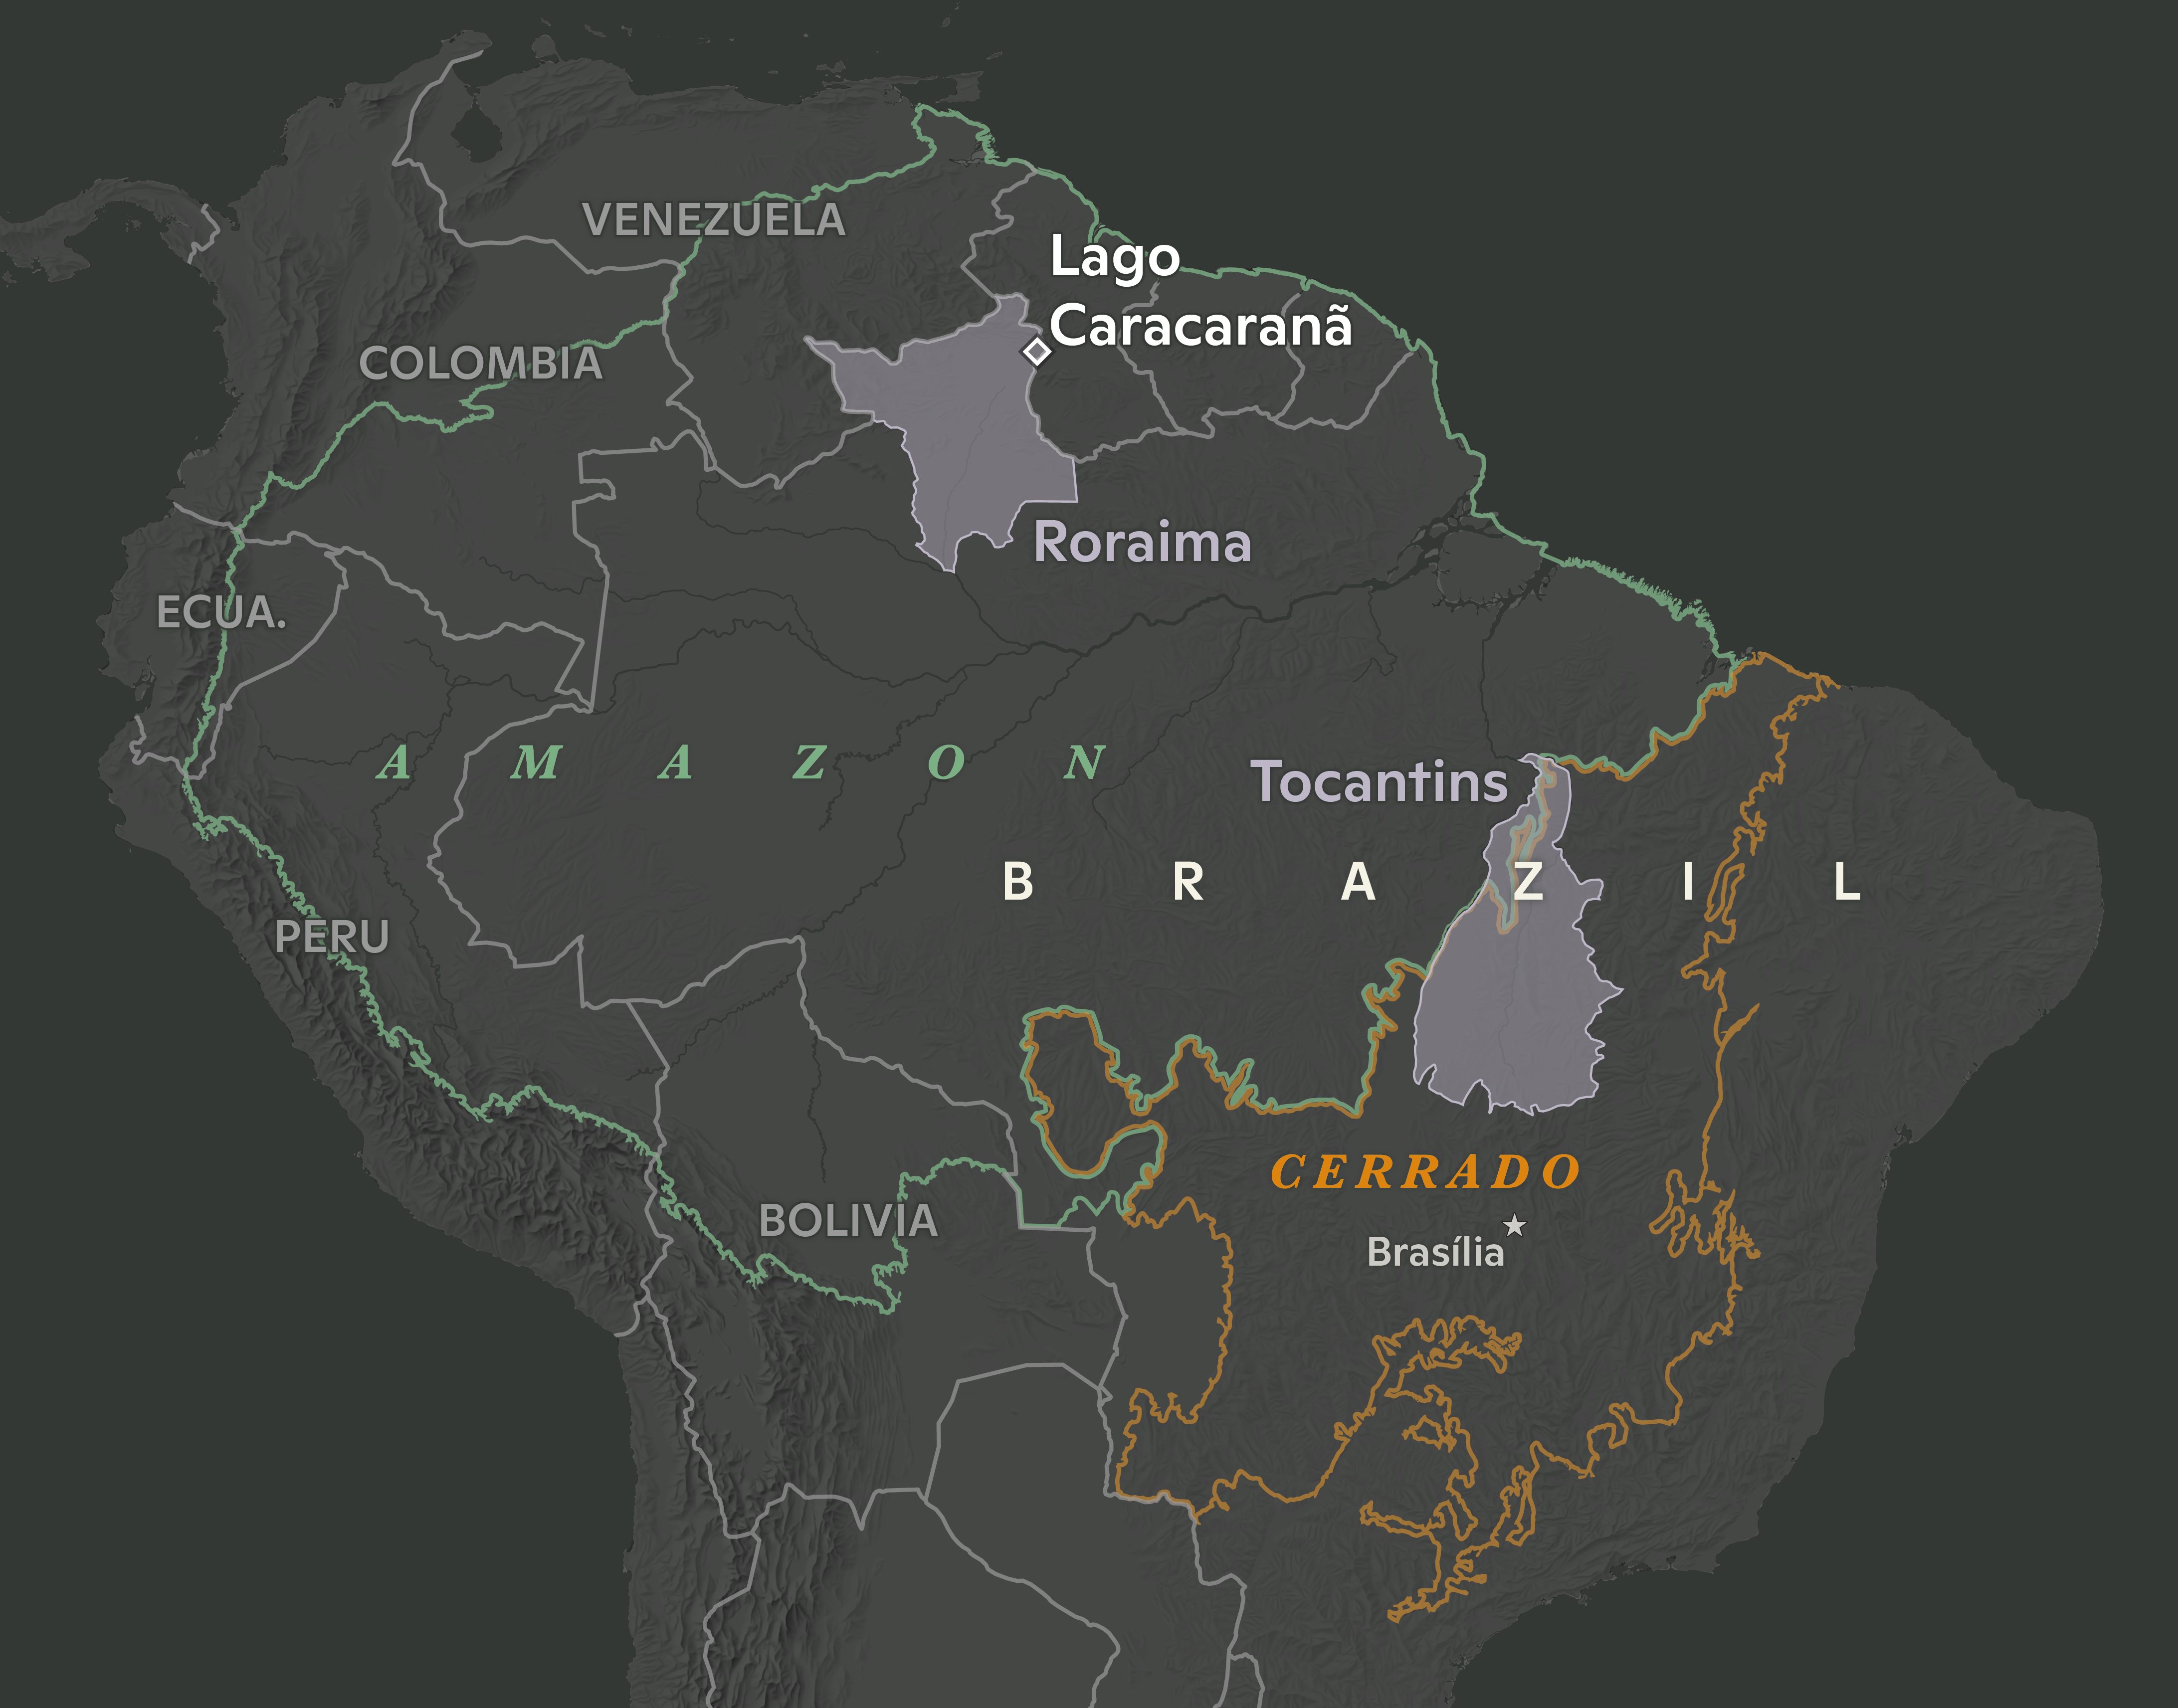
The Landscape Capital Index brings together more than 40 geospatial datasets to assess a landscape’s potential to deliver climate mitigation and conservation outcomes, along with other benefits, while also accounting for risks that could affect those outcomes. By bringing these dimensions into a consistent, independent framework, the tool is designed to support more informed assessment of nature-based climate solutions including land-based carbon and conservation opportunities.
map by Robyn Thiessen-Bock
Some questions cannot be answered with a single measurement. They require information that can be updated across large areas and over time.
Woodwell’s Rangeland System for Tracking and Reporting Carbon Benefits (RangeSTAR) combines satellite observations, ecosystem modeling, and field measurements to track carbon across grazing lands at high spatial and temporal resolution. It can show whether landscapes are gaining or losing carbon and how those patterns change over time, helping users assess carbon gains and losses across grazing lands and apply that evidence to land-management and carbon-accounting decisions. The underlying model is peer-reviewed and publicly available, while additional web applications are still in development. Additional module development will include soil water tracking, ecosystem response to grazing, drought and fire risk assessments and ecosystem disturbance response.
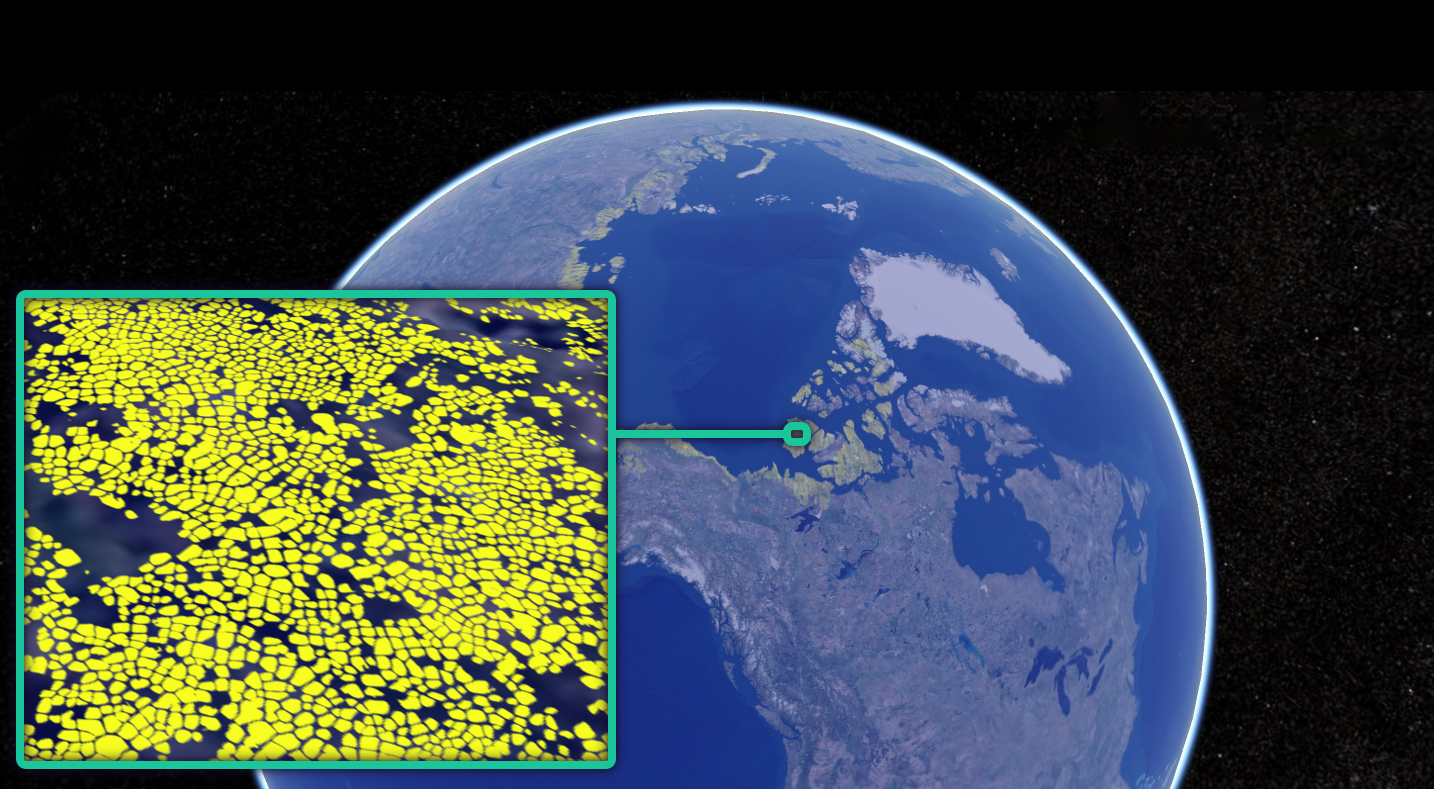
The Permafrost Discovery Gateway (PDG) tackles a different monitoring challenge, using sub-meter scale satellite imagery, AI, and high-performance computing to monitor change across the pan-Arctic permafrost landscape and makes the map products discoverable. Traditional GIS software is unable to process these large datasets. The PDG makes the information freely available to researchers, communities, decision-makers, and the public, via a regular web browser, helping them better understand and act upon a rapidly changing Arctic.
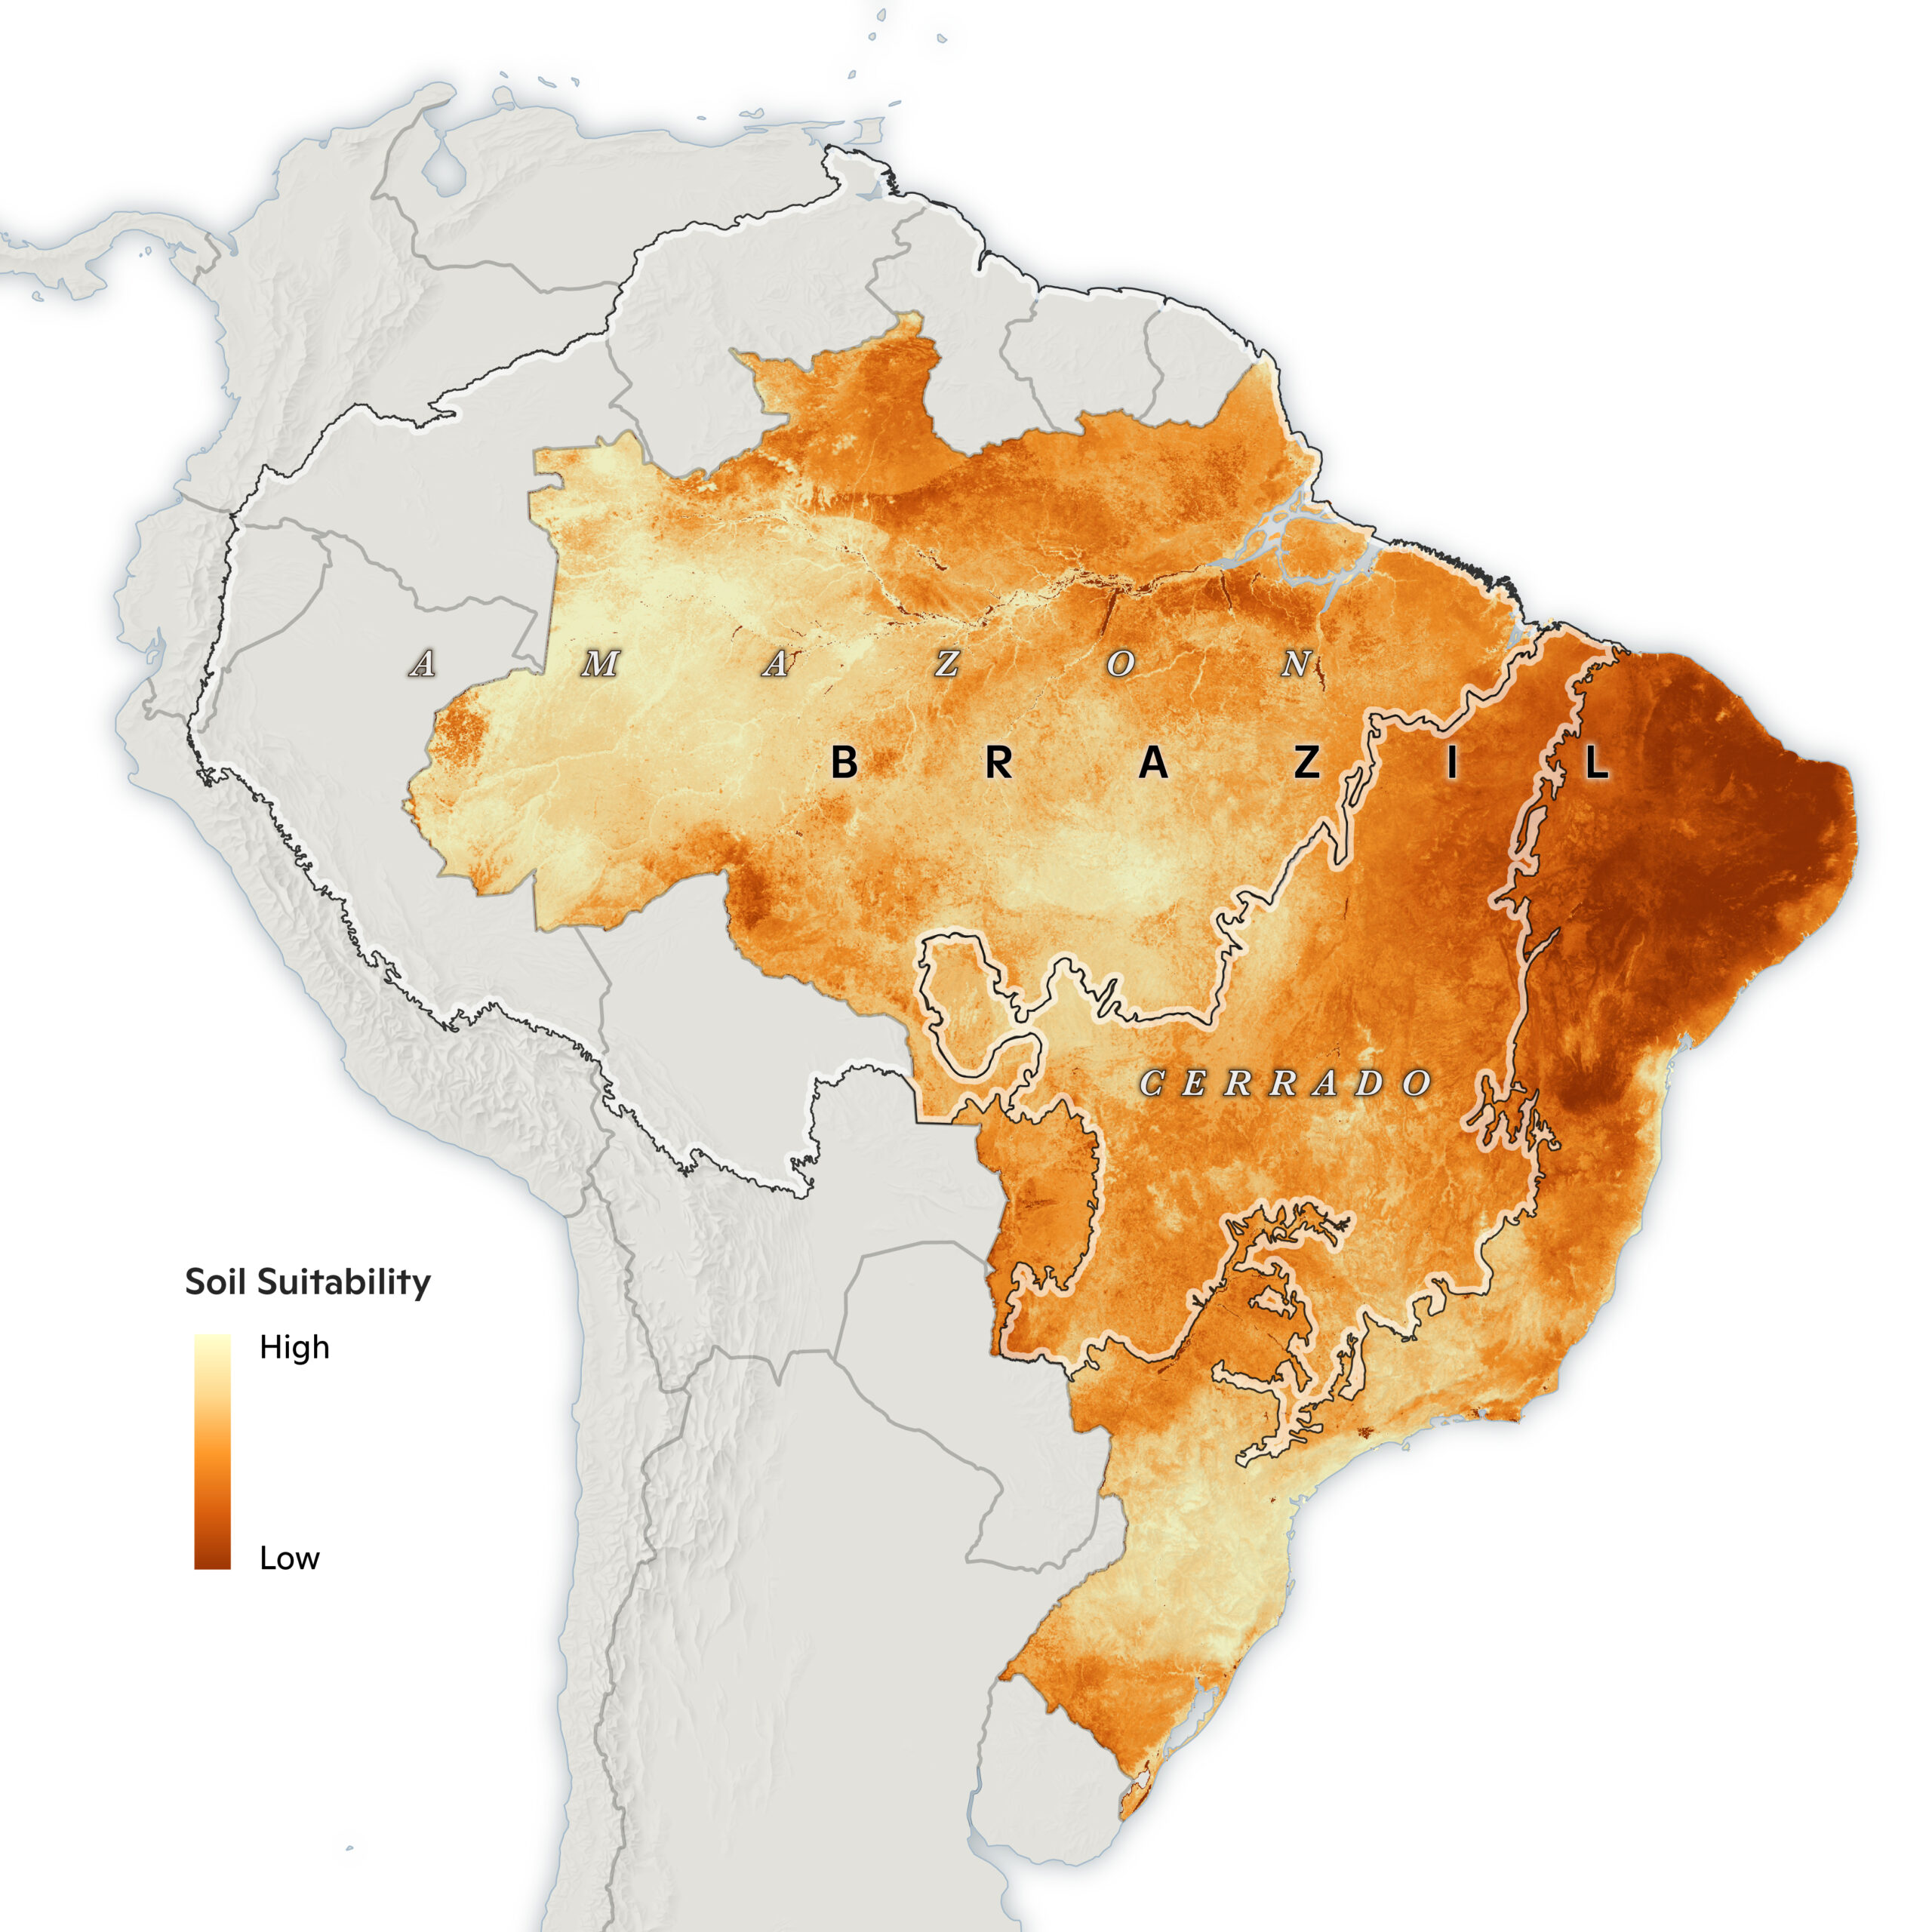
Tools can also reduce the cost and technical barriers involved in gathering environmental information.
Soil Spectroscopy for Global Good uses light reflected from soil samples to estimate properties that would otherwise require more time-consuming and expensive laboratory analysis. Its open platform gives researchers and soil professionals access to spectral data, analytical tools, code, training, and models that can turn soil spectra into estimates of useful properties such as soil organic carbon.
Other resources are designed to make Woodwell’s mapping capabilities easier to find and use. Cartolab, for example, is being developed as a central place to explore Woodwell maps, see the range of the cartography team’s work, and request custom mapping support for research and communication needs.
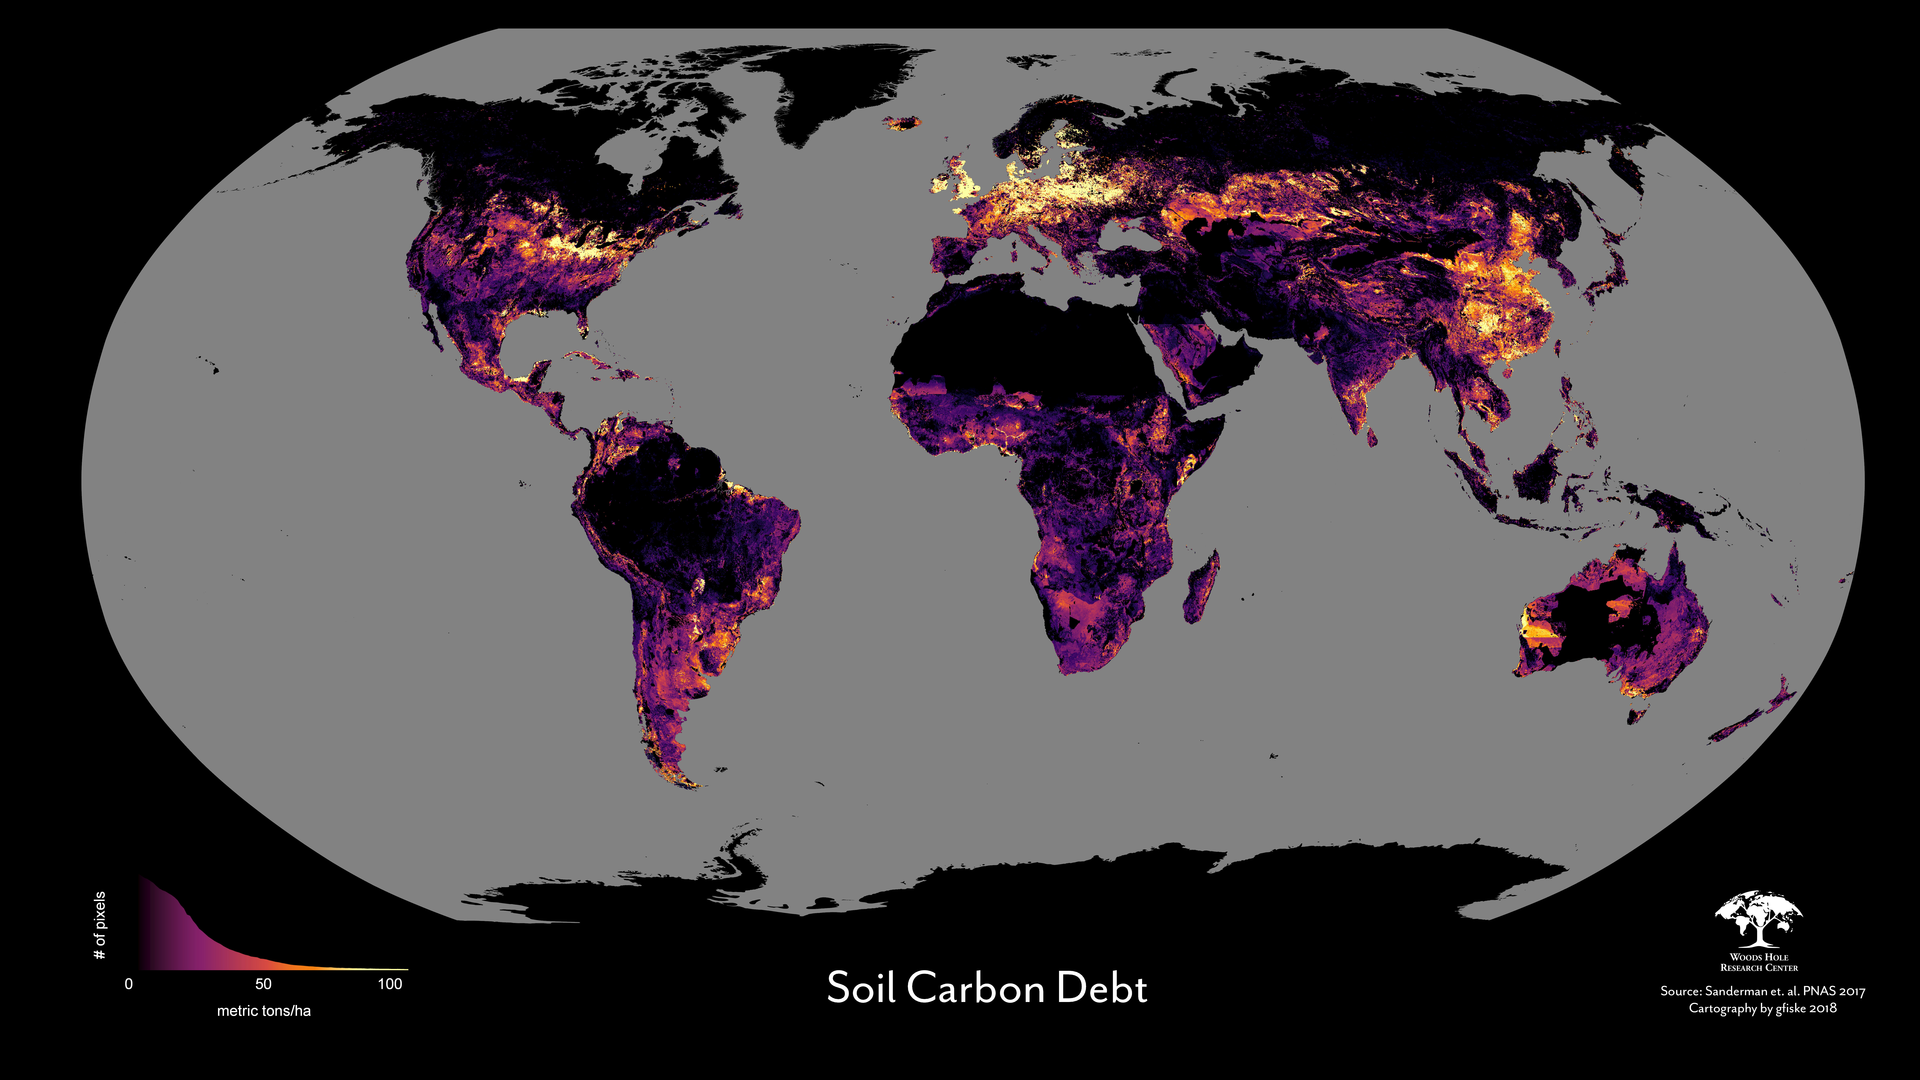
map by Greg Fiske
A useful tool should not be a black box. Across several of these platforms, Woodwell emphasizes transparent methods, peer-reviewed science, and open data or code so users can understand where the information comes from and how results are produced.
Those tools demonstrate what becomes possible when science and technology work together. By making complex climate information accessible and usable beyond individual studies and projects, they extend the reach of Woodwell’s science and help people turn knowledge into informed decisions and meaningful actions.